. 2015 May 8:4:e05462.
doi: 10.7554/eLife.05462.

Dosage compensation can buffer copy-number variation in wild yeast

Affiliations

Dosage compensation can buffer copy-number variation in wild yeast

James Hose et al. Elife. .

Erratum in

Abstract

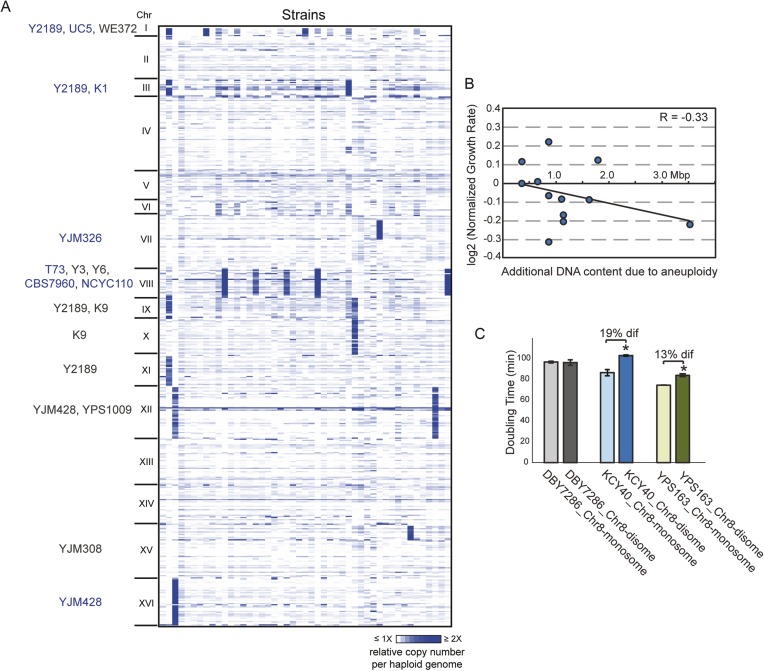
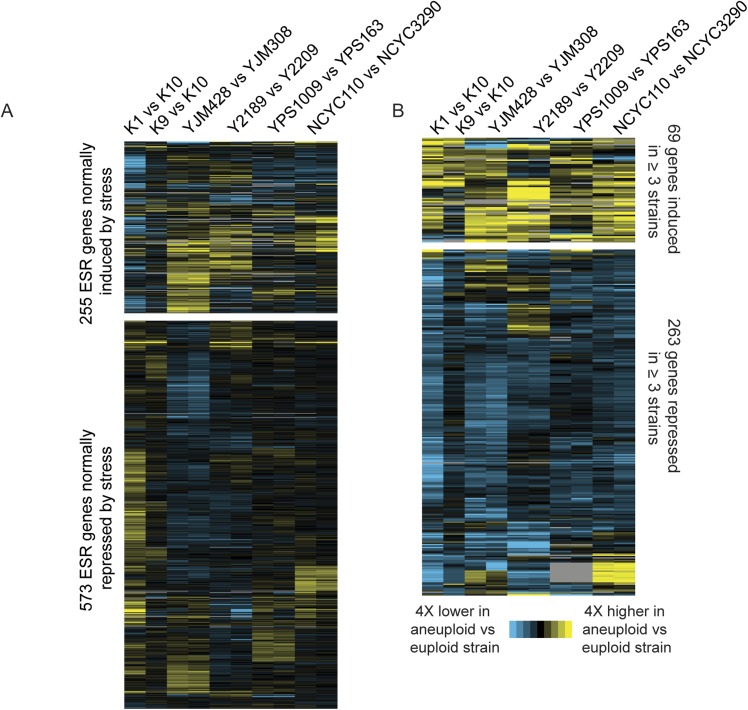
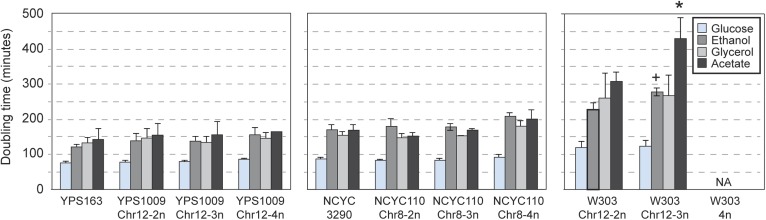
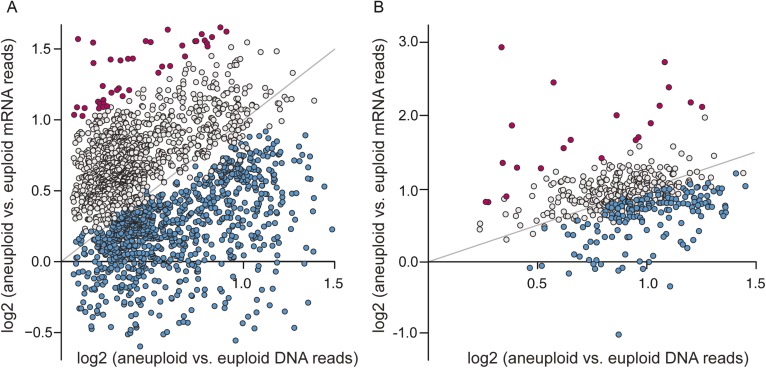
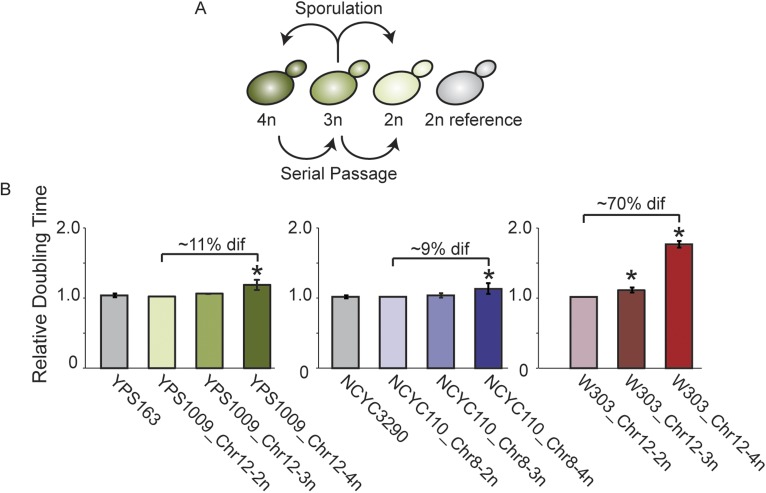
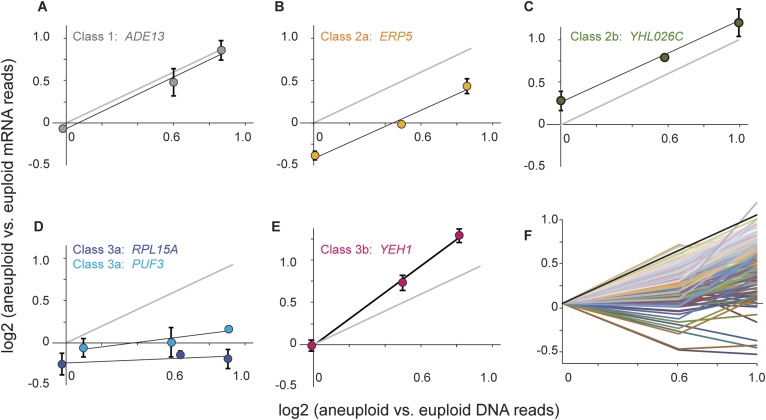
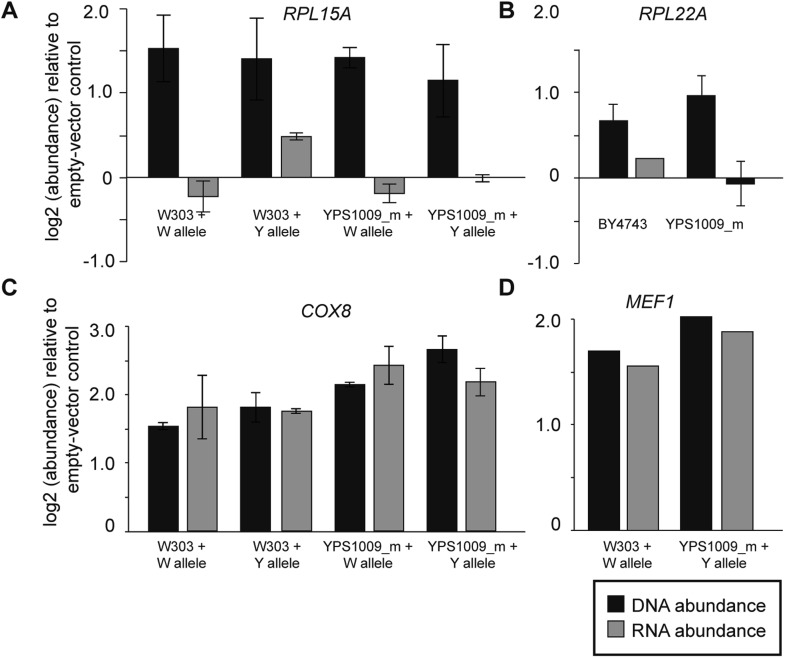
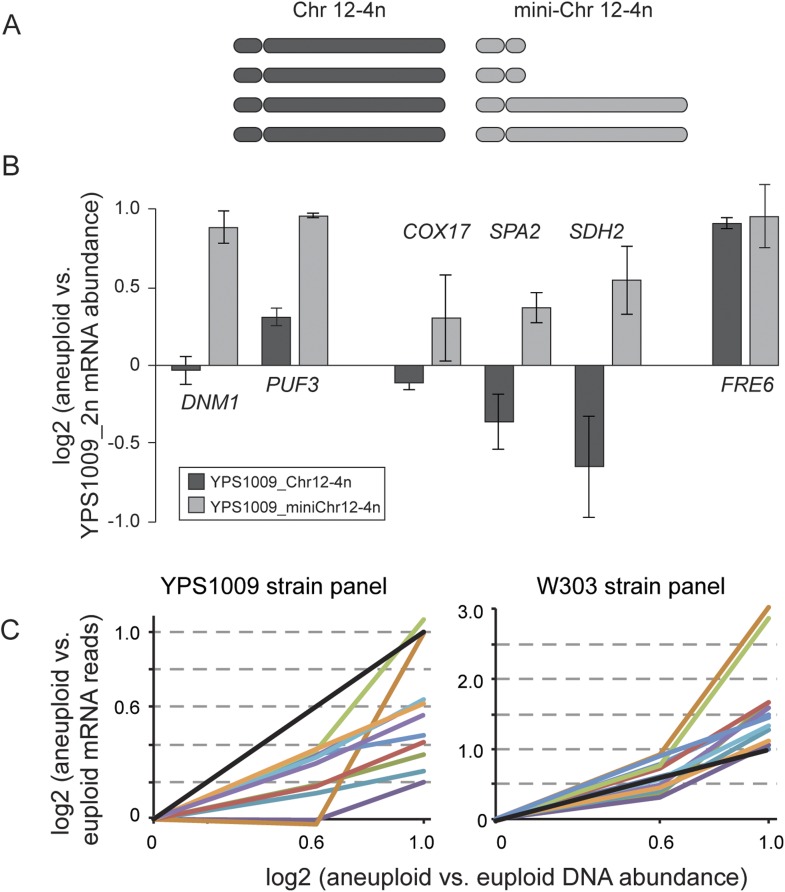
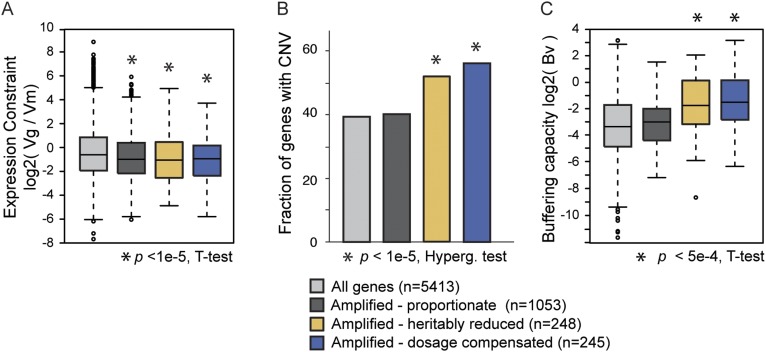
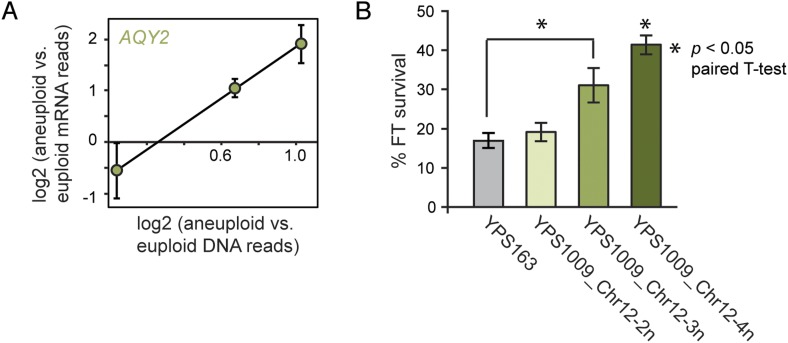
Aneuploidy is linked to myriad diseases but also facilitates organismal evolution. It remains unclear how cells overcome the deleterious effects of aneuploidy until new phenotypes evolve. Although laboratory strains are extremely sensitive to aneuploidy, we show here that aneuploidy is common in wild yeast isolates, which show lower-than-expected expression at many amplified genes. We generated diploid strain panels in which cells carried two, three, or four copies of the affected chromosomes, to show that gene-dosage compensation functions at >30% of amplified genes. Genes subject to dosage compensation are under higher expression constraint in wild populations-but they show elevated rates of gene amplification, suggesting that copy-number variation is buffered at these genes. We find that aneuploidy provides a clear ecological advantage to oak strain YPS1009, by amplifying a causal gene that escapes dosage compensation. Our work presents a model in which dosage compensation buffers gene amplification through aneuploidy to provide a natural, but likely transient, route to rapid phenotypic evolution.

Keywords: S. cerevisiae; aneuploidy; computational biology; copy number variation; evolutionary biology; gene expression; genomics; natural variation; stress resistance; systems biology.


Conflict of interest statement

The authors declare that no competing interests exist.

Figures

Figure 1.
Figure 1.. Aneuploidy is common in non-laboratory strains.
(A) Relative DNA copy (log2 (RPKM)) per gene (rows) across each of the 16 chromosomes for 47 sequenced strains (columns). Strains with 1.5× (gray text) or 2× (blue text) chromosomal copy per haploid genome are annotated by name. (B) Growth rates of aneuploid strains normalized to the niche-specific growth rate (see ‘Materials and methods’) plotted against the additional DNA content in each strain. (C) Haploid strains with a duplication of Chr 8 (labeled as ‘disome’) were selected from euploid parents (labeled as ‘monosome’) including the S288c-derived DBY7286, derived vineyard strain KCY40, and a haploid derivative of oak strain YPS163, see ‘Materials and methods’. Doubling times in YPD medium represent the average of four biological replicates; the average difference (‘dif’) in growth rate is indicated. An asterisk represents statistically significant differences in doubling time (p < 6e-4, T-test). DOI: http://dx.doi.org/10.7554/eLife.05462.003
Figure 2.
Figure 2.. Naturally aneuploid strains show a weak common response to aneuploidy but no activation of the ESR.
A) Expression of genes in the yeast environmental stress response (ESR) in aneuploid vs genetically related euploid strains. Biological replicates are shown for YJM428, Y2189, YPS1009, and NCYC110. The magnitude of the expression difference (log2 fold change) is as indicated in the key. B) Expression of 69 genes with higher expression (top) and 263 genes with lower expression (bottom) in aneuploid strains vs their paired euploid control. DOI: http://dx.doi.org/10.7554/eLife.05462.004
Figure 3.
Figure 3.. Naturally aneuploid strains have no respiratory defect.
The average and standard deviation of doubling times measured for strains growing in yeast extract-peptone medium supplemented with 2% glucose (fermentable), 2% ethanol, 3% glycerol, or 2% acetate (non-fermentable) is shown for indicated strains. Isogenic, diploid panels of YPS1009, NCYC110, and W303 carried variable copy of Chr 12 or Chr 8 (see text). The relative growth rate on non-fermentable carbon sources (normalized to each strain's growth rate on glucose) was not significantly different for most aneuploid strains, with the exception of the W303_Chr12-3n strain that showed a greater growth defect when grown on ethanol or acetate compared to glucose (+ = p < 0.07, * = p < 0.05, paired T-test). The W303_Chr12-4n did not grow on non-fermentable carbon sources. DOI: http://dx.doi.org/10.7554/eLife.05462.005
Figure 4.
Figure 4.. A large fraction of amplified genes are expressed lower than expected in aneuploid isolates.
The average log2(aneuploid vs euploid RNA-seq reads) per amplified gene was plotted against average log2(aneuploid vs euploid DNA seq reads) measured for that gene, in each of the interrogated aneuploid strains. (A) The combined set of amplified genes measured in each wild isolate normalized to a genetically related euploid reference strain, and (B) Amplified genes measured in two tetrasomic diploid strains and one disomic haploid strain normalized to isogenic euploids. Genes with lower-than-expected expression are plotted in blue and genes with higher-than-expected expression are plotted in magenta (see ‘Materials and methods’). The expected relationship representing proportionate increases in expression (slope of 1.0, intercept of 0) is shown in each panel. DOI: http://dx.doi.org/10.7554/eLife.05462.006
Figure 5.
Figure 5.. Aneuploid strain panels.
(A) Strain panels were generated by sporulating YPS1009 (naturally trisomic for Chr 12) or serial passaging of NCYC110 (naturally tetrasomic for Chr 8). (B) Average and standard deviation of doubling times for strains in each panel and euploid reference strains YPS163 or NCYC3290, normalized to the respective 2n strain in each panel. Asterisks represent significant differences (p < 0.01). DOI: http://dx.doi.org/10.7554/eLife.05462.007
Figure 6.
Figure 6.. Classification of dosage-responsive genes.
The log2(aneuploid vs euploid RNA-seq reads) for each gene was plotted against the log2(aneuploid vs euploid DNA-seq reads) measured for that gene in the -2n, -3n, and -4n strains within the strain panel normalized to the closely related euploid reference. (A–E) Average and standard deviation of representative genes in the denoted classes, across three biological replicates. (F) All 173 Class 3a genes, normalized to the euploid strain from within the respective panel for clarity. The expected relationship representing proportionate increases in expression (slope of 1.0, intercept of 0) is shown in each panel. DOI: http://dx.doi.org/10.7554/eLife.05462.008
Figure 7.
Figure 7.. Expression response when genes are duplicated on a plasmid.
To measure the effects of gene duplication in the absence of aneuploidy, representative Class 3a genes were cloned onto a CEN plasmid and introduced into otherwise euploid strains. As a control, strains were also compared to an empty vector for normalization. mRNA and DNA abundance for the gene were quantified by qPCR as described in ‘Materials and methods’. Relative DNA (black) and RNA (gray) abundance for (A) RPL15A, (B) RPL22A, (C) COX8, or (D) MEF1 when introduced in extra copy into each strain. Panels A, C, D show abundance in haploid W303 or the haploid, monosomic (euploid) derivative of YPS1009 (‘YPS1009_m’), and panel B shows abundance in diploid laboratory strain BY4743 and diploid, euploid derivative YPS1009_Chr12-2n. In all cases, the average and standard deviation of biological triplicates is shown. DOI: http://dx.doi.org/10.7554/eLife.05462.010
Figure 8.
Figure 8.. Relative mRNA abundance of amplified genes in the mini-4n strain and strain panels.
(A) Cartoon diagram of the four copies of Chr 12 in the tetraploid YPS1009_Chr12-4n strain and in the ‘mini_4n’ strain where two copies of the Chr 12-right arm are deleted (see ‘Materials and methods’ for details). (B) Expression was measured on tiled yeast-genome DNA microarrays. Shown are Class 3a genes that remain amplified in the mini-4n strain and could be quantified by arrays. Relative mRNA abundance was measured in biological triplicate in the YPS1009_Chr12-4n or YPS1009_mini-Chr12-4n strain vs the euploid YPS1009_Chr12-2n strain. Genes COX17, SPA2, and SDH2 showed an increase in expression in the mini_4n strain, however expression remained significantly lower than the expected two-fold difference proportionate to the gene amplification. FRE6 showed little dosage compensation when measured by DNA microarray analysis and correspondingly its expression did not change in the mini_4n strain. (C) Relative mRNA abundance of eleven genes that are dosage compensated across the YPS1009_Chr12 strain panel (left) but not the W303_Chr12 strain panel (right). DOI: http://dx.doi.org/10.7554/eLife.05462.011
Figure 9.
Figure 9.. Natural variation in expression constraint and gene copy-number variation.
(A) log2(Vg/Vm) as described in the text, (B) fraction of genes with copy-number variation (CNV) in at least one of 103 strains, and (C) log2 of the buffering capacity score, Bv, are shown for the gene groups in the key (where number of genes is indicated in parentheses). Amplified genes with proportionately higher expression include Class 1 genes and genes with proportionate expression in strain pairs (Figure 4A, gray points). Amplified genes with heritably reduced expression correspond to genes in Class 2a, minus genes identified as dosage compensated in other strains, while amplified genes subject to dosage compensation represent genes in Class 3a plus genes with lower-than-expected expression as identified in Figure 4B. Statistical significance was scored by comparing each group to the total set of yeast genes. DOI: http://dx.doi.org/10.7554/eLife.05462.012
Figure 10.
Figure 10.. Amplified expression of AQY2 provides a fitness advantage.
(A) AQY2 expression as described in Figure 6. (B) Average and standard deviation of percent cell viability after freeze-thaw stress. DOI: http://dx.doi.org/10.7554/eLife.05462.013
Appendix 1 Figure 1.
Appendix 1 Figure 1.. Relative DNA and RNA values follow a linear regression.
DOI: http://dx.doi.org/10.7554/eLife.05462.017

Comment in

  • Aneuploidy: Tolerating Tolerance.
    Cromie GA, Dudley AM. Cromie GA, et al. Curr Biol. 2015 Aug 31;25(17):R771-3. doi: 10.1016/j.cub.2015.06.056. Curr Biol. 2015. PMID: 26325142

References

    1. Anders S, Pyl PT, Huber W. HTSeq—a Python framework to work with high-throughput sequencing data. Bioinformatics. 2014;31:166–169. doi: 10.1093/bioinformatics/btu638. - DOI - PMC - PubMed
    1. Antonarakis SE, Lyle R, Dermitzakis ET, Reymond A, Deutsch S. Chromosome 21 and Down syndrome: from genomics to pathophysiology. Nature Reviews. 2004;5:725–738. doi: 10.1038/nrg1448. - DOI - PubMed
    1. Benjamini Y, Hochberg Y. Controllign the false discovery rate: a practical and powerful approach to multiple testing. Journal of the Royal Statistical Society. 1995;57:289–300.
    1. Birchler JA, Veitia RA. The gene balance hypothesis: from classical genetics to modern genomics. The Plant Cell. 2007;19:395–402. doi: 10.1105/tpc.106.049338. - DOI - PMC - PubMed
    1. Bolger AM, Lohse M, Usadel B. Trimmomatic: a flexible trimmer for illumina sequence data. Bioinformatics. 2014;30:2114–2120. doi: 10.1093/bioinformatics/btu170. - DOI - PMC - PubMed

Publication types