

Biased Exposure-Health Effect Estimates from Selection in Cohort Studies: Are Environmental Studies at Particular Risk?
- PMID: 25956004
- PMCID: PMC4629739
- DOI: 10.1289/ehp.1408888
Biased Exposure-Health Effect Estimates from Selection in Cohort Studies: Are Environmental Studies at Particular Risk?
Abstract
Background: The process of creating a cohort or cohort substudy may induce misleading exposure-health effect associations through collider stratification bias (i.e., selection bias) or bias due to conditioning on an intermediate. Studies of environmental risk factors may be at particular risk.
Objectives: We aimed to demonstrate how such biases of the exposure-health effect association arise and how one may mitigate them.
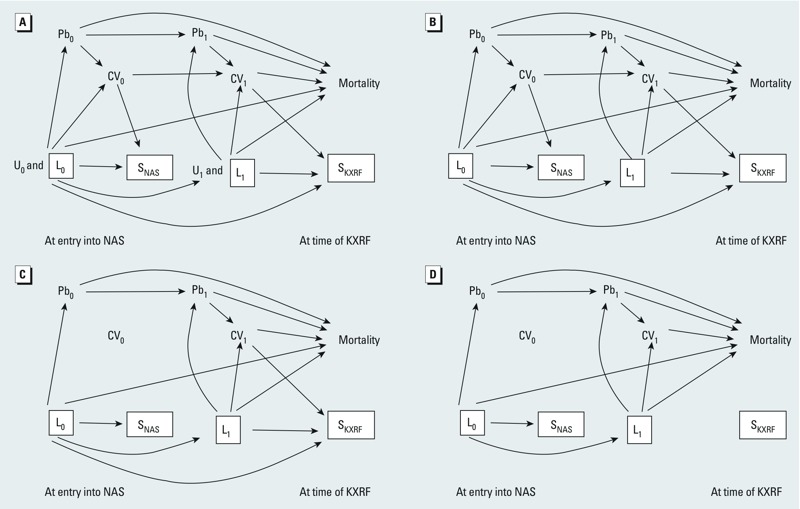
Methods: We used directed acyclic graphs and the example of bone lead and mortality (all-cause, cardiovascular, and ischemic heart disease) among 835 white men in the Normative Aging Study (NAS) to illustrate potential bias related to recruitment into the NAS and the bone lead substudy. We then applied methods (adjustment, restriction, and inverse probability of attrition weighting) to mitigate these biases in analyses using Cox proportional hazards models to estimate adjusted hazard ratios (HRs) and 95% confidence intervals (CIs).
Results: Analyses adjusted for age at bone lead measurement, smoking, and education among all men found HRs (95% CI) for the highest versus lowest tertile of patella lead of 1.34 (0.90, 2.00), 1.46 (0.86, 2.48), and 2.01 (0.86, 4.68) for all-cause, cardiovascular, and ischemic heart disease mortality, respectively. After applying methods to mitigate the biases, the HR (95% CI) among the 637 men analyzed were 1.86 (1.12, 3.09), 2.47 (1.23, 4.96), and 5.20 (1.61, 16.8), respectively.
Conclusions: Careful attention to the underlying structure of the observed data is critical to identifying potential biases and methods to mitigate them. Understanding factors that influence initial study participation and study loss to follow-up is critical. Recruitment of population-based samples and enrolling participants at a younger age, before the potential onset of exposure-related health effects, can help reduce these potential pitfalls.
Citation: Weisskopf MG, Sparrow D, Hu H, Power MC. 2015. Biased exposure-health effect estimates from selection in cohort studies: are environmental studies at particular risk? Environ Health Perspect 123:1113-1122; http://dx.doi.org/10.1289/ehp.1408888.
Conflict of interest statement
The authors declare they have no actual or potential competing financial interests.
Figures


Comment in
-
Bias in Environmental Cohort Studies: The Example of Bone Lead and Mortality.Environ Health Perspect. 2015 Nov;123(11):A288. doi: 10.1289/ehp.123-A288. Environ Health Perspect. 2015. PMID: 26524143 Free PMC article. No abstract available.
Similar articles
-
Effects of long-term exposure to traffic-related air pollution on respiratory and cardiovascular mortality in the Netherlands: the NLCS-AIR study.Res Rep Health Eff Inst. 2009 Mar;(139):5-71; discussion 73-89. Res Rep Health Eff Inst. 2009. PMID: 19554969
-
A prospective study of bone lead concentration and death from all causes, cardiovascular diseases, and cancer in the Department of Veterans Affairs Normative Aging Study.Circulation. 2009 Sep 22;120(12):1056-64. doi: 10.1161/CIRCULATIONAHA.108.827121. Epub 2009 Sep 8. Circulation. 2009. PMID: 19738141 Free PMC article.
-
Ambient Particulate Matter Air Pollution Exposure and Mortality in the NIH-AARP Diet and Health Cohort.Environ Health Perspect. 2016 Apr;124(4):484-90. doi: 10.1289/ehp.1509676. Epub 2015 Sep 15. Environ Health Perspect. 2016. PMID: 26370657 Free PMC article.
-
The relationship of vitamin D status to risk of cardiovascular disease and mortality.Dan Med J. 2015 Feb;62(2):B5008. Dan Med J. 2015. PMID: 25634511 Review.
-
How to investigate and adjust for selection bias in cohort studies.Acta Obstet Gynecol Scand. 2018 Apr;97(4):407-416. doi: 10.1111/aogs.13319. Epub 2018 Mar 5. Acta Obstet Gynecol Scand. 2018. PMID: 29415329 Review.
Cited by
-
Maternal occupational exposure to chemicals and child cognitive function.Pediatr Res. 2022 Oct;92(4):1153-1160. doi: 10.1038/s41390-022-02089-6. Epub 2022 May 16. Pediatr Res. 2022. PMID: 35578010 Free PMC article.
-
Bias in Environmental Cohort Studies: The Example of Bone Lead and Mortality.Environ Health Perspect. 2015 Nov;123(11):A288. doi: 10.1289/ehp.123-A288. Environ Health Perspect. 2015. PMID: 26524143 Free PMC article. No abstract available.
-
Longitudinal Analysis of Long-Term Air Pollution Levels and Blood Pressure: A Cautionary Tale from the Multi-Ethnic Study of Atherosclerosis.Environ Health Perspect. 2018 Oct;126(10):107003. doi: 10.1289/EHP2966. Environ Health Perspect. 2018. PMID: 30392401 Free PMC article.
-
Bone Lead Levels and Risk of Incident Primary Open-Angle Glaucoma: The VA Normative Aging Study.Environ Health Perspect. 2018 Aug 8;126(8):087002. doi: 10.1289/EHP3442. eCollection 2018 Aug. Environ Health Perspect. 2018. PMID: 30102601 Free PMC article.
-
Anemia risk in relation to lead exposure in lead-related manufacturing.BMC Public Health. 2017 May 5;17(1):389. doi: 10.1186/s12889-017-4315-7. BMC Public Health. 2017. PMID: 28476140 Free PMC article.
References
-
- Alonso A, Mosley TH, Jr, Gottesman RF, Catellier D, Sharrett AR, Coresh J. Risk of dementia hospitalisation associated with cardiovascular risk factors in midlife and older age: the Atherosclerosis Risk in Communities (ARIC) study. J Neurol Neurosurg Psychiatry. 2009;80(11):1194–1201. - PMC - PubMed
-
- Andersen PK, Keiding N. Interpretability and importance of functionals in competing risks and multistate models. Stat Med. 2012;31(11–12):1074–1088. - PubMed
-
- Bell B, Rose CL, Damon A. The Normative Aging Study: an interdisciplinary and longitudinal study of health and aging. Int J Aging Hum Dev. 1972;3(1):5–17.
-
- Chaix B, Evans D, Merlo J, Suzuki E. Commentary: Weighing up the dead and missing: reflections on inverse-probability weighting and principal stratification to address truncation by death. Epidemiology. 2012;23(1):129–131. - PubMed
Publication types
MeSH terms
Substances
Grants and funding
LinkOut - more resources
Full Text Sources
Other Literature Sources
