

Urine podocyte mRNAs mark disease activity in IgA nephropathy
- PMID: 25956757
- PMCID: PMC4479668
- DOI: 10.1093/ndt/gfv104
Urine podocyte mRNAs mark disease activity in IgA nephropathy
Abstract
Background: Podocyte depletion is a major mechanism driving glomerulosclerosis. We and others have previously projected from model systems that podocyte-specific mRNAs in the urine pellet might serve as glomerular disease markers. We evaluated IgA nephropathy (IgAN) to test this concept.
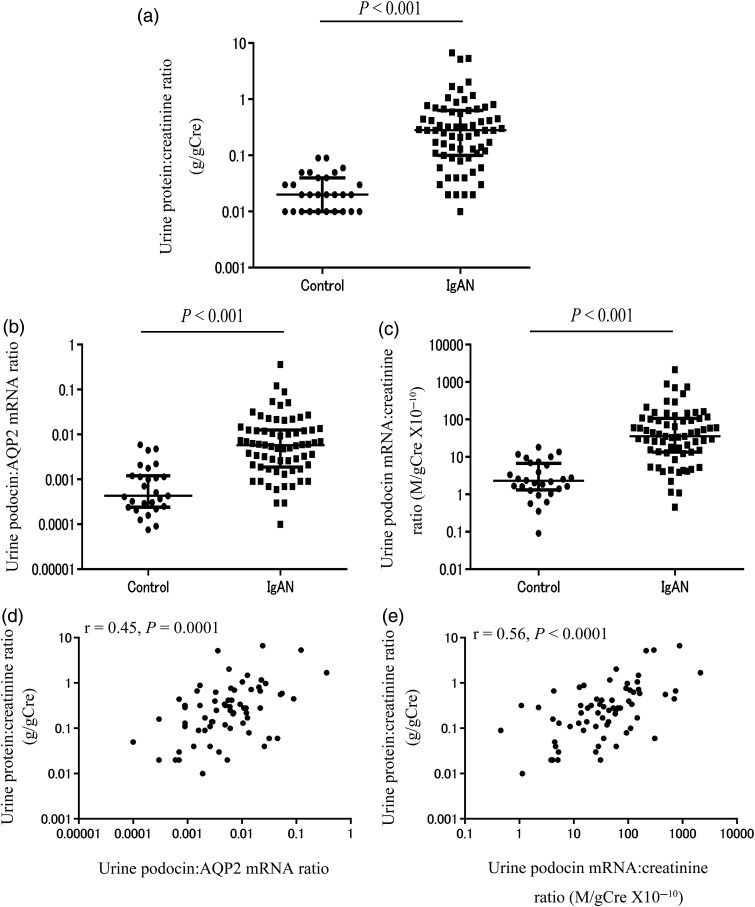
Methods: From 2009 to 2013, early morning voided urine samples and kidney biopsies from IgAN patients (n = 67) were evaluated in comparison with urine samples from healthy age-matched volunteers (n = 28). Urine podocyte (podocin) mRNA expressed in relation to either urine creatinine concentration or a kidney tubular marker (aquaporin 2) was tested as markers.
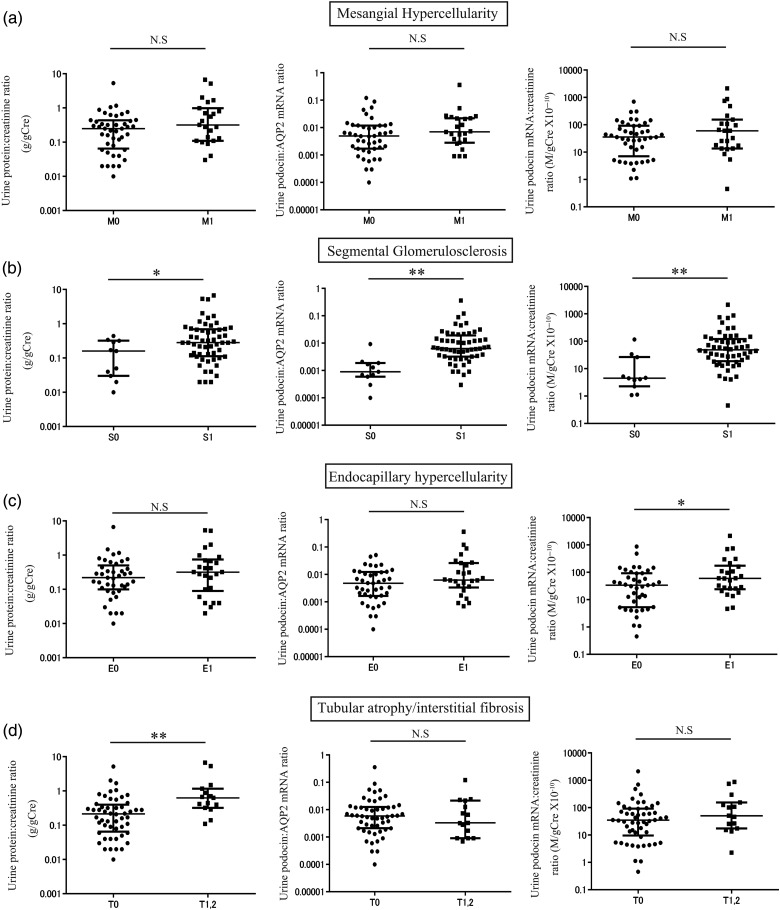
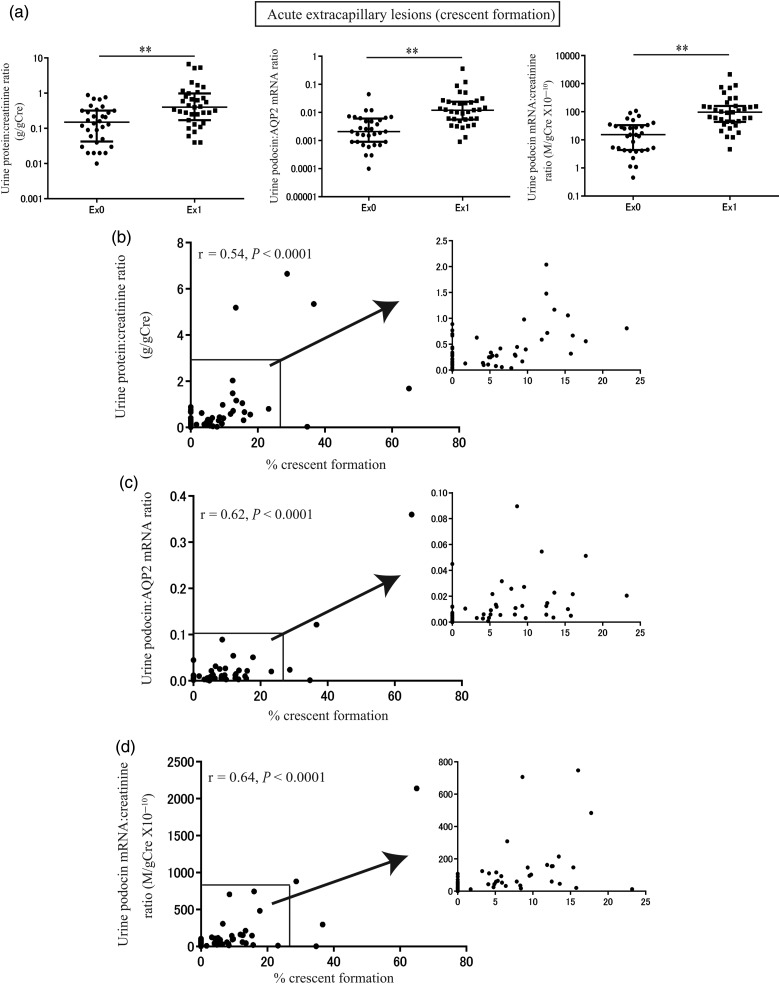
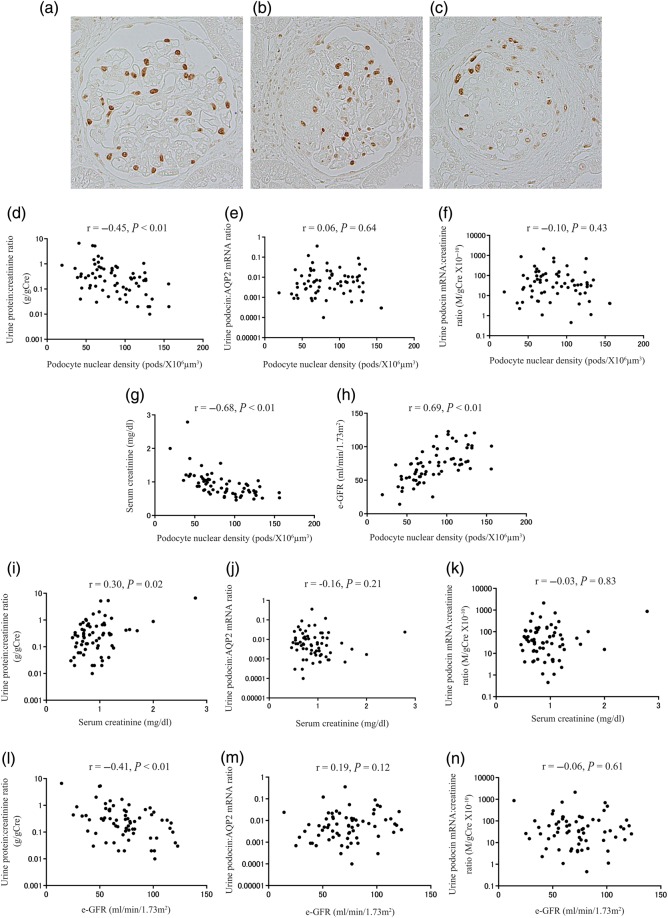
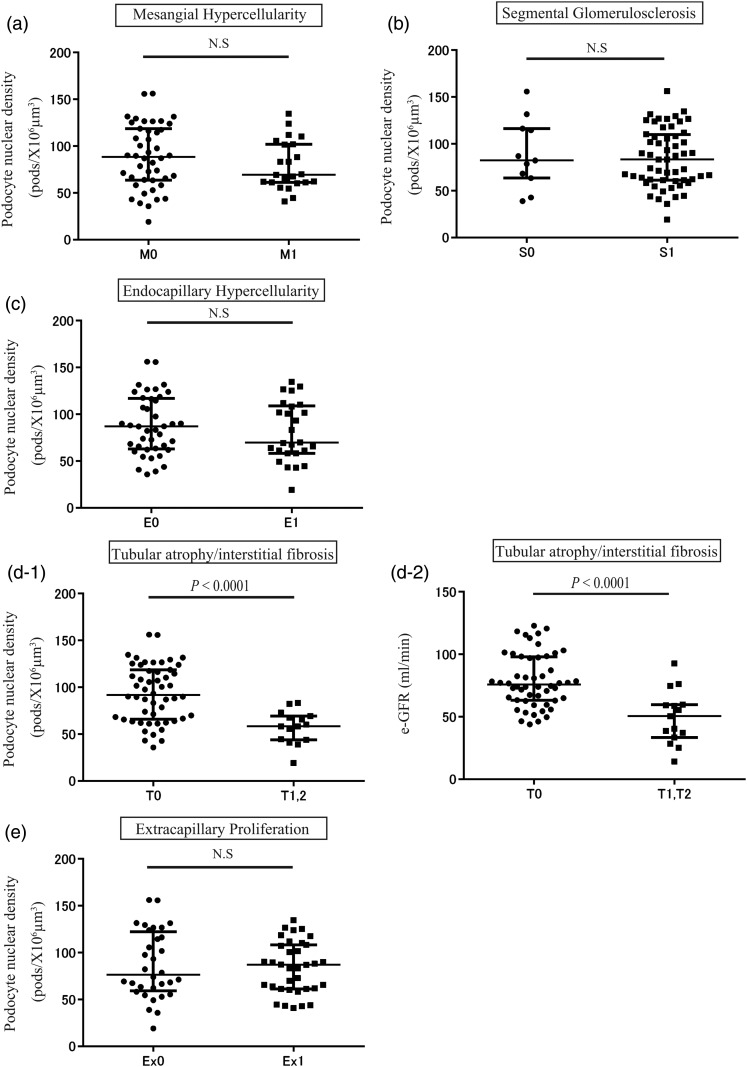
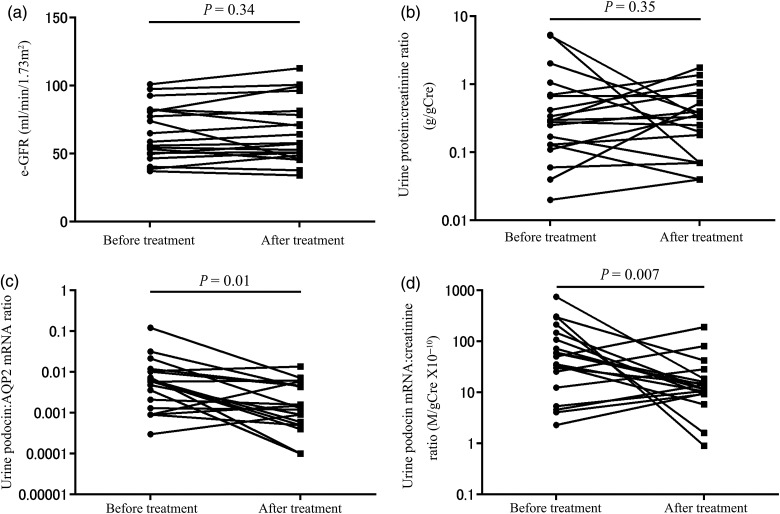
Results: Urine podocyte mRNAs were correlated with the severity of active glomerular lesions (segmental glomerulosclerosis and acute extracapillary proliferation), but not with non-glomerular lesions (tubular atrophy/interstitial fibrosis) or with clinical parameters of kidney injury (serum creatinine and estimated glomerular filtration rate), or with degree of accumulated podocyte loss at the time of biopsy. In contrast, proteinuria correlated with all histological and clinical markers. Glomerular tuft podocyte nuclear density (a measure of cumulative podocyte loss) correlated with tubular atrophy/interstitial fibrosis, estimated-glomerular filtration rate and proteinuria, but not with urine podocyte markers. In a subset of the IgA cohort (n = 19, median follow-up period = 37 months), urine podocyte mRNAs were significantly decreased after treatment, in contrast to proteinuria which was not significantly changed.
Conclusions: Urine podocyte mRNAs reflect active glomerular injury at a given point in time, and therefore provide both different and additional clinical information that can complement proteinuria in the IgAN decision-making paradigm.
Keywords: IgA nephropathy; glomerular disease; podocyte; proteinuria; urine podocyte mRNA.
© The Author 2015. Published by Oxford University Press on behalf of ERA-EDTA. All rights reserved.
Figures
Similar articles
-
Urine podocin:nephrin mRNA ratio (PNR) as a podocyte stress biomarker.Nephrol Dial Transplant. 2012 Nov;27(11):4079-87. doi: 10.1093/ndt/gfs313. Epub 2012 Aug 3. Nephrol Dial Transplant. 2012. PMID: 22863839 Free PMC article.
-
Translocation of dendrin to the podocyte nucleus in acute glomerular injury in patients with IgA nephropathy.Nephrol Dial Transplant. 2013 Jul;28(7):1762-72. doi: 10.1093/ndt/gfs500. Epub 2012 Nov 9. Nephrol Dial Transplant. 2013. PMID: 23143340
-
Urine podocyte mRNAs mark progression of renal disease.J Am Soc Nephrol. 2009 May;20(5):1041-52. doi: 10.1681/ASN.2007121328. Epub 2009 Apr 23. J Am Soc Nephrol. 2009. PMID: 19389856 Free PMC article.
-
Oxford Classification of IgA nephropathy 2016: an update from the IgA Nephropathy Classification Working Group.Kidney Int. 2017 May;91(5):1014-1021. doi: 10.1016/j.kint.2017.02.003. Epub 2017 Mar 22. Kidney Int. 2017. PMID: 28341274 Review.
-
Urine markers of podocyte dysfunction: a review of podocalyxin and nephrin in selected glomerular diseases.Biomark Med. 2018 Aug;12(8):927-935. doi: 10.2217/bmm-2018-0152. Epub 2018 Jul 6. Biomark Med. 2018. PMID: 29976076 Review.
Cited by
-
Preservation of Urinary Podocyte Markers in Diabetic Kidney Disease by Sodium-Glucose Cotransporter 2 Inhibitor Therapy.Kidney Dis (Basel). 2025 Mar 15;11(1):218-225. doi: 10.1159/000545225. eCollection 2025 Jan-Dec. Kidney Dis (Basel). 2025. PMID: 40297470 Free PMC article.
-
Podocyte hypertrophic stress and detachment precedes hyperglycemia or albuminuria in a rat model of obesity and type2 diabetes-associated nephropathy.Sci Rep. 2019 Dec 6;9(1):18485. doi: 10.1038/s41598-019-54692-z. Sci Rep. 2019. PMID: 31811176 Free PMC article.
-
The pathogenesis of IgA nephropathy and implications for treatment.Nat Rev Nephrol. 2025 Jan;21(1):9-23. doi: 10.1038/s41581-024-00885-3. Epub 2024 Sep 4. Nat Rev Nephrol. 2025. PMID: 39232245 Free PMC article. Review.
-
The Study of Angptl4-Modulated Podocyte Injury in IgA Nephropathy.Front Physiol. 2021 Feb 11;11:575722. doi: 10.3389/fphys.2020.575722. eCollection 2020. Front Physiol. 2021. PMID: 33643055 Free PMC article.
-
Rationale and Design of a Phase 2, Double-blind, Placebo-Controlled, Randomized Trial Evaluating AMP Kinase-Activation by Metformin in Focal Segmental Glomerulosclerosis.Kidney Int Rep. 2024 Feb 13;9(5):1354-1368. doi: 10.1016/j.ekir.2024.02.006. eCollection 2024 May. Kidney Int Rep. 2024. PMID: 38707807 Free PMC article.
References
-
- Donadio JV, Grande JP. IgA nephropathy. N Engl J Med 2002; 347: 738–748 - PubMed
-
- Barratt J, Feehally J. IgA nephropathy. J Am Soc Nephrol 2005; 16: 2088–2097 - PubMed
-
- Wyatt RJ, Julian BA. IgA nephropathy. N Engl J Med 2013; 368: 2402–2414 - PubMed
-
- Reich HN, Troyanov S, Scholey JW, et al. Toronto glomerulonephritis registry: remission of proteinuria improves prognosis in IgA nephropathy. J Am Soc Nephrol 2007; 18: 3177–3183 - PubMed
Publication types
MeSH terms
Substances
Grants and funding
LinkOut - more resources
Full Text Sources
Other Literature Sources
Miscellaneous
