

Sequence- vs. chip-assisted genomic selection: accurate biological information is advised
- PMID: 25956961
- PMCID: PMC4424891
- DOI: 10.1186/s12711-015-0117-5
Sequence- vs. chip-assisted genomic selection: accurate biological information is advised
Abstract
Background: The development of next-generation sequencing technologies (NGS) has made the use of whole-genome sequence data for routine genetic evaluations possible, which has triggered a considerable interest in animal and plant breeding fields. Here, we investigated whether complete or partial sequence data can improve upon existing SNP (single nucleotide polymorphism) array-based selection strategies by simulation using a mixed coalescence - gene-dropping approach.
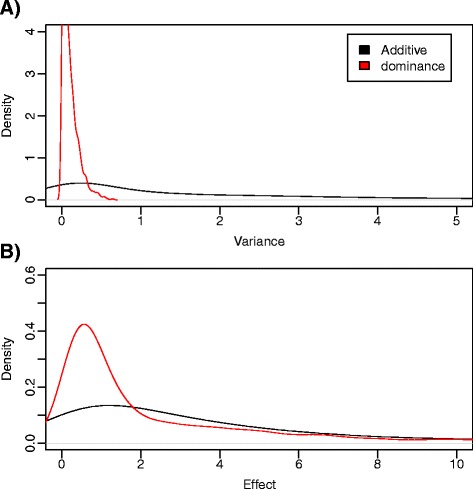
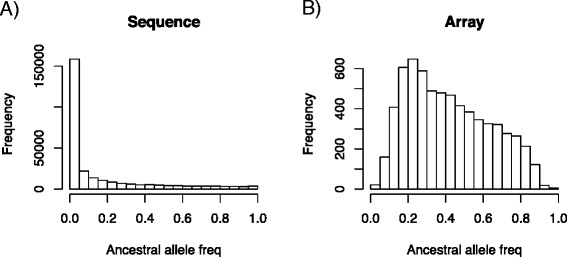
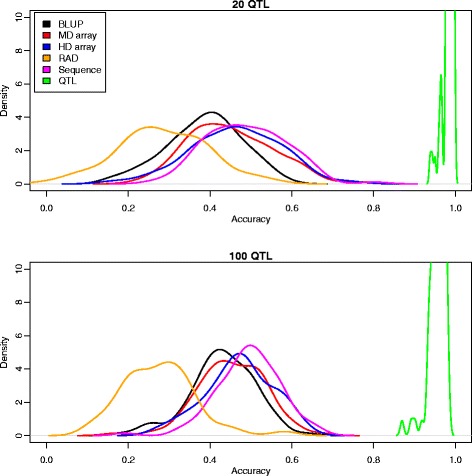
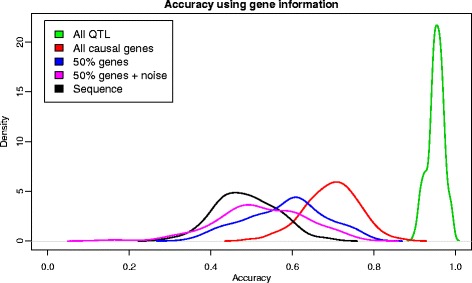
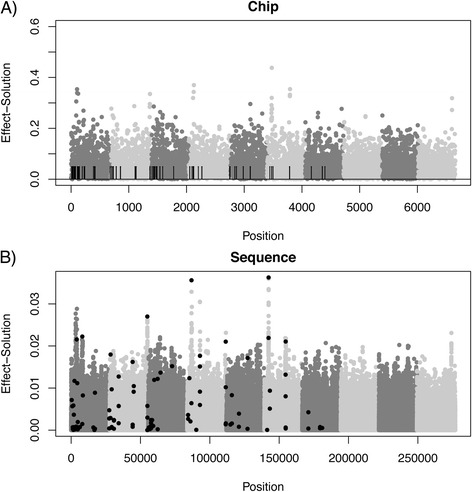
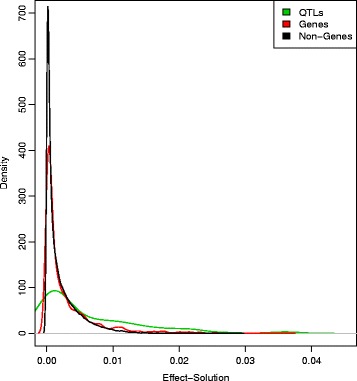
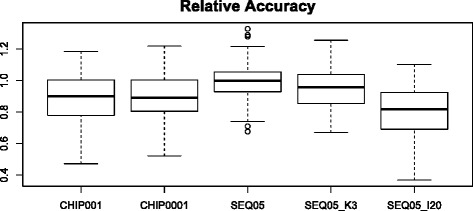
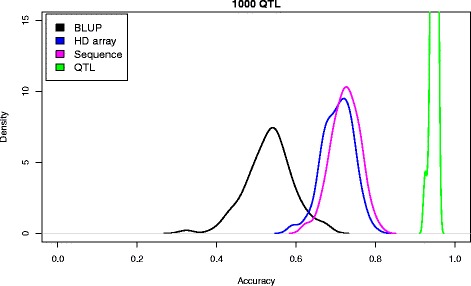
Results: We simulated 20 or 100 causal mutations (quantitative trait nucleotides, QTN) within 65 predefined 'gene' regions, each 10 kb long, within a genome composed of ten 3-Mb chromosomes. We compared prediction accuracy by cross-validation using a medium-density chip (7.5 k SNPs), a high-density (HD, 17 k) and sequence data (335 k). Genetic evaluation was based on a GBLUP method. The simulations showed: (1) a law of diminishing returns with increasing number of SNPs; (2) a modest effect of SNP ascertainment bias in arrays; (3) a small advantage of using whole-genome sequence data vs. HD arrays i.e. ~4%; (4) a minor effect of NGS errors except when imputation error rates are high (≥20%); and (5) if QTN were known, prediction accuracy approached 1. Since this is obviously unrealistic, we explored milder assumptions. We showed that, if all SNPs within causal genes were included in the prediction model, accuracy could also dramatically increase by ~40%. However, this criterion was highly sensitive to either misspecification (including wrong genes) or to the use of an incomplete gene list; in these cases, accuracy fell rapidly towards that reached when all SNPs from sequence data were blindly included in the model.
Conclusions: Our study shows that, unless an accurate prior estimate on the functionality of SNPs can be included in the predictor, there is a law of diminishing returns with increasing SNP density. As a result, use of whole-genome sequence data may not result in a highly increased selection response over high-density genotyping.
Figures
Similar articles
-
Genomic prediction using imputed whole-genome sequence data in Holstein Friesian cattle.Genet Sel Evol. 2015 Sep 17;47(1):71. doi: 10.1186/s12711-015-0149-x. Genet Sel Evol. 2015. PMID: 26381777 Free PMC article.
-
Genomic relationships computed from either next-generation sequence or array SNP data.J Anim Breed Genet. 2014 Apr;131(2):85-96. doi: 10.1111/jbg.12074. Epub 2014 Jan 8. J Anim Breed Genet. 2014. PMID: 24397314
-
Whole-genome sequence-based genomic prediction in laying chickens with different genomic relationship matrices to account for genetic architecture.Genet Sel Evol. 2017 Jan 16;49(1):8. doi: 10.1186/s12711-016-0277-y. Genet Sel Evol. 2017. PMID: 28093063 Free PMC article.
-
Role of NGS and SNP genotyping methods in sugarcane improvement programs.Crit Rev Biotechnol. 2020 Sep;40(6):865-880. doi: 10.1080/07388551.2020.1765730. Epub 2020 Jun 7. Crit Rev Biotechnol. 2020. PMID: 32508157 Review.
-
Efficient SNP Discovery by Combining Microarray and Lab-on-a-Chip Data for Animal Breeding and Selection.Microarrays (Basel). 2015 Nov 16;4(4):570-95. doi: 10.3390/microarrays4040570. Microarrays (Basel). 2015. PMID: 27600241 Free PMC article. Review.
Cited by
-
Evaluation of deep learning for predicting rice traits using structural and single-nucleotide genomic variants.Plant Methods. 2024 Aug 10;20(1):121. doi: 10.1186/s13007-024-01250-y. Plant Methods. 2024. PMID: 39127715 Free PMC article.
-
Quantitative Genetics and Genomics Converge to Accelerate Forest Tree Breeding.Front Plant Sci. 2018 Nov 22;9:1693. doi: 10.3389/fpls.2018.01693. eCollection 2018. Front Plant Sci. 2018. PMID: 30524463 Free PMC article. Review.
-
How array design creates SNP ascertainment bias.PLoS One. 2021 Mar 30;16(3):e0245178. doi: 10.1371/journal.pone.0245178. eCollection 2021. PLoS One. 2021. PMID: 33784304 Free PMC article.
-
A survey of functional genomic variation in domesticated chickens.Genet Sel Evol. 2018 Apr 16;50(1):17. doi: 10.1186/s12711-018-0390-1. Genet Sel Evol. 2018. PMID: 29661130 Free PMC article.
-
pCADD: SNV prioritisation in Sus scrofa.Genet Sel Evol. 2020 Feb 7;52(1):4. doi: 10.1186/s12711-020-0528-9. Genet Sel Evol. 2020. PMID: 32033531 Free PMC article.
References
Publication types
MeSH terms
LinkOut - more resources
Full Text Sources
Other Literature Sources
Research Materials
Miscellaneous
