. 2015 May 9;6(1):89.
doi: 10.1186/s13287-015-0043-z.

Comparative analysis of mesenchymal stem cell and embryonic tendon progenitor cell response to embryonic tendon biochemical and mechanical factors

Affiliations

Comparative analysis of mesenchymal stem cell and embryonic tendon progenitor cell response to embryonic tendon biochemical and mechanical factors

Jeffrey P Brown et al. Stem Cell Res Ther. .

Abstract

Introduction: Advances in tendon engineering with mesenchymal stem cells (MSCs) are hindered by a need for cues to direct tenogenesis, and markers to assess tenogenic state. We examined the effects of factors involved in embryonic tendon development on adult MSCs, and compared MSC responses to that of embryonic tendon progenitor cells (TPCs), a model system of tenogenically differentiating cells.

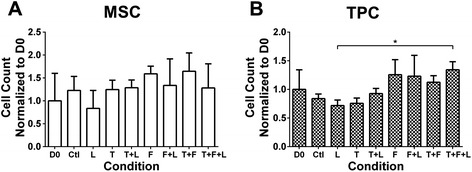
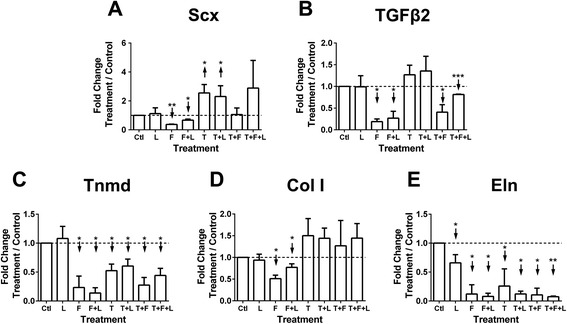
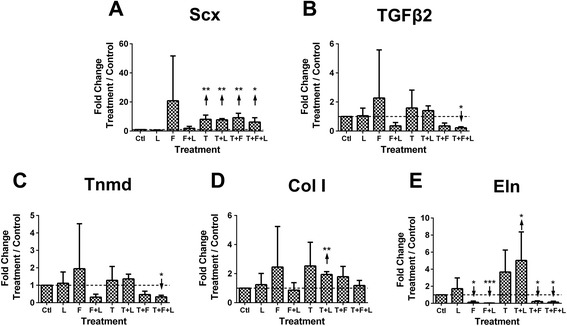
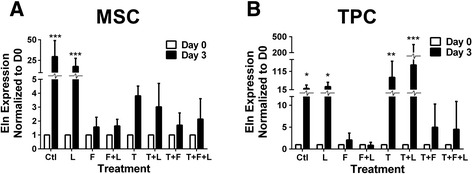
Methods: Murine MSCs and TPCs subjected to cyclic tensile loading, transforming growth factor-β2 (TGFβ2), and fibroblast growth factor-4 (FGF4) in vitro were assessed for proliferation and mRNA levels of scleraxis, TGFβ2, tenomodulin, collagen type I and elastin.

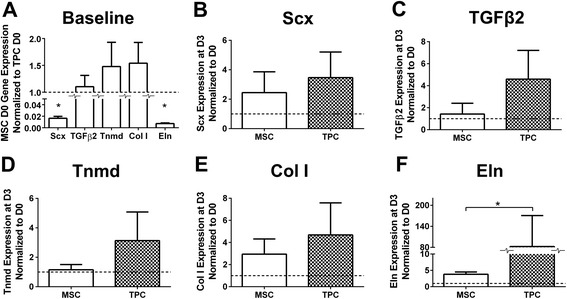
Results: Before treatment, scleraxis and elastin levels in MSCs were lower than in TPCs, while other tendon markers expressed at similar levels in MSCs as TPCs. TGFβ2 alone and combined with loading were tenogenic based on increased scleraxis levels in both MSCs and TPCs. Loading alone had minimal effect. FGF4 downregulated tendon marker levels in MSCs but not in TPCs. Select tendon markers were not consistently upregulated with scleraxis, demonstrating the importance of characterizing a profile of markers.

Conclusions: Similar responses as TPCs to specific treatments suggest MSCs have tenogenic potential. Potentially shared mechanisms of cell function between MSCs and TPCs should be investigated in longer term studies.


Figures

Figure 1
Figure 1
Mesenchymal stem cell (MSC) and tendon progenitor cell (TPC) proliferation as a function of growth factor treatments and loading. Effects on MSC and TPC proliferation on day (D)3 (normalized to D0) of treatment with combinations of mechanical loading (L), transforming growth factor (TGF)β2 (T), and fibroblast growth factor-(FGF)4 (F) treatment. Left column shows D0 data. (A) MSC proliferation was not significantly affected by any treatment. (B) TPC proliferation was not significantly affected by any treatment, but there was a significant difference between loading and TGFβ2 + FGF4 + loading groups on D3. *P < 0.05.
Figure 2
Figure 2
Mesenchymal stem cell (MSC) tendon marker gene expression as a function of growth factor treatments and loading. MSC gene expression on day (D)3 of treatment with combinations of mechanical loading (L), transforming growth factor (TGF)β2 (T), and fibroblast growth factor-(FGF)4 (F). Dashed horizontal line = 1 indicates control condition. (A) Scleraxis (Scx) was significantly downregulated by FGF4 and FGF4 + loading, and upregulated by TGFβ2 and TGFβ2 + loading. (B) TGFβ2 was significantly downregulated by all treatments involving FGF4. (C) All treatments except loading significantly downregulated tenomodulin (Tnmd). (D) Collagen type I (Col I) was significantly downregulated by FGF4 and FGF4 + loading, while all treatments involving TGFβ2 caused Col I to trend up (P ≥ 0.06). (E) Elastin (Eln) was significantly downregulated by all treatments. ↑ or ↓ indicates statistically significant up- or downregulation, respectively; *P < 0.05, **P < 0.01, ***P < 0.001.
Figure 3
Figure 3
Tendon progenitor cell (TPC) tendon marker gene expression as a function of growth factor treatments and loading. TPC gene expression on day (D)3 of treatment with combinations of mechanical loading (L), transforming growth factor (TGF)β2 (T), and fibroblast growth factor-(FGF)4 (F). Dashed horizontal line = 1 indicates control condition. (A) Scleraxis (Scx) was significantly upregulated by all treatments involving TGFβ2. (B) TGFβ2 and (C) tenomodulin (Tnmd) were significantly downregulated by TGFβ2 + FGF4 + loading. (D) Collagen type I (Col I) was significantly upregulated by TGFβ2 + loading. (E) Elastin (Eln) was significantly downregulated by all treatments that involve FGF4, but was significantly upregulated by TGFβ2 + loading. ↑ or ↓ indicates statistically significant up- or downregulation, respectively; *P < 0.05, **P < 0.01, ***P < 0.001.
Figure 4
Figure 4
Elastin (Eln) gene expression as a function of growth factor treatments and loading. Eln gene expression in mesenchymal stem cells (MSCs) and tendon progenitor cells (TPCs) on day (D)3 of treatment with combinations of mechanical loading (L), transforming growth factor (TGF)β2 (T), and fibroblast growth factor-4 (F), and normalized to D0. (A) MSCs significantly increased Eln with time in control culture and with loading. (B) TPCs significantly increased Eln with time in control culture and treatment with loading, TGFβ2, and TGFβ2 + loading. ↑ or ↓ indicates statistically significant up- or downregulation, respectively; *P < 0.05, **P < 0.01, ***P < 0.001.
Figure 5
Figure 5
Comparison of mesenchymal stem cell (MSC) and tendon progenitor cell (TPC) tendon marker gene expression at baseline and with transforming growth factor (TGF)β2 treatment. Comparison of MSC and TPC gene expression at day (D)0 and D3 of TGFβ2 treatment. (A) Comparison of tenogenic gene expression by MSCs versus TPCs at D0; scleraxis (Scx) and elastin (Eln) were significantly lower in MSCs compared to TPCs. At D3 (normalized to D0) of TGFβ2 treatment, (B) Scx, (C) TGFβ2, (D) tenomodulin (Tnmd), and (E) collagen type I (Col I) were not significantly different between MSCs and TPCs, while (F) Eln was significantly higher in TPCs than MSCs. *P < 0.05.

References

    1. Butler DL, Juncosa N, Dressler MR. Functional efficacy of tendon repair processes. Annu Rev Biomed Eng. 2004;6:303–29. doi: 10.1146/annurev.bioeng.6.040803.140240. - DOI - PubMed
    1. Chen J, Xu J, Wang A, Zheng M. Scaffolds for tendon and ligament repair: review of the efficacy of commercial products. Expert Rev Med Devices. 2009;6:61–73. doi: 10.1586/17434440.6.1.61. - DOI - PubMed
    1. Yang G, Rothrauff BB, Tuan RS. Tendon and ligament regeneration and repair: clinical relevance and developmental paradigm. Birth Defects Res C Embryo Today. 2013;99:203–22. - PMC - PubMed
    1. Nirmalanandhan VS, Juncosa-Melvin N, Shearn JT, Boivin GP, Galloway MT, Gooch C, et al. Combined effects of scaffold stiffening and mechanical preconditioning cycles on construct biomechanics, gene expression, and tendon repair biomechanics. Tissue Eng Part A. 2009;15:2103–11. doi: 10.1089/ten.tea.2008.0335. - DOI - PMC - PubMed
    1. Teh TK, Toh SL, Goh JC. Aligned fibrous scaffolds for enhanced mechanoresponse and tenogenesis of mesenchymal stem cells. Tissue Eng Part A. 2013;19:1360–72. doi: 10.1089/ten.tea.2012.0279. - DOI - PubMed

Publication types

MeSH terms