. 2015 Jul;36(7):738-49.
doi: 10.1016/j.placenta.2015.04.007. Epub 2015 Apr 28.

Differential roles of inflammation and apoptosis in initiation of mid-gestational abortion in malaria-infected C57BL/6 and A/J mice

Affiliations

Differential roles of inflammation and apoptosis in initiation of mid-gestational abortion in malaria-infected C57BL/6 and A/J mice

D Sarr et al. Placenta. 2015 Jul.

Abstract

Introduction: Plasmodium chabaudi AS-infection in pregnant A/J and C57BL/6J mice results in mid-gestational pregnancy loss. Although associated with increased systemic and placental pro-inflammatory responses and coagulopathy, the molecular mechanisms that underlie poor pregnancy outcomes in these mice are not yet fully understood. This study investigates the relationships between inflammation, apoptosis and malaria-induced pregnancy loss.

Methods: Infection with P. chabaudi AS in early murine pregnancy and term human placental tissues from an endemic setting were assessed by histology, immunohistochemistry, TUNEL staining, real-time PCR, flow cytometry, western blot, and ELISA.

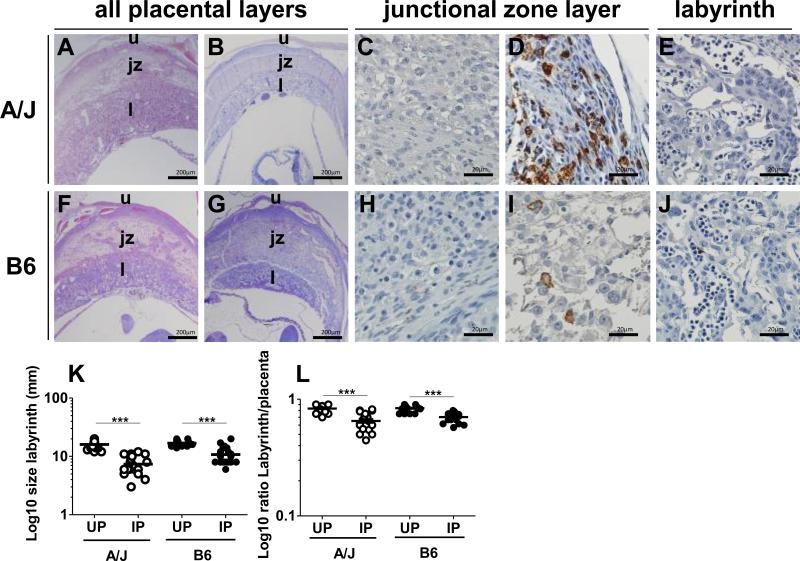
Results: Quantitative PCR reveals accumulation of lymphocytes and monocytes and upregulation of chemokines that attract these cell types in malaria-exposed mid-gestational A/J conceptuses. Monocyte accumulation is confirmed by flow cytometry and placental immunohistochemistry. Concurrent with initiation of malaria-induced abortion, markers of apoptosis are evident in the junctional zone, but not the labyrinth, of A/J placentae. In contrast, mid-gestation conceptuses in infected C57BL/6J lack evidence for monocyte accumulation, exhibiting low or no in situ placental staining despite trophoblast immunoreactivity for the monokine, CCL2. Additionally, placental apoptosis is not consistently observed, and when evident, appears after malaria-induced abortion typically initiates. Similarly, trophoblast apoptosis in term human placental malaria is not observed. Of those studied, a sole common feature of malaria-induced abortion in A/J and C57BL/6J mice is elevation of plasma tumor necrosis factor.

Discussion: Consistent with our previous observations, tumor necrosis factor is likely to be a central driver of malaria-induced pregnancy loss in both strains, but likely operates through mechanisms distinct from placental apoptosis in C57BL/6J mice.

Keywords: Abortion; Apoptosis; Inflammation; Placental malaria; Plasmodium chabaudi AS; Pregnancy.


Figures

Figure 1
Figure 1
T cell (A), B cell (B), natural killer cell (C), and macrophage (D) gene markers are variously upregulated in infected A/J (open bars) and B6 (filled bars) conceptuses relative to uninfected conceptuses at experiment days (ED) 9, 10, and 11. Expression is relative to the mean expression value in uninfected pregnant (UP) conceptuses and normalized to mouse 18S ribosomal RNA values. Columns and bars represent mean ± SEM of the relative quantities (fold changes) for each gene from at least three conceptuses each from five mice per group. Comparative statistical tests were not done between A/J versus B6 mice for gene expression but the D'Agostino-Pearson normality test was used to verify normal distribution of the data.
Figure 2
Figure 2
Number (X103) of CD11b+/CD115+/Gr1− monocytes (A, B) and CD11b+/CD115+/Gr1high inflammatory monocytes (C, D) per conceptus in A/J (open circles) and B6 (closed circles) mice at ED 9 (A, C) and ED 10 ( B, D) as indicated. Mice included in this experiment are uninfected pregnant (UP), and infected pregnant but not actively aborting (IP). Line at median is also indicated for each group and a Mann Whitney U test is used to compare total cell numbers between UP and IP for each strain. *P<0.05.
Figure 3
Figure 3
Placental pathology and differential monocyte/macrophage accumulation in the placentae of infected pregnant (IP) A/J and B6 mice at ED 10. Panels A-E represent A/J mice and panels F-J represent B6 mice. Panels A, B and F, G show representative hematoxylin and eosin-stained full thickness placental tissue sections from uninfected (UP) (A, F) and infected pregnant (IP) (B, G) A/J and B6 mice at ED 10, with reduction in thickness evident in infected placenta (bar is 200 μm in these panels). Panels C-E (A/J mice) and H-J (B6 mice) show F4/80 staining by immunohistochemistry at ED 10. Extensive staining is seen in the junctional zone of IP A/J mice (D) relative to UP A/J mice (C). The labyrinth of IP A/J mice is free of F4/80+ staining (E). IP B6 mice also show infrequent F4/80 positive staining in the junctional zone (I) but there is no positive staining in UP B6 mice (H) and the labyrinth of the IP mouse placenta has minimal staining (J). Placental tissue sections from both strains were devoid of immunoreactivity with rat IgG2b control Ab (see inset, Supplemental Figure 5)). Panel K summarizes reduction in thickness of the labyrinth in IP relative to UP mice from both strains at ED 10, measured by grid under 100x magnification (median line is shown for each group). Panel L depicts the ratio of the size of the labyrinth to the total size of the placenta in the same animals shown in (K). Panels (C, D, E, H, I, and J) are representative of 3 mice per group; bars indicate 20 μm. u = uterine wall; j = junctional zone; l = labyrinth. A one-way ANOVA was used to compare infected vs uninfected, and infected vs infected in each and between strain respectively ***P<0.001.
Figure 4
Figure 4
Gene expression of Ccl2 (A), Ccl3 (B), Ccl4 (C), and Csf1 (D) in infected pregnant A/J (open bars) and infected pregnant B6 (black bars) conceptuses. Expression is relative to the mean expression value in uninfected pregnant conceptuses for each strain and normalized to mouse 18S RNA values obtained within each group. Columns and bars represent mean ± SEM of the relative quantities (fold changes) for each gene from at least three conceptuses each from six mice per group. Comparative statistical tests were not done between A/J versus B6 mice for gene expression but the D'Agostino-Pearson normality test was used to verify normal distribution of the data.
Figure 5
Figure 5
Systemic CCL2 plasma levels in uninfected (UP) and infected pregnant (IP) A/J and B6 mice from ED 9 through ED 11 by ELISA (A). A single plasma CCL2 sample below the detection limit was assigned to 1 for the purpose of graphing and statistical analysis. Unpaired t test with Welch's correction was used for comparison between IP and UP for each strain. Immunostaining for CCL2 in placental tissue sections in A/J (B,C, F,G, J, and K) and B6 (D, E, H, I, L, and M) mice on EDs 9, 10, and 11. Sample size was 5 mice for each group at each time point.
Figure 6
Figure 6
Protein lysates from conceptuses of infected pregnant (IP) A/J at ED 9 (A) and B6 (B) mice at ED 10, undergoing active abortion (IP-A) or not (IP-NA), and uninfected (UP) were assessed by western blot for mouse cleaved PARP (cPARP) (89 kDa), and mouse cleaved Caspase 3 (cCASP3; 19 kDa, and 17 kDa), with GAPDH (37 kDa) as loading control. The immunoblots shown are representative of at least 3 individual experiments with 6 UP A/J, 11 IP A/J, 6 UP B6, and 10 IP B6 mice. Densitometry analysis for A and B is provided in Supplemental figure 3.
Figure 7
Figure 7
Immunostaining for markers of apoptosis in placental tissue sections from IP (infected pregnant) and UP (uninfected pregnant) A/J and B6 mice. All panels are ED 10 unless otherwise labeled. Panels A-D depict the full thickness of the placental disk; panels E to L show the junctional zone. Total mouse caspase 3 (CASP3) immunostaining is depicted in panels (A-D) for UP and IP A/J (A, B, respectively) and B6 (C, D, respectively) mice. Cleaved caspase 3 (cCASP3) staining is depicted for UP ED 10 and IP A/J (E, F, respectively) and B6 (G, H, respectively) mice. Mouse cleaved caspase 3 (cCASP3) is also depicted for infected A/J at ED 9 (I) and B6 mice at ED 11 (K). Panels J and L show TUNEL staining in spongiotropholast for IP A/J and IP B6 mice at ED 10. Panel M summarizes cCASP3 immunostaining for ED 10 in both mouse strains. Images for ED 10 specimens are representative of 4 UP A/J, 7 IP A/J, 4 UP B6, and 8 IP B6 mice. Images for ED 11 IP B6 are representative of 2 out of 4 mice, and images for ED 9 IP A/J are representative of 3 out of 4 mice; other mice in these groups had relatively lower levels of immunostaining. Arrows: maternal inflammatory cells; arrowheads: trophoblast. u = uterus; jz = junctional zone; l = labyrinth; * = maternal blood sinusoid. Bars represent 200 μm in panels A-D and 20 μm in panels E-L. A Kruskal-Wallis test with Dunn's post test was used to compare different groups. P values are indicated as *P<0.05, **P<0.01 and ns for not significant.
Figure 8
Figure 8
Tumor necrosis factor (TNF) plasma levels in uninfected, infected non-aborting and infected, aborting mice. Plasma samples were assayed by ELISA. Data for ED 10 and ED 11 were previously presented as UP and IP [25], without segregation on the basis of abortion status. *P<0.05, **P<0.01, ***P<0.001. A Kruskal-Wallis test with Dunn's post test was used to compare systemic TNF levels between UP, IP-NA, and IP-A for each strain at each time point as indicated.
Figure 9
Figure 9
Immunostaining for human total full length and cleaved caspase3 (CASP3 and cCASP3 respectively) and TUNEL staining of uninfected (A-C) and Plasmodium falciparum-infected (D-G) placental tissue sections from Kenyan women. CASP3 (A, D), cCASP3 (B, E), and TUNEL stained placental sections (C, F) are depicted. Images are representative of 6 uninfected and 11 infected tissue samples for human cCASP3, and 5 and 6, respectively, for TUNEL. Original magnification is 400x; bars indicate 20 μm. Panel G provides a summary for semi-quantitative scoring of human cCASP3 and TUNEL staining in uninfected (PM−) and placental malaria-infected (PM+) samples.

Similar articles

Cited by

References

    1. Dellicour S, Tatem AJ, Guerra CA, Snow RW, ter Kuile FO. Quantifying the number of pregnancies at risk of malaria in 2007: a demographic study. PLoS Med. 2010;7(1):e1000221. - PMC - PubMed
    1. Desai M, Ter Kuile FO, Nosten F, McGready R, Asamoa K, Brabin B, Newman RD. Epidemiology and burden of malaria in pregnancy. Lancet Infect Dis. 2007;7(2):93–104. - PubMed
    1. Fried M, Duffy PE. Adherence of Plasmodium falciparum to chondroitin sulfate A in the human placenta. Science. 1996;272(5267):1502–4. - PubMed
    1. Abrams ET, Brown H, Chensue SW, Turner GD, Tadesse E, Lema VM, Molyneux ME, Rochford R, Meshnick SR, Rogerson SJ. Host response to malaria during pregnancy: placental monocyte recruitment is associated with elevated beta chemokine expression. Journal of immunology. 2003;170(5):2759–64. - PubMed
    1. Lucchi NW, Koopman R, Peterson DS, Moore JM. Plasmodium falciparum-infected red blood cells selected for binding to cultured syncytiotrophoblast bind to chondroitin sulfate A and induce tyrosine phosphorylation in the syncytiotrophoblast. Placenta. 2006;27(4-5):384–94. - PubMed

Publication types

MeSH terms