. 2015 Jun 19;290(25):15866-15877.
doi: 10.1074/jbc.M115.645986. Epub 2015 May 8.

DAP12 Stabilizes the C-terminal Fragment of the Triggering Receptor Expressed on Myeloid Cells-2 (TREM2) and Protects against LPS-induced Pro-inflammatory Response

Affiliations

DAP12 Stabilizes the C-terminal Fragment of the Triggering Receptor Expressed on Myeloid Cells-2 (TREM2) and Protects against LPS-induced Pro-inflammatory Response

Li Zhong et al. J Biol Chem. .

Abstract

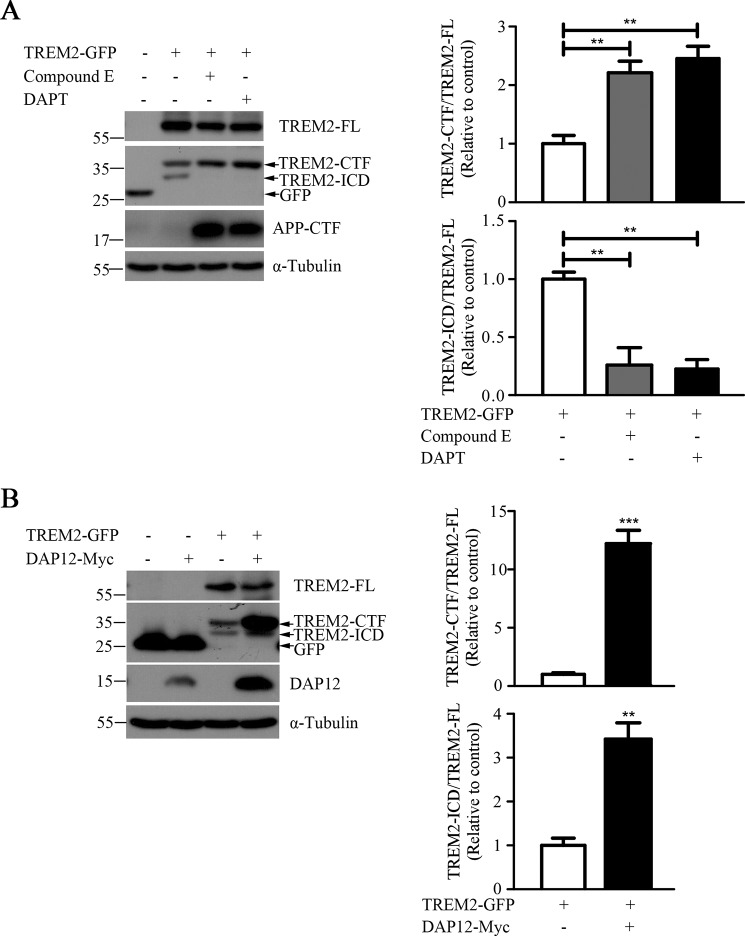
Triggering receptor expressed on myeloid cells 2 (TREM2) is a DAP12-associated receptor expressed in microglia, macrophages, and other myeloid-derived cells. Previous studies have suggested that TREM2/DAP12 signaling pathway reduces inflammatory responses and promotes phagocytosis of apoptotic neurons. Recently, TREM2 has been identified as a risk gene for Alzheimer disease (AD). Here, we show that DAP12 stabilizes the C-terminal fragment of TREM2 (TREM2-CTF), a substrate for γ-secretase. Co-expression of DAP12 with TREM2 selectively increased the level of TREM2-CTF with little effects on that of full-length TREM2. The interaction between DAP12 and TREM2 is essential for TREM2-CTF stabilization as a mutant form of DAP12 with disrupted interaction with TREM2 failed to exhibit such an effect. Silencing of either Trem2 or Dap12 gene significantly exacerbated pro-inflammatory responses induced by lipopolysaccharides (LPS). Importantly, overexpression of either full-length TREM2 or TREM2-CTF reduced LPS-induced inflammatory responses. Taken together, our results support a role of DAP12 in stabilizing TREM2-CTF, thereby protecting against excessive pro-inflammatory responses.

Keywords: Alzheimer disease; DAP12; TREM-CTF; TREM2; cytokine; inflammation; lipopolysaccharide (LPS); microglia; γ-secretase.


Figures

FIGURE 1.
FIGURE 1.
Co-expression of DAP12 with TREM2 increases the level of TREM2-CTF. A, HEK293T cells were transfected with TREM2-Myc in combination with vector control or DAP12-GFP. Cells were harvested 24 h after transfection and the lysates were analyzed by Western blotting. The levels of TREM2 and DAP12 were detected by antibodies against the Myc or GFP epitope, respectively. Blots with α-Tubulin in this and subsequent figures serve as loading controls. Bar graph to the right shows the quantification of Western blots as ratios of TREM2-CTF/FL (n = 4). **, p < 0.01. B, HEK293T cells were transfected with TREM2-GFP in combination with vector control or DAP12-Myc. Cell surface proteins were biotinylated with sulfo-NHS-biotin followed by precipitation with streptavidin beads. Biotinylated proteins were eluted with SDS-PAGE sample buffer and subjected to Western blotting. Bar graphs to the right show the quantification of Western blots as either relative levels of TREM2-FL or TREM2-CTF/TREM2-FL ratios on the cell surface (n = 3). ns, not significant; ***, p < 0.001. C, BV2 cells were transfected with TREM2-Myc in combination with vector control or DAP12-GFP. Cell lysates were collected at 24 h post-transfection. The levels of TREM2 and DPAP12 were detected by antibodies against Myc or GFP epitope, respectively. Bar graph to the right shows the quantification of Western blots as ratios of TREM2-CTF/TREM2-FL (n = 3). **, p < 0.01.
FIGURE 2.
FIGURE 2.
TREM2-CTF is a substrate for γ-secretase. A, HEK293T cells were transfected with TREM2-Myc in combination with DAP12-GFP or vector control for 24 h. Following immunostaining with antibody to Myc, cells were observed by fluorescence confocal microscopy with representative staining shown. Scale bar: 10 μm. Quantification shows the relative intensity of TREM2 fluorescence (n = 3). **, p < 0.01. B, HEK293T cells were transiently transfected with TREM2-Myc plasmids. After 8 h, cells were treated with 500 nm Compound E, 10 μm DAPT or vehicle control for 16 h. As a positive control, APP-CTF was detected by Western blotting using the 369 antibody (45). Bar graph to the right shows the quantification of Western blots as ratios of TREM2-CTF/TREM2-FL (n = 3). *, p < 0.05.
FIGURE 3.
FIGURE 3.
Co-expression of DAP12 with TREM2 increases the level of TREM2-ICD. A, HEK293T cells were transfected with TREM2-GFP then incubated for 16 h with 500 nm Compound E, 10 μm DAPT or vehicle control. Bar graphs to the right show the quantification of Western blots as ratios of TREM2-CTF/TREM2-FL or TREM2-ICD/TREM2-FL (n = 3). **, p < 0.01. B, BV2 cells were transfected with TREM2-GFP in combination with DAP12-Myc or vector control. Cells were harvested 24 h post-transfection, followed by Western blotting with antibodies against GFP (TREM2-FL, TREM2-CTF and TREM2-ICD), Myc (DAP12) and α-Tubulin. Bar graphs to the right show the quantification of Western blots as ratios of TREM2-CTF/TREM2-FL or TREM2-ICD/TREM2-FL (n = 3). **, p < 0.01; ***, p < 0.001.
FIGURE 4.
FIGURE 4.
Effects of DAP12 on TREM2-CTF require their interaction. A, HEK293T cells were co-transfected with TREM2-Myc and wild-type (DAP12 WT-GFP) or mutant (DAP12 D50A-GFP) DAP12 plasmids. Lysates were immunoprecipitated using antibodies against mouse IgG (M IgG), mouse anti-Myc antibody (Myc), rabbit IgG (R IgG), or rabbit anti-GFP antibody (GFP), followed by immunoblotting with antibody against the Myc or GFP epitope. Five percentage of total protein was loaded as an input control. Arrowheads indicate each specific band recognized by the antibodies or the IgG heavy or light chain. B, HEK293T cells were co-transfected with TREM2-Myc and wild-type (DAP12 WT-GFP) or mutant (DAP12 D50A-GFP) DAP12 plasmids. Cells were harvested 24 h after transfection, and the lysates were analyzed by Western blotting. Bar graph to the right shows the quantification of Western blots as ratios of TREM2-CTF/TREM2-FL (n = 3). **, p < 0.01.
FIGURE 5.
FIGURE 5.
DAP12 stabilizes TREM2-CTF by suppressing its degradation. A, HEK293T cells stably expressing HA-TREM2-Myc (scheme) were transfected with wild-type (DAP12 WT-GFP) or mutant (DAP12 D50A-GFP) DAP12 plasmids. Conditioned medium was collected 24 h post-transfection and precipitated with trichloroacetic acid (TCA). Cells were harvested and the lysates were analyzed by Western blotting. sTREM2 in the conditioned medium was detected by Western blotting with an anti-HA antibody. The levels of TREM2 and DPAP12 in the cell lysates were detected by antibody against the Myc or GFP epitope, respectively. Bar graph to the right shows the relative protein level of sTREM2 in the medium (n = 3). ns, not significant. B, HEK293T cells were transfected with TREM2-Myc in combination with vector control or DAP12-GFP. After 16 h, cells were incubated with 500 nm Compound E or vehicle control. Bar graph to the right shows the quantification of Western blots as ratios of TREM2-CTF/TREM2-FL, which was calculated by subtracting the TREM2-CTF/TREM2-FL ratio in the absence of Compound E from the TREM2-CTF/TREM2-FL ratio in the presence of Compound E (n = 3). ns, not significant. C, HEK293T cells were co-transfected with TREM2-Myc and wild-type (DAP12 WT-GFP) or mutant (DAP12 D50A-GFP) DAP12 plasmids. Cells were treated with 500 nm CHX for indicated time periods (hour, hr). Bar graphs to the right show the relative levels of TREM2-FL or TREM2-CTF (n = 3). The relative signal intensities of TREM2-FL and TREM2-CTF at various time points were normalized to the “0” time point. ***, p < 0.001.
FIGURE 6.
FIGURE 6.
Knockdown of Trem2 or Dap12 gene exacerbates LPS-stimulated pro-inflammatory cytokine production. A, BV2 cells were transiently transfected with non-targeting siRNA (NT) or Trem2-specific siRNAs for 48 h. The relative mRNA levels of Trem2 were determined by quantitative RT-PCR and shown as bar graph (n = 3). β-Actin was used as an internal control. **, p < 0.01; ***, p < 0.001. B, Cells from panel A were treated with 500 ng/ml LPS or vehicle control for 6 h. RNA was extracted and the relative mRNA levels of IL-1β and IL-6 shown as bar graph were determined by quantitative RT-PCR (n = 3). β-Actin was used as an internal control. ***, p < 0.001. C, BV2 cells were transiently transfected with non-targeting siRNA (NT) or Dap12-specific siRNAs for 48 h. The relative mRNA levels of Dap12 were determined by quantitative RT-PCR and shown as bar graph (n = 3). β-Actin was used as an internal control. ***, p < 0.001. D, cells from panel C were treated with 500 ng/ml LPS or vehicle control for 6 h. RNA was extracted and the relative mRNA levels of IL-1β and IL-6 shown as a bar graph were determined by quantitative RT-PCR (n = 3). β-Actin was used as an internal control. **, p < 0.01; ***, p < 0.001.
FIGURE 7.
FIGURE 7.
TREM2-CTF reduces LPS-induced pro-inflammatory cytokine production. A, BV2 cells were transiently transfected with TREM2-FL-Myc or TREM2-CTF-Myc and harvested for protein analysis 24 h post transfection. B, BV2 cells were transiently transfected with TREM2-FL-Myc and TREM2-CTF-Myc for 24 h. Following immunostaining with antibodies to TGN46, Myc or Giantin, cells were observed by fluorescence confocal microscopy with representative staining shown. Scale bar: 10 μm. C, cells from panel A were treated with 500 ng/ml LPS or vehicle control for 6 h. RNA was extracted and the relative mRNA levels of IL-1β and IL-6 shown as a bar graph were determined by quantitative RT-PCR (n = 4). β-Actin was used as an internal control. *, p < 0.05; **, p < 0.01; ***, p < 0.001.

References

    1. Schmid C. D., Sautkulis L. N., Danielson P. E., Cooper J., Hasel K. W., Hilbush B. S., Sutcliffe J. G., Carson M. J. (2002) Heterogeneous expression of the triggering receptor expressed on myeloid cells-2 on adult murine microglia. J. Neurochem. 83, 1309–1320 - PMC - PubMed
    1. Colonna M. (2003) TREMs in the immune system and beyond. Nat. Rev. Immunol. 3, 445–453 - PubMed
    1. Takahashi K., Rochford C. D., Neumann H. (2005) Clearance of apoptotic neurons without inflammation by microglial triggering receptor expressed on myeloid cells-2. J. Exp. Med. 201, 647–657 - PMC - PubMed
    1. Lanier L. L., Corliss B. C., Wu J., Leong C., Phillips J. H. (1998) Immunoreceptor DAP12 bearing a tyrosine-based activation motif is involved in activating NK cells. Nature 391, 703–707 - PubMed
    1. Paloneva J., Autti T., Raininko R., Partanen J., Salonen O., Puranen M., Hakola P., Haltia M. (2001) CNS manifestations of Nasu-Hakola disease: a frontal dementia with bone cysts. Neurology 56, 1552–1558 - PubMed

Publication types

MeSH terms