. 2015 May 20;6(14):11779-93.
doi: 10.18632/oncotarget.3151.

CSN6 deregulation impairs genome integrity in a COP1-dependent pathway

Affiliations

CSN6 deregulation impairs genome integrity in a COP1-dependent pathway

Hyun Ho Choi et al. Oncotarget. .

Abstract

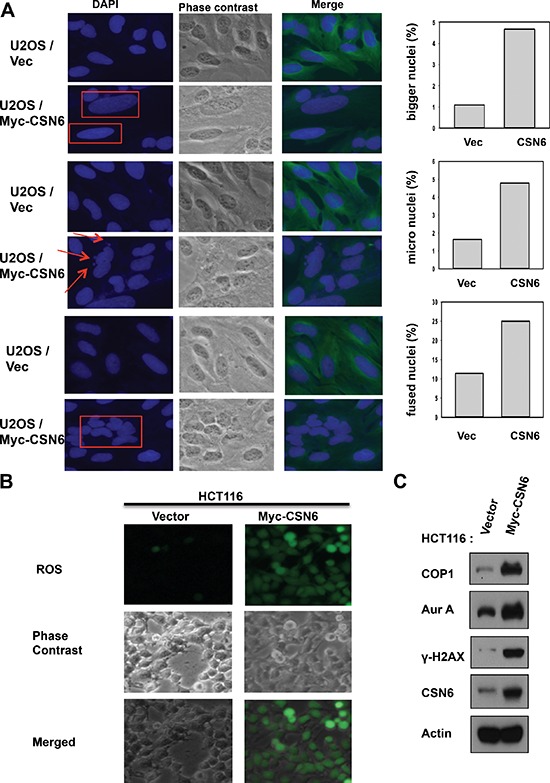
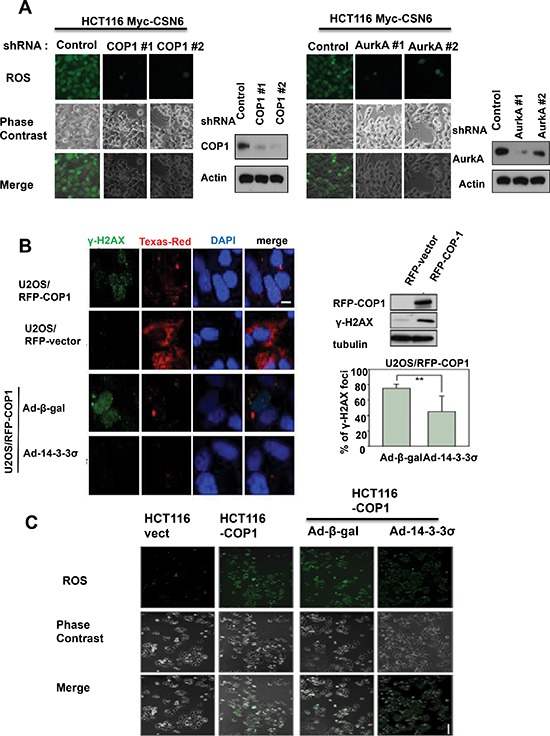
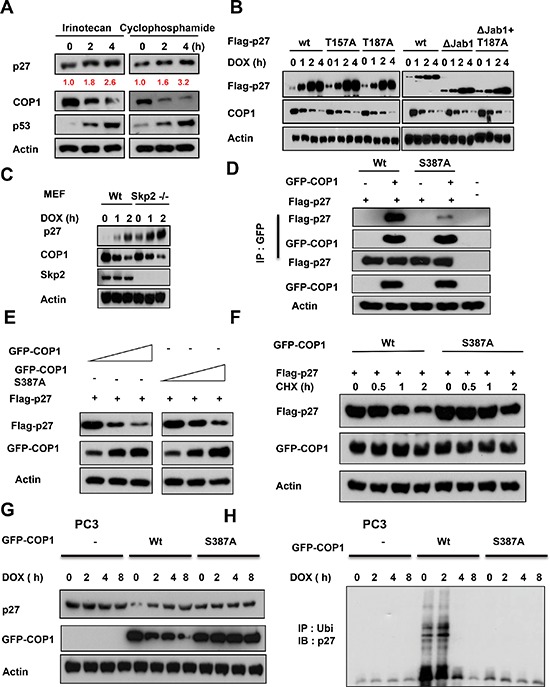
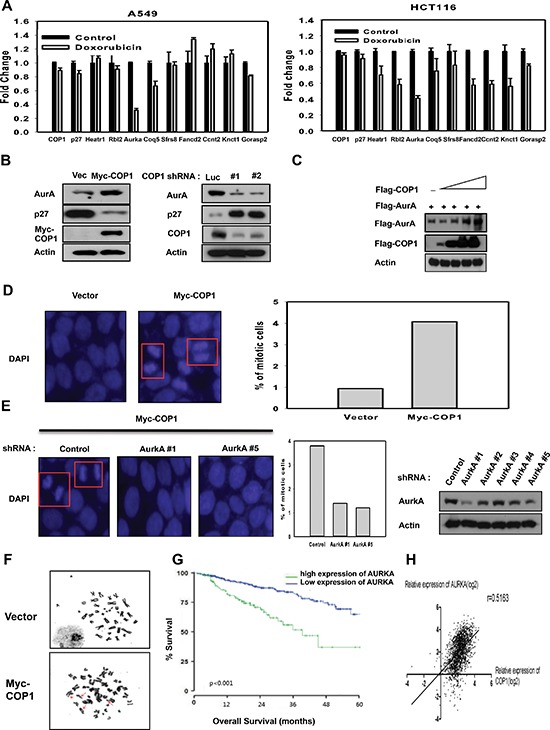
Understanding genome integrity and DNA damage response are critical to cancer treatment. In this study, we identify CSN6's biological function in regulating genome integrity. Constitutive photomorphogenic 1 (COP1), an E3 ubiquitin ligase regulated by CSN6, is downregulated by DNA damage, but the biological consequences of this phenomenon are poorly understood. p27(Kip1) is a critical CDK inhibitor involved in cell cycle regulation, but its response to DNA damage remains unclear. Here, we report that p27(Kip1) levels are elevated after DNA damage, with concurrent reduction of COP1 levels. Mechanistic studies showed that during DNA damage response COP1's function as an E3 ligase of p27 is compromised, thereby reducing the ubiquitin-mediated degradation of p27(Kip1). Also, COP1 overexpression leads to downregulation of p27(Kip1), thereby promoting the expression of mitotic kinase Aurora A. Overexpression of Aurora A correlates with poor survival. These findings provide new insight into CSN6-COP1-p27(Kip1)-Aurora A axis in DNA damage repair and tumorigenesis.

Keywords: 14-3-3σ; COP1; DNA damage; p27; ubiquitination.


Figures

Figure 1
Figure 1. CSN6 expression leads to mitotic defect and ROS production
(A) Stably expressing Myc-CSN6 (U2OS/Myc-CSN6) and Vector (U2OS vector) cells were stained with DAPI (4ʹ,6-Diamidino-2-Phenylindole, Dihydrochloride) and percentages of mitotic defects as demonstrated by bigger nuclei, micro nuclei, and fused nuclei were compared. Phase-contrast images and merged images of the same microscopic fields are shown. (B) ROS production (green fluorescence) was detected by DCFDA and fluorescence microscopy in indicated cells. Phase-contrast images and merged images of the same microscopic fields are shown. (C) CSN6 overexpressing cells have increased steady-state expressions of Aurk A and γ-H2AX. Equal amounts of cell lysates were immunoblotted with indicated antibodies.
Figure 2
Figure 2. CSN6-mediated ROS production and DNA damage involve COP1 and Aurora A
(A) Knockdown of COP1 or Aurora A attenuates CSN6-mediated ROS production. ROS production (green fluorescence) was detected by DCFDA and fluorescence microscopy in indicated cells. Phase-contrast images and merged images of the same microscopic fields are shown. (B) 14-3-3σ blocks the increase in γ-H2AX foci induced by COP1. Stably expressing RFP-COP1 (U2OS/RFP-COP1) and RFP vector (U2OS/RFP-vector) U2OS cells were examined for the distribution of γ-H2AX foci (green) by confocal microscope with anti-γ-H2AX and Alexa Fluor 488-conjugated secondary antibodies. DNA was counterstained with the DAPI dye (blue). Cell lysates of U2OS (RFP-vector and RFP-COP1) cells were also analyzed by immunoblotting using antibodies against γH2AX and RFP-COP1. U2OS/RFP-COP1 cells were also infected with Ad-β-gal or Ad-HA-14-3-3σ to examine their impacts on γH2AX foci formation. The bar graph shows percentage of nuclear γH2AX foci in Adenovirus-infected groups. Error bars represent 95% confidence intervals. 200 hundreds have been counted. Two asterisk, p < 0.01 (Student's t-test). Scale bar, 10 μm. (C) 14-3-3σ inhibits COP1-mediated ROS production. ROS production (green fluorescence) was detected by DCFDA and fluorescence microscopy in stably expressing Myc-vector HCT116 cells, Myc-COP1 HCT116 cells, Myc-COP1 HCT116 cells infected with Ad-β-gal or Ad-HA-14-3-3σ. Phase-contrast images and merged images of the same microscopic fields are shown. Scale bar, 50 μm.
Figure 3
Figure 3. COP1 is involved in p27 protein stability regulation during DNA damage
(A) p27 nuclear accumulation increases in response to doxorubicin. U2OS cells were treated with 1 μg/ml doxorubicin and co-transfected with either vector or GFP-COP1 and RFP-p27, stained with DAPI. (B) Reduced p27 ubiquitination in A549 cells after DNA damage. A549 cells were treated with 1 μg/ml doxorubicin (DOX) for the indicated times and lysates were analyzed by immunoblotting (IB) with the indicated antibodies. Cell lysates were immunoprecipitated with anti-ubi followed by immunoblotting with anti-p27. (C) MG132 reverses DNA damage-mediated COP1 downregulation. A549 cells treated with 1 μg/ml DOX for the indicated times were treated with MG132 for 3 hours. Lysates were analyzed by IB with the indicated antibodies. (D) COP1 depletion and accumulation of p27. COP1 shRNA (#1 or #2) or control shRNA HCT116 stable transfectants were treated with 1 μg/ml DOX for the indicated times. Cell lysates were analyzed by IB with the indicated antibodies. (E) p27 is accumulated in HCT116 p53−/− cells. HCT116 p53−/− cells were treated with 1 μg/ml DOX for the indicated times. Cell lysates were analyzed by IB with the indicated antibodies. (F) p27 is not accumulated in 14-3-3σ−/− cells treated with DOX. HCT116 14-3-3σ−/− cells were treated with 1 μg/ml DOX for the indicated times. Cell lysates were analyzed by IB with the indicated antibodies. (G) DNA damage–mediated upregulation of p27 is ATM-dependent. AT22IJE-T/pEBS7 (ATM−/−) or AT22IJE-T/YZ5 (ATM+/+) cells were treated with 1 μg/ml doxorubicin (DOX) for the indicated times. Lysates were analyzed by immunoblotting with the indicated antibodies. (H) p27 (VP) mutant accumulation and DNA damage. A549 cells were transfected with either wt Flag-p27 or Flag-p27 (VP→AA). Cells were treated with 1 μg/ml doxorubicin (DOX) for the indicated times. Lysates were analyzed by IB with anti-Flag, anti-COP1, or Actin.
Figure 4
Figure 4. COP1 modification is required for DNA damage-mediated p27 accumulation
(A) p27 accumulates in A549 cells after DNA damage. A549 cells were treated with 10 μg/ml irinotecan and 20 μg/ml cyclophosphamide for the indicated times and lysates were analyzed by IB with the indicated antibodies. (B) p27 accumulation occurs regardless of construct modifications. A549 cells were transfected as indicated with wild-type (wt) Flag-p27 or T157A, T187A, ΔJab1, or ΔJab1+T187A mutants. Cells were treated with 1 μg/ml DOX for the indicated times. Equal amounts of protein from cell lysates were analyzed by IB with anti-Flag, anti-COP1, or anti-Actin. (C) Skp2 is not involved in DNA damage-mediated p27 accumulation. Wild-type (wt) MEF cells and Skp2−/− cells were treated with 1 μg ml doxorubicin (DOX) for the indicated times. Lysates were immunoblotted with the indicated antibodies. (D) COP1 S387A mutant binds to p27 with less efficiency. Cells were transfected with the indicated plasmids and equal amounts of lysates were immunoprecipitated with anti-GFP, followed by immunoblotting with indicated antibodies. (E) COP1 S387A mutant reduces the steady-state expression of p27 with less efficiency. Cells were transfected with the indicated plasmids and equal amounts of lysates were immunoblotted with anti-Flag to examine the expression of p27. (F) COP1 S387A mutant accelerates the turnover of p27 with less efficiency. Cells were transfected with the indicated plasmids and treated with CHX (100 μg/ml) for the indicated times. Cell lysates were immunoblotted with the indicated antibodies. (G) COP1 S387A mutant does not have inverse relationship with p27 in the presence of DNA damage. PC3 cells were transfected with the indicated plasmids and cells were treated with 1 μg/ml doxorubicin (DOX) for the indicated times. Lysates were immunoblotted with the indicated antibodies. (H) COP1 S387A mutant does not have impact on p27 ubiquitination in the presence of DNA damage. PC3 cells were transfected with the indicated plasmids and cells were treated with 1 μg/ml doxorubicin (DOX) for the indicated times as in (g). The cell lysates of the transfected cells from (g) were immunoprecipitated with anti-ubi and immunoblotted with an anti-p27 antibody.
Figure 5
Figure 5. COP1 affects genome stability by affecting p27-Aurora A axis
(A) DNA damage downregulates the expression of genes that are suppressed through p27 mediation. mRNA levels of the indicated p27 target genes were determined by quantitative reverse transcription PCR in A549 and HCT116 cells after DNA damage. (B) COP1 overexpression or knockdown can affect the expression of p27 or Aurora A. (C) COP1 upregulated Aurora A steady-state expression in a dose-dependent manner. 293T cells were co-transfected with the indicated expression vectors. Equal amounts of protein from cell lysates were analyzed by immunoblotting with the indicated antibodies. (D–E) Stably expressing Myc-COP1 (HCT116/Myc-COP1) and Vector (HCT116/vector) cells (d) and Myc-COP1 overexpressing HCT116 cells infected with either AurkA shRNA or control shRNA (E) were stained with DAPI (4ʹ,6-Diamidino-2-Phenylindole, Dihydrochloride) and percentage of mitotic cells were compared. Lysates of Myc-COP1 overexpressing HCT116 cells infected with either AurkA shRNA or control shRNA were immunoblotted with indicated antibodies (E, right). (F) COP1 overexpression leads to deregulation of genome integrity. Giemsa-stained chromosomes from metaphase-arrested cells were examined to assess genomic aberrations. Chromosomes from Myc-COP1-overexpressing HCT116 stable transfectants and vector control transfectants were shown to illustrate chromosomal fragments and chromatid breaks. (G) High expression of Aurora A (AURKA) correlates with poor survival of multiple myeloma patients. Kaplan-Meier curves for overall survival according to Aurora A expression in 414 patients with multiple myeloma are shown. Increased expression of Aurora A was associated with poor overall survival. (H) Levels of COP1 expression was positively correlated with Aurora A expression in a cohort of patients with multiple cancer data sets.
Figure 6
Figure 6. COP1 promotes cell migration, hinders DNA damage repair
(A) COP1 promotes cell motility. Stable transfectants, HCT116/Myc-COP1 and HCT116/Myc-vector cells, were plated for wound healing assay. Stably expressing HCT116/Myc-COP1 cells were infected with Ad-β-gal or Ad-HA-14-3-3σ. Infected cells were plated for wound healing assay. Migrated cells in the wound were observed using time lapse microscopy. The size of wound healing area were digitized following the time lapse after the treatments and plotted as a line graph. Error bars represent 95% confidence intervals (n = 3). (B) COP1 knockdown reduces cell motility. U2OS cells were transfected with indicated plasmids and plated for wound healing assay. The size of wound healing area were digitized following the time lapse after the treatment and plotted as a line graph. (C) 14-3-3σ antagonizes COP1-promoted cell motility. HCT116/Myc-COP1 and HCT116/vector cells were plated for transwell assay. Migrated cells were stained with DAPI and counted. Stably expressing HCT116/Myc-COP1 cells were infected with Ad-β-gal or Ad-HA-14-3-3σ for 1 day. Infected cells were plated for transwell assay. Number of migrated cells was quantitated for each group and presented as a bar graph. Error bars represent 95% confidence intervals. Three asterisk, p < 0.001 (Student's t-test, n = 3). Scale bar, 50 μm. (D) COP1 overexpression reduces the repair of homologous recombination. Cells were transfected with indicated plasmids. DSB repair was shown by the percentage of cells expressing GFP using cell cycle profiles. Error bars represent 95% confidence intervals. (E) COP1 overexpression leads to reduced survival in response to DNA damage. Cells were irradiated with the indicated doses of IR. After 12 days, colonies were stained with 0.5% crystal violet and the colonies were counted. Surviving fractions were calculated.
Figure 7
Figure 7. COP1 accelerates tumor formation
(A) 14-3-3σ antagonizes COP1-mediated cell motility. U2OS/RFP-COP1 and U2OS/RFP-vector cells were plated for transwell assay. Stably expressing U2OS/RFP-COP1 cells were left uninfected, infected with Ad-β-gal or Ad-HA-14-3-3σ for 1 day. Infected cells were plated for transwell assay. Number of migrated cells was quantitated and presented as bar graphs. Error bars represent 95% confidence intervals. Three asterisk, p < 0.001 (Student's t-test, n = 3). Scale bar, 50 μm. (B) 14-3-3σ hinders COP1-mediated tumorigenicity. Indicated cells were injected subcutaneously into nude mice. Tumor volumes were measured at the indicated days. Error bars represent 95% confidence intervals. One asterisk, p < 0.05. Three asterisk, p < 0.001 (Student's t-test, n = 6). (C) Serial tumor sections from the experiment were stained with anti-cleaved Caspase 3 and anti-Ki67. (D) Model of CSN6-COP1-p27 axis in regulating chromosome stability.

References

    1. Yoshida A, Kato JY, Nakamae I, Yoneda-Kato N. COP1 targets C/EBPalpha for degradation and induces acute myeloid leukemia via Trib1. Blood. 2013;122:1750–1760. - PubMed
    1. Jin G, Yamazaki Y, Takuwa M, Takahara T, Kaneko K, Kuwata T, Miyata S, Nakamura T. Trib1 and Evi1 cooperate with Hoxa and Meis1 in myeloid leukemogenesis. Blood. 2007;109:3998–4005. - PubMed
    1. Zhang XC, Chen J, Su CH, Yang HY, Lee MH. Roles for CSN5 in control of p53/MDM2 activities. J Cell Biochem. 2008;103:1219–1230. - PubMed
    1. Chen B, Zhao R, Su CH, Linan M, Tseng C, Phan L, Fang L, Yang HY, Yang H, Wang W, Xu X, Jiang N, Cai S, Jin F, Yeung SC, Lee MH. CDK inhibitor p57 (Kip2) is negatively regulated by COP9 signalosome subunit 6. Cell Cycle. 2012;11:4633–4641. - PMC - PubMed
    1. Xue Y, Chen J, Choi HH, Phan L, Chou PC, Zhao R, Yang H, Santiago J, Liu M, Yeung GE, Yeung SC, Lee MH. HER2-Akt signaling in regulating COP9 signalsome subunit 6 and p53. Cell Cycle. 2012;11:4181–4190. - PMC - PubMed

Publication types

Substances