. 2015 May 7;161(4):737-49.
doi: 10.1016/j.cell.2015.03.031.

Quantifying Memory CD8 T Cells Reveals Regionalization of Immunosurveillance

Affiliations

Quantifying Memory CD8 T Cells Reveals Regionalization of Immunosurveillance

Elizabeth M Steinert et al. Cell. .

Abstract

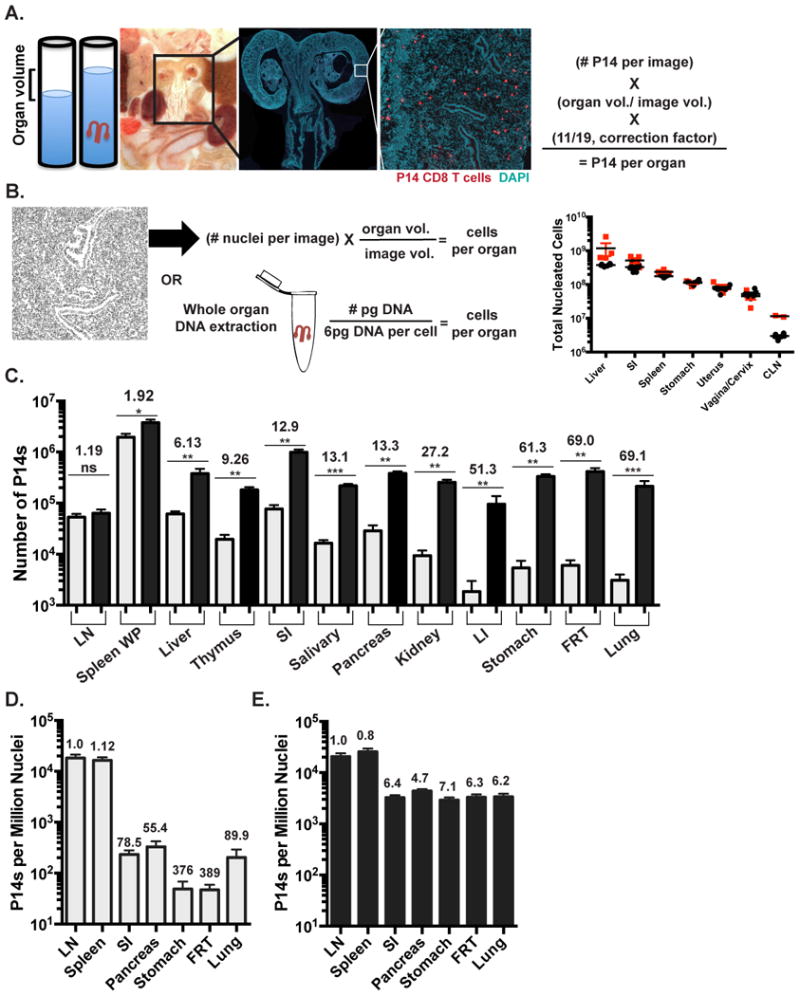
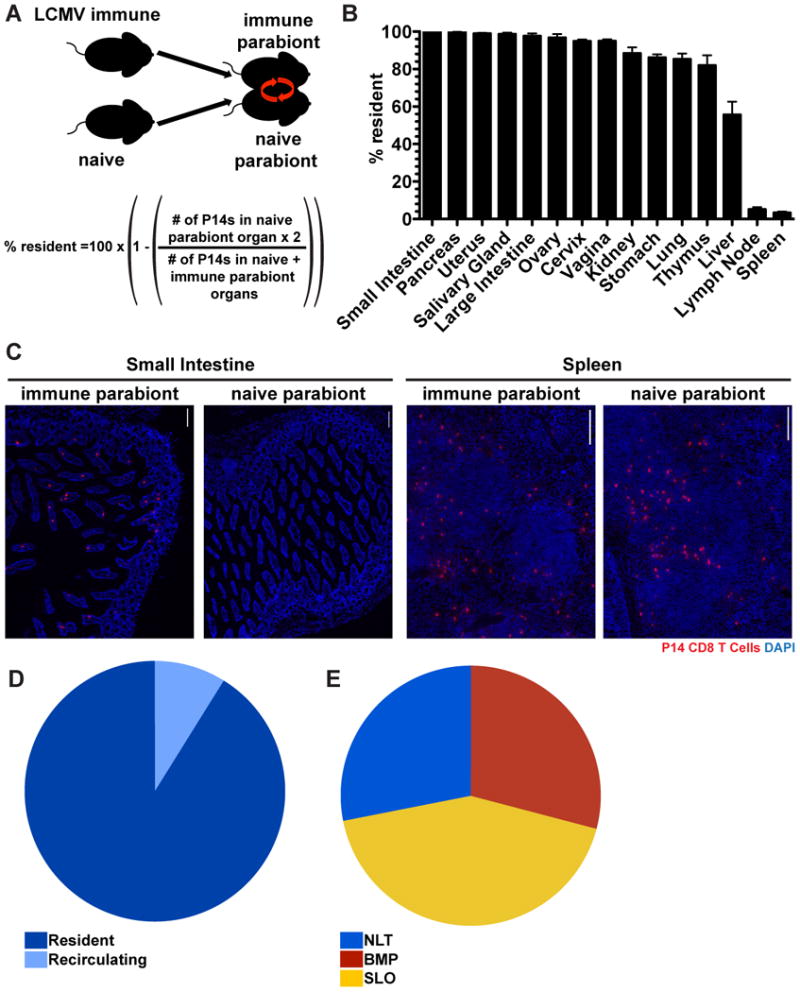
Memory CD8 T cells protect against intracellular pathogens by scanning host cell surfaces; thus, infection detection rates depend on memory cell number and distribution. Population analyses rely on cell isolation from whole organs, and interpretation is predicated on presumptions of near complete cell recovery. Paradigmatically, memory is parsed into central, effector, and resident subsets, ostensibly defined by immunosurveillance patterns but in practice identified by phenotypic markers. Because isolation methods ultimately inform models of memory T cell differentiation, protection, and vaccine translation, we tested their validity via parabiosis and quantitative immunofluorescence microscopy of a mouse memory CD8 T cell population. We report three major findings: lymphocyte isolation fails to recover most cells and biases against certain subsets, residents greatly outnumber recirculating cells within non-lymphoid tissues, and memory subset homing to inflammation does not conform to previously hypothesized migration patterns. These results indicate that most host cells are surveyed for reinfection by segregated residents rather than by recirculating cells that migrate throughout the blood and body.


Figures

FIGURE 1
FIGURE 1. Isolations underestimate total memory CD8 T cells and distort distribution
(A&B) Quantitative Immunofluorescence Microscopy (QIM) methodology. (A) Organ volumes were determined by displacement. Tissue sections were stained for Thy1.1 (red) and DAPI (teal) to identify memory P14 CD8 T cells and nucleated cells 120-150 days after LCMV infection of C57BI/6J mice. P14 counts per section were extrapolated to total organ volume and corrected to eliminate double counting. Whole FRT image scale bar=2000μm, cropped close up of FRT image scale bar= 250μm.(B) Total DAPI+ nucleated cells by QIM were extrapolated to total organ volume (black circles) and validated independently by DNA extraction (red squares), n=4. (C) Comparison of α-CD8α i.V.- P14 per tissue determined by cell isolation and flow cytometry (grey) or QIM (black). Total P14 frequency determined by (D) flow cytometry or (E) QIM relative to DAPI+ nucleated cells per organ as determined by QIM. Fold differences shown are relative to LN. n≥ 6, graphs show mean and SEM. *p<0.05, **p<0.01, ***p<0.001, Mann-Whitney-Wilcoxon test, (See also Figure S1, S2).
FIGURE 2
FIGURE 2. Isolation efficiency is biased by tissue compartment and cell phenotype
P14 immune chimeras were analyzed 120-150 days after LCMV infection. (A) Representative image of CD8α i.v. Ab+ (white arrow) or CD8α i.v. Ab- (yellow arrow) P14 CD8 T cells in lung. CD8α i.v. Ab (teal), Thy1.1 + P14 (red), Collagen IV (green), Cytokeratin 8/18 (Blue), scale bar= 50μm. (B) Ratio of i.v. Ab+ to i.v. Ab- P14s by flow cytometry (grey) and QIM (black) methodology. (C) Representative image of P14 CD8 T cell in small intestine epithelium (IEL, yellow arrow) and lamina propria (LPL, white arrows). Thy1.1+ P14 (red), Collagen IV (blue), Cytokeratin 8/18 (Green), scale bar= 50μm. (D) Ratio of LPL to IEL P14 by flow cytometry (grey) and QIM (black). (E) Representative image of CD103- (top panels) and CD103+ (bottom panels) P14 CD8 T cells in vaginal epithelium. CD103 (teal). Thy1.1+ P14 (red), Collagen IV (green), DAPI (blue), scale bar = 50μm. (F) Ratio of CD103- to CD103+ P14s by flow cytometry (grey) and QIM (black) in FRT. (G) Percent of vaginal IEL or LPL P14 expressing CD013, determined by QIM. n≥6, graphs show mean and SEM. *p<0.05, **p<0.01, ***p<0.001, Mann-Whitney-Wilcoxon test, (See also Figure S2).
FIGURE 3
FIGURE 3. The majority of memory CD8 T cells in NLT are TRM
(A) Ninety days after infection with LCMV Armstrong, P14 immune chimeras were conjoined to naive C57BL/6 mice using parabiosis. Thirty days after parabiosis surgery (B) the fraction of resident memory P14 CD8 T cells were calculated for the indicated tissues. n=3, representative of 9 mouse pairs from 3 independent experiments. Graphs show mean and SEM. (C) Representative images of P14 CD8 T cells in the small intestines and spleens of LCMV immune and naive parabionts, P14s (red) and DAPI (blue), scale bar= 50μm. (D) Distribution of resident and recirculating P14 CD8 T cells in nonlymphoid organs calculated by QIM. (E) P14 immune chimeras were analyzed 120-150 days after LCMV infection to determine the distribution of P14 CD8 T cells in secondary lymphoid organs (SLO), nonlymphoid tissues (NLT, including i.v. Ab- cells within liver, lung, kidney, pancreas, salivary gland, uterus, vagina and cervix, small intestine, large intestine, stomach and thymus) and circulating blood and marginated pool (BMP, includes i.v. Ab+ cells from all tissues examined), n≥6. Cell numbers from all tissues were calculated by QIM, except circulating blood, which was enumerated by cell isolation and flow cytometry, (See also Figure S2).
FIGURE 4
FIGURE 4. Memory CD8 T cell migration is compartmentally restricted within NLT
P14 immune chimeras conjoined to naive C57BL/6 mice (as in figure 3) were analyzed 30 days after parabiosis surgery. (A) The fraction of P14 CD8 T cells that are resident in the indicated tissue compartments, small intestine (SI), large intestine (LI), stomach (ST), epithelium (IEL), lamina propria (LP), submucosa (S.M.), muscularis externa (M.E.). (B) Representative thymus images in immune and naive parabionts. P14 CD8 T cells (red), DAPI (green), cytokeratin 5 (blue), scale bar= 50μm. (C) Percent of P14 CD8 T cells that are resident in the thymus medulla and cortex. (D) Percent of i.v. Ab+ P14 CD8 T cells that are resident within the kidney and liver. n=3, representative of 9 mouse pairs from 3 independent experiments. Graphs show mean and SEM, (See also Figure S2).
FIGURE 5
FIGURE 5. CD69 is an imperfect marker of tissue residence
(A) P14 CD8 T cells from immune parabionts were analyzed for the expression of CD69 in the pancreas, salivary gland and FRT by QIM. (B) The fraction of CD69+ and CD69- P14 CD8 T cells that were resident. (C) The percent of P14 CD8 T cells that were resident among i.v. Ab+/- and CD69+/- in the kidney and (D) liver. (E) Representative image of a CD69+ i.v. Ab+ P14 CD8 T cells in a large vessel in the liver. α-CD8α i.v. Ab (green), P14 CD8 T cells (red), and CD69 (purple). Blue arrows indicate α-CD8α i.v. Ab+ CD69+ P14 CD8 T cells, scale bar =20μm. n=3, representative of 9 mouse pairs from 3 independent experiments. Graphs show mean and SEM, (See also Figure S2).
FIGURE 6
FIGURE 6. Migration of memory CD8 T cell subsets
P14 CD8 T cells were analyzed by QIM from naive parabionts were quantified based on their localization within the parenchyma or afferent lymphatic Lyve-1 + vessels and for the expression of CD69 in the (A) salivary gland and (B) female reproductive tract. (C) Representative image of a P14 CD8 T cell in the FRT afferent lymphatics of a naive parabiont. Lyve-1 (blue) and P14 CD8 T cells (green), scale bar =10μm. (D) Fraction of CD69- P14 CD8 T cells in the FRT of the naive parabiont that were CD62L+ or CD62L-. n=3, representative of 9 mice from 3 independent experiments (E) 5×10⁵ CD62L+ or CD62L- memory OT-I CD8 T cells isolated from the spleen of VSV-OVA immune chimeras were transferred into P14 immune chimeras and the next day P14 immune chimeras were challenged transcervically with 50μg gp33 peptide. Two days later total numbers of OT-I CD8 T cells were enumerated in the FRT. n=6, representative of 2 independent experiments. Graphs show mean and SEM, (See also Figure S2).

Comment in

References

    1. Altman JD, Moss PA, Goulder PJ, Barouch DH, McHeyzer-Williams MG, Bell JI, McMichael AJ, David MM. Phenotypic analysis o antigen-specific T lymphocytes. Science. 1996;274:94–96. - PubMed
    1. Anderson KG, Mayer-Barber K, Sung H, Beura L, James BR, Taylor JJ, Qunaj L, Griffith TS, Vezys V, Barber DL, et al. Intravascular staining for discrimination of vascular and tissue leukocytes. Nat Protoc. 2014;9:209–222. - PMC - PubMed
    1. dos Anjos Pires M, Palmeira C, Rodrigues P, Lopes C, Oliveira-Torres F. Establishment of a diploid reference value for DNA ploidy analysis by image cytometry in mouse cells. Anal Quant Cytol Histol. 2001;23:427–432. - PubMed
    1. Casey KA, Fraser KA, Schenkel JM, Moran A, Abt MC, Beura LK, Lucas PJ, Artis D, Wherry EJ, Hogquist K, et al. Antigen-Independent Differentiation and Maintenance of Effector-like Resident Memory T Cells in Tissues. J Immunol. 2012;188:4866–875. - PMC - PubMed
    1. Clark RA, Chong B, Mirchandrani N, Brinster NK, Yamanaka K, Dowgiert RK, Kupper TS. The Vast Majority of CLA+ T cells are Resident in Normal Skin. J Immunol. 2006;176:4431–4439. - PubMed

Publication types