. 2015 May 7;161(4):845-57.
doi: 10.1016/j.cell.2015.03.052.

Structural snapshots of actively translating human ribosomes

Affiliations

Structural snapshots of actively translating human ribosomes

Elmar Behrmann et al. Cell. .

Abstract

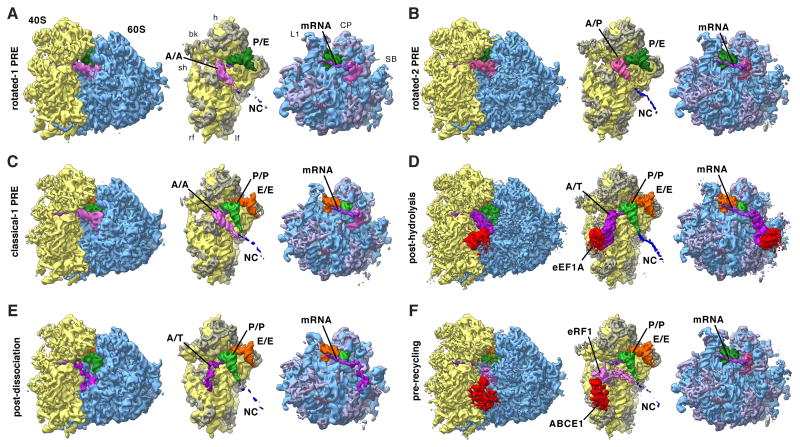
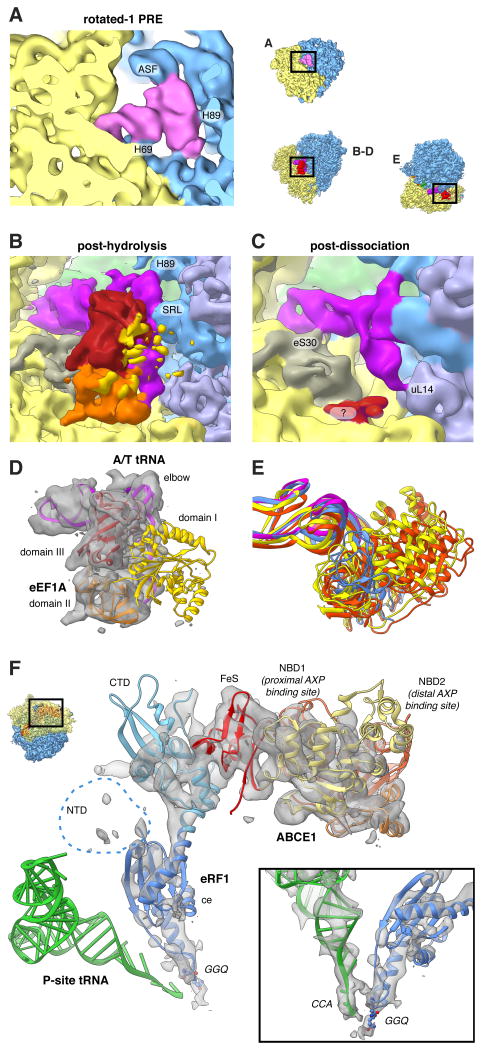
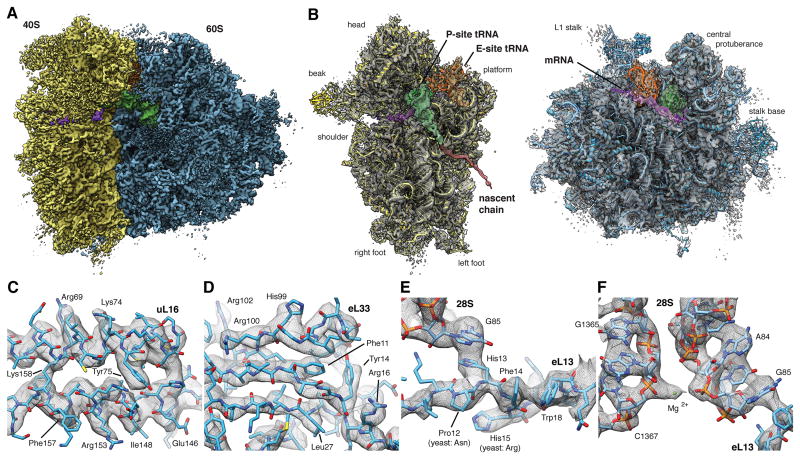
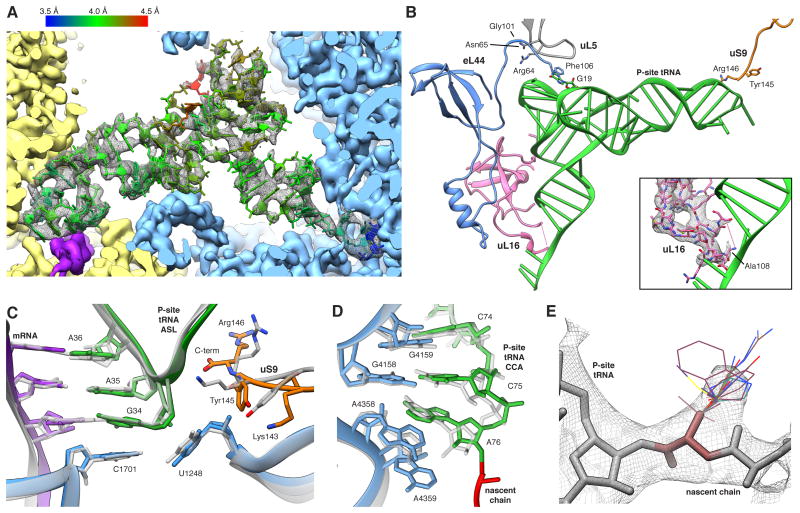
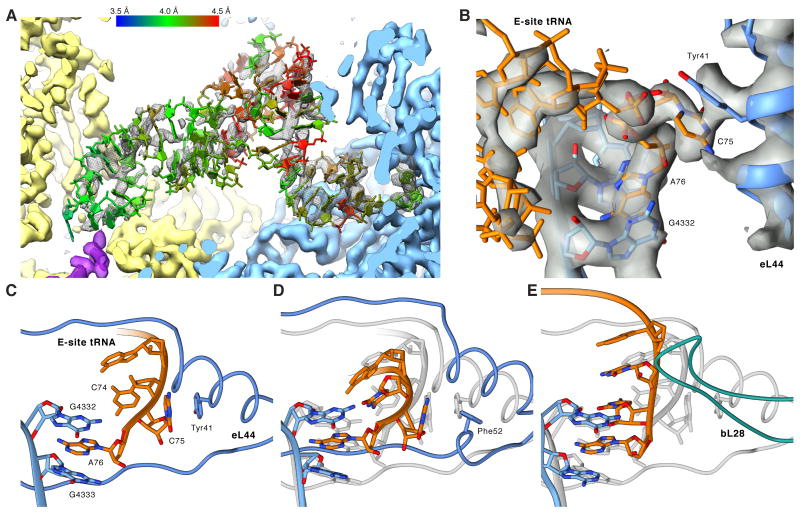
Macromolecular machines, such as the ribosome, undergo large-scale conformational changes during their functional cycles. Although their mode of action is often compared to that of mechanical machines, a crucial difference is that, at the molecular dimension, thermodynamic effects dominate functional cycles, with proteins fluctuating stochastically between functional states defined by energetic minima on an energy landscape. Here, we have used cryo-electron microscopy to image ex-vivo-derived human polysomes as a source of actively translating ribosomes. Multiparticle refinement and 3D variability analysis allowed us to visualize a variety of native translation intermediates. Significantly populated states include not only elongation cycle intermediates in pre- and post-translocational states, but also eEF1A-containing decoding and termination/recycling complexes. Focusing on the post-translocational state, we extended this assessment to the single-residue level, uncovering striking details of ribosome-ligand interactions and identifying both static and functionally important dynamic elements.


Figures

Figure 1
Figure 1. The Experimentally Observed Elongation Circle
(A) Sucrose density-gradient analysis of the polysomal sample and (B) raw micrograph after size-exclusion gel-filtration. Scale bar represents 100 nm. (C) Overview of the cryo-EM maps in the framework of the elongation circle. Translocation and decoding-sampling/-recognition complexes (grayed out) were not observed experimentally and are represented by simulated maps based on published factor structures (PDB ID 4cxh, PDB ID 2p8w). For POST and classical PRE structures with different amounts of rolling were observed, represented by the blue-scale bar. All maps are filtered to 7.5 A. Insert: Relative occupancies are color-coded in grayscale. See also Figure S1.
Figure 2
Figure 2. Functional States Reconstructed from Human Polysomes
Cryo-EM maps filtered to their global resolution (Table S1) corresponding to (A) rotated-1 PRE, (B) rotated-2 PRE, (C) classical-1 PRE, (D) post-hydrolysis (E) post-dissociation and (F) pre-recycling states. For the POST state at high resolution see Figure 4. For the rotated PRE* state and states featuring intermediate amounts of rolling see Figure S2. Left: Ribosomal complexes with SSU depicted in yellow and LSU in blue. Right: Segmented cryo-EM maps, rotated by 80°: A/A-site tRNA (pink), A/T-site tRNA (dark pink), A/P-site tRNA (medium pink), eRF1 (pink), P-site tRNA (green), P/E-site tRNA (dark green), E-site tRNA (orange), mRNA (purple), eEF1 A (red), ABCE1 (red), NC (blue), 18S RNA (yellow), 40S r-proteins (gray-yellow), 28S, 5S, 5.8S RNA (blue), and 60S r-proteins (gray-blue). See also Figure S2 and Table S1.
Figure 3
Figure 3. Imaging Ex vivo-derived Polysomes Allows the Visualisation of Transient States
(A) Close-up view of the rotated-1 PRE state A-site tRNA and (B-E) of the post-decoding states. (B,D) Only domain III (red) and domain II (orange) of eEF1A feature strong density, while domain I (yellow) is fragmented. The A/T-tRNA (dark pink) elbow is connected to the SRL and H89. (C) For the post-dissociation state additional contacts with eS30 and uL14 are visible. A fragmented density of unclear origin is shown in red. (E) 18S RNA-based overlay of decoding-sampling (yellow), decoding-recognition (orange), post-decoding post-hydrolysis (blue) and post-decoding post-dissociation (pink) models for eEFIA and the A/T-tRNA elbow. (F) Close-up view of the pre-recycling state showing eRF1 (shades of blue) and ABCE1 (yellow to red). Atomic models are based on (Preis et al., 2014). See also Movie S1.
Figure 4
Figure 4. High-resolution Structure of the Human Ribosome in the POST State
(A) Surface representation of the POST state cryo-EM map filtered to 3.5 A (blue: LSU, yellow: SSU, green: P-site tRNA, orange: E-site tRNA, purple: mRNA). (B) Individual subunit maps with the corresponding atomic models. Segmented density corresponding to the NC (red) is shown filtered to 7.0 A for clarity. Segmented maps are shown turned by 80°. (C-F) Enlarged regions of the cryo-EM map showing well-resolved (C) alpha-helices or (D) beta-strands with individual side-chains, (E,F) strong π -stacking interactions and (F) individual nucleotides with nearby ions. See also Figures S3 and S4. See also Tables S2, S3 and S4.
Figure 5
Figure 5. Eukaryotic-specific Bridges eB12, eB13 and eB14 are Differentially Affected by Inter-subunit Rotation
Comparison of yeast LSU crystal structures (“ribosome A”: orange, “ribosome B”: purple) (Ben-Shem et al., 2011) with the present unrotated human atomic model (blue). The orientation aid illustrates the orientation of the 80S in each panel. (A) In the unrotated state, the C-terminal helix of eL19 forming eB12 is bend compared to the yeast structures, however, (B) virtually identical interactions are observed between eL19 and es6E. (C) To visualize the flexible linker tethering the C-terminal kinked “anchor” of eL24 forming eB13, density is shown filtered to 7.0 Å. Despite a strong displacement of the “anchor”, its overall shape remains highly similar. (D) The central bridge eB14 is hardly affected by intersubunit rearrangements. See also Table S5.
Figure 6
Figure 6. The P-site tRNA is Defined Despite Chemical Heterogeneity
(A) Cryo-EM map (mesh) and atomic model of the P-site tRNA (colored by local resolution as determined by ResMap). SSU yellow, LSU blue and mRNA density in purple. (B) Key interactions of the P-site tRNA with its binding pocket on LSU and SSU. The insert shows the fragmented density of the uL16 P-site loop (mesh). (C,D) Comparison between prokaryotic (transparent) and human (color) (C) ASL and (D) PTC. Atomic models of the prokaryotic (PDB ID 2J00) and the eukaryotic LSU were aligned based on the LSU rRNA. (E) Cryo-EM map (mesh) of A76 and the first residues of the NC. Stick representations depict the most abundant rotamers of each amino acid with the exception of phenylalanine and tyrosine, where less abundant rotamers are depicted, and proline, which is not shown. See also Figures S5 and S6.
Figure 7
Figure 7. Native POST State Ribosomes Contain an E-site tRNA
(A) Cryo-EM map (mesh) and atomic model of the E-site tRNA (colored by local resolution as determined by ResMap). (B) Close-up on the cryo-EM map (transparent gray) of the CCA-end of the E-site tRNA (orange) and surrounding LSU elements (blue) (C-E) Comparison between human, archaeal and bacterial E-site CCA-ends. Atomic models were aligned based on the LSU rRNA and are depicting (C) the human, (D) the H. marismortui and (E) the T. thermophilus CCA-end. In (D) and (E), the human model is shown in transparent gray for comparison. See also Figures S5, S6 and S7.

References

    1. Agirrezabala X, Lei J, Brunelle JL, Ortiz-Meoz RF, Green R, Frank J. Visualization of the hybrid state of tRNA binding promoted by spontaneous ratcheting of the ribosome. Mol Cell. 2008;32:190–197. - PMC - PubMed
    1. Agmon I, Bashan A, Zarivach R, Yonath A. Symmetry at the active site of the ribosome: structural and functional implications. Biol Chem. 2005;386:833–844. - PubMed
    1. Anger AM, Armache JP, Berninghausen O, Habeck M, Subklewe M, Wilson DN, Beckmann R. Structures of the human and Drosophila 80S ribosome. Nature. 2013;497:80–85. - PubMed
    1. Ben-Shem A, Garreau de Loubresse N, Melnikov S, Jenner L, Yusupova G, Yusupov M. The structure of the eukaryotic ribosome at 3.0 A resolution. Science. 2011;334:1524–1529. - PubMed
    1. Brandt F, Carlson LA, Hartl FU, Baumeister W, Griinewald K. The Three-Dimensional Organization of Polyribosomes in Intact Human Cells. Mol Cell. 2010;39:560–569. - PubMed

Publication types