. 2015 May 7;161(4):919-32.
doi: 10.1016/j.cell.2015.03.032.

Widespread Proteome Remodeling and Aggregation in Aging C. elegans

Affiliations

Widespread Proteome Remodeling and Aggregation in Aging C. elegans

Dirk M Walther et al. Cell. .

Erratum in

Abstract

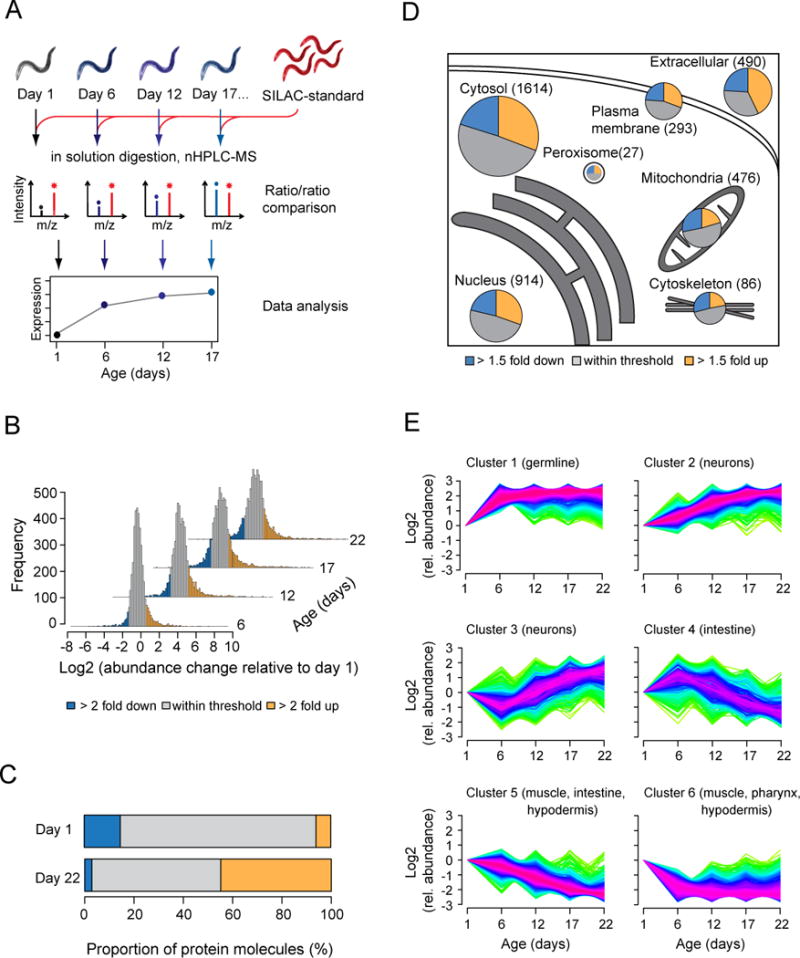
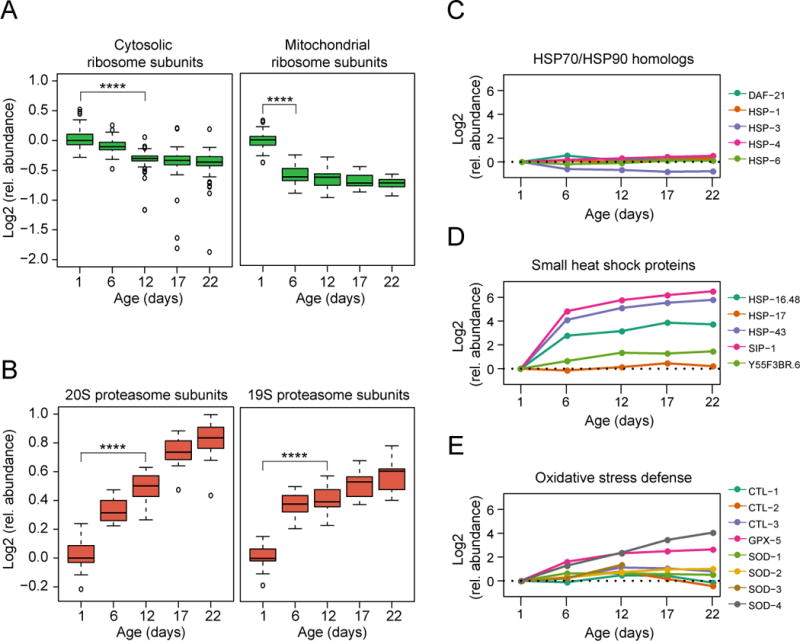
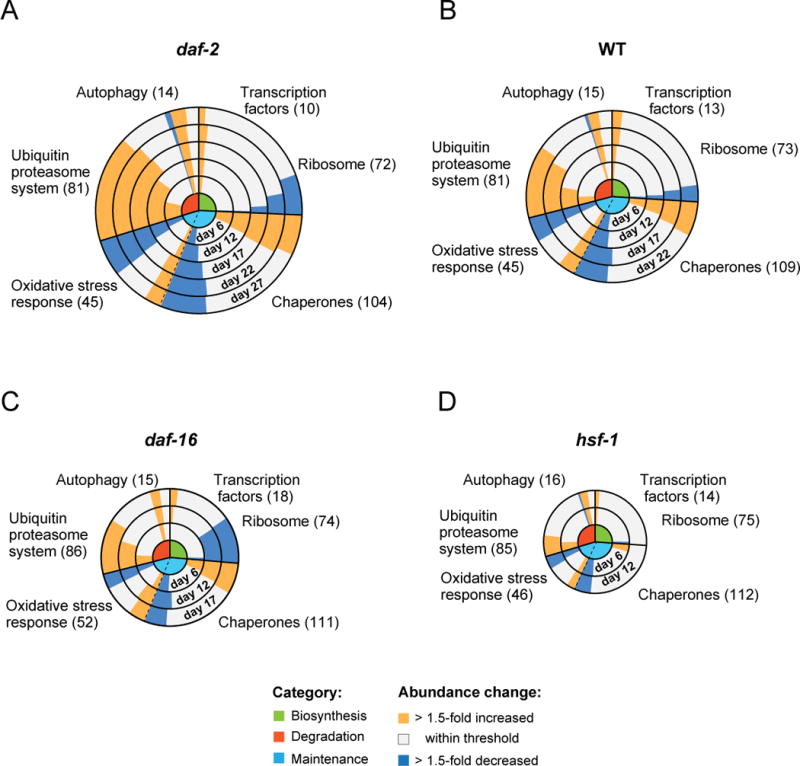
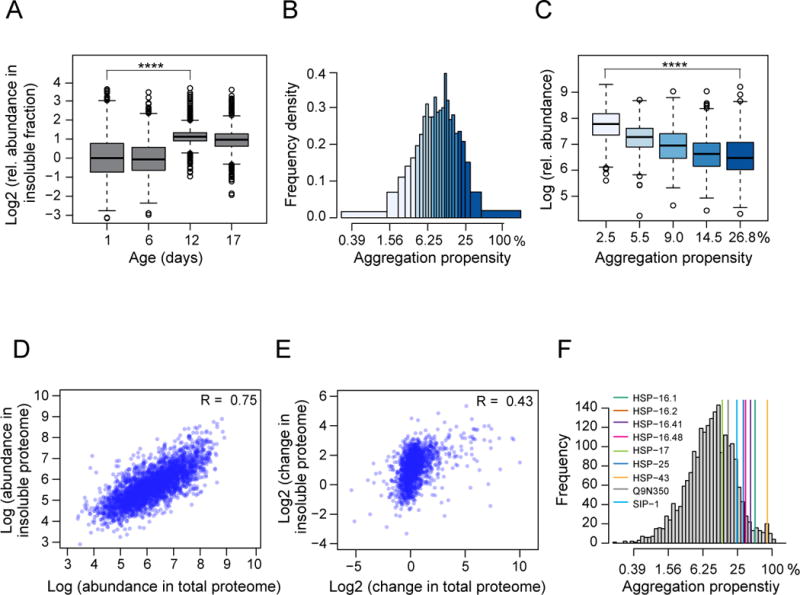
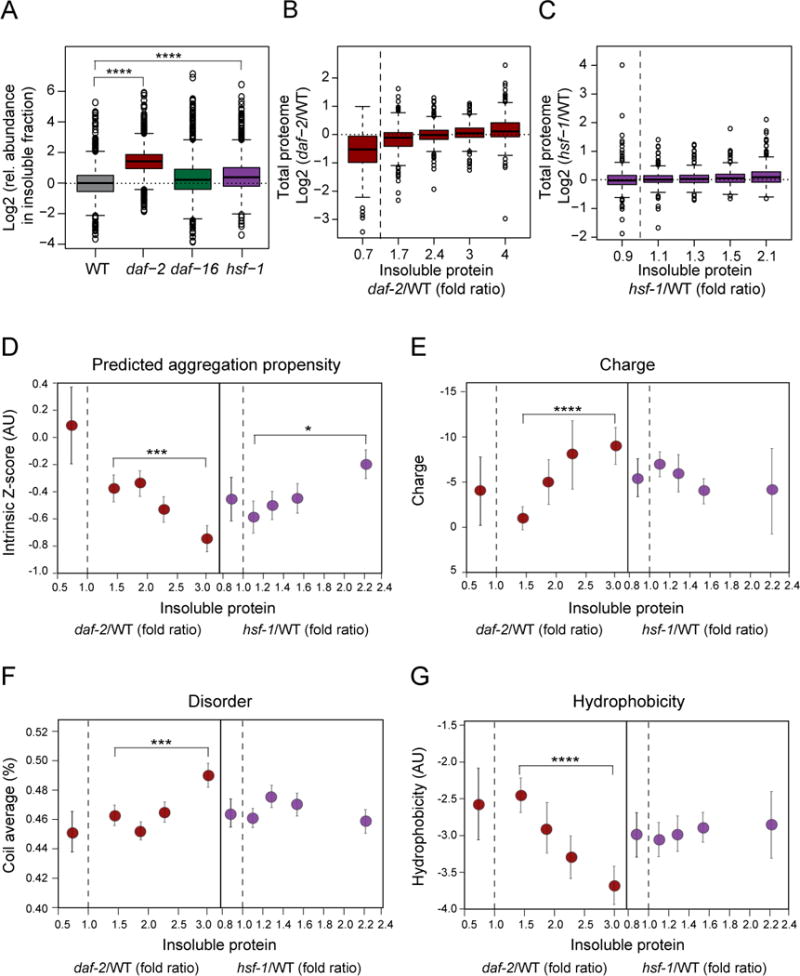
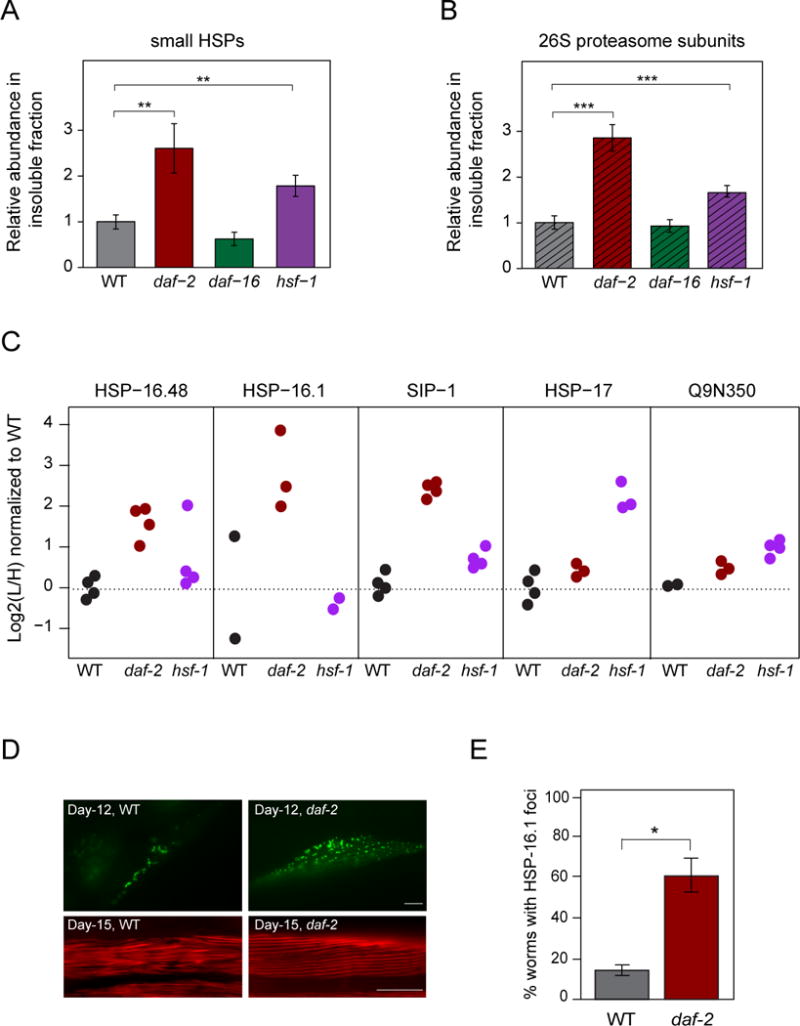
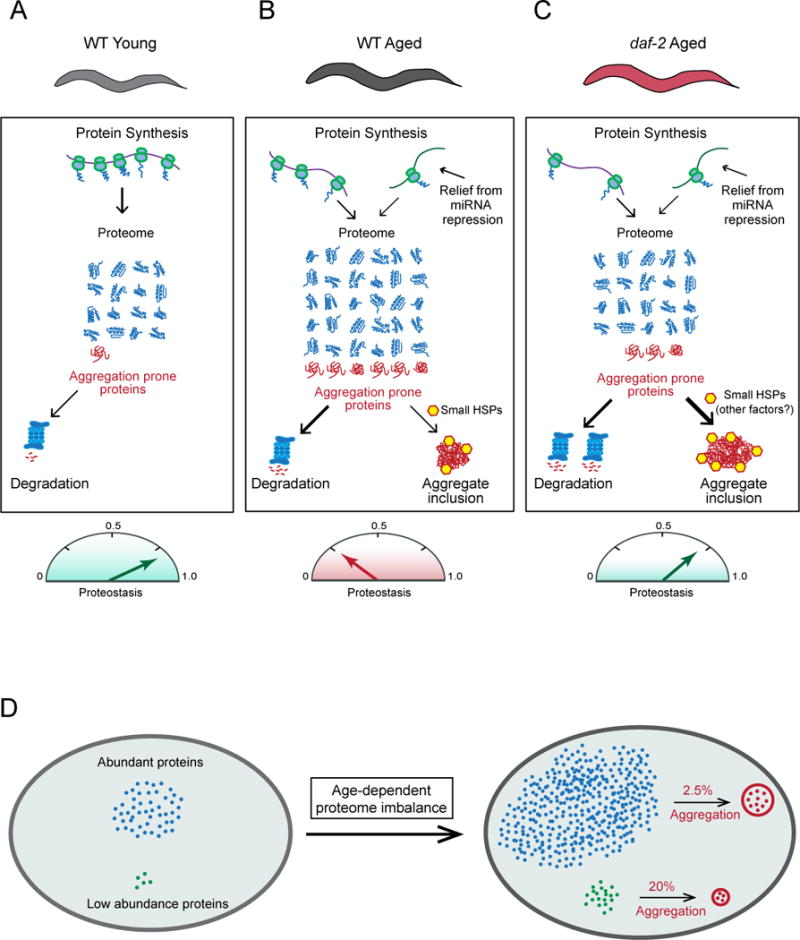
Aging has been associated with a progressive decline of proteostasis, but how this process affects proteome composition remains largely unexplored. Here, we profiled more than 5,000 proteins along the lifespan of the nematode C. elegans. We find that one-third of proteins change in abundance at least 2-fold during aging, resulting in a severe proteome imbalance. These changes are reduced in the long-lived daf-2 mutant but are enhanced in the short-lived daf-16 mutant. While ribosomal proteins decline and lose normal stoichiometry, proteasome complexes increase. Proteome imbalance is accompanied by widespread protein aggregation, with abundant proteins that exceed solubility contributing most to aggregate load. Notably, the properties by which proteins are selected for aggregation differ in the daf-2 mutant, and an increased formation of aggregates associated with small heat-shock proteins is observed. We suggest that sequestering proteins into chaperone-enriched aggregates is a protective strategy to slow proteostasis decline during nematode aging.


Figures

Figure 1
Figure 1. Proteomic Analysis of Aging in C. elegans
(A) Experimental design of total proteome analysis. Synchronized worm populations at different time points were lysed and mixed with a metabolically (SILAC) labeled internal protein standard. After digestion, peptides were either analyzed directly or after fractionation by isoelectric focusing, followed by nano-HPLC coupled mass spectrometry (MS). (B) Proteome changes in WT animals 6, 12, 17 and 22 days of age relative to day 1 animals (Table S1B). The proportions of proteins that are at least 2-fold increased or decreased in abundance are marked in yellow or blue, respectively. (C) Contribution to the total proteome of the proteins that change at least 2-fold in abundance between young (day 1) and aged (day 22) animals, as displayed in (A) and estimated by label free quantification (absolute LFQ) (Table S1B). (D) Proteome changes in subcellular compartments. The fractions of the total proteome that increased (yellow) or decreased (blue) at least 1.5-fold in abundance in old (day 22) versus young (day 1) animals are shown. Grey, proteins that remained within the indicated abundance thresholds. Numbers of identified proteins are indicated. Protein subcellular localization was predicted using WoLF PSORT. (E) Clustering of time course expression patterns in WT animals using the fuzzy c-means algorithm (Kumar and Futschik, 2007). Significantly enriched tissues as determined by Wilcoxon rank sum test at 2% false discovery rate against predicted expression scores (Chikina et al., 2009) are indicated for each cluster. Warm (red) and cold (blue) colors indicate low and high deviation from the consensus profile, respectively.
Figure 2
Figure 2. Abundance Changes in Specific Components of the Proteostasis Network
(A) Abundance changes of ribosomal proteins during the lifespan of C. elegans. 70 different cytosolic (left) and 34 mitochondrial ribosomal proteins (right) were quantified (see Table S3). Log2 values of fold-changes are shown in boxplot representation. Solid horizontal lines indicate the median values, whisker caps indicate 10th and 90th percentiles, and circles indicate outliers. ****, p-value <4.35 × 10⁻¹³ for cytosolic ribosomal proteins and 1.17 × 10⁻¹⁰ for mitochondrial ribosomal proteins from Wilcoxon signed rank test. Only proteins quantified at both time points tested were considered. (B) Abundance changes of proteasome subunits during lifespan. All 14 subunits of the 20S and 17 subunits of the 19S proteasome were quantified. Only subunits quantified in at least two time points are displayed. ****, p-value <1.23 × 10⁻⁴ and ****, p-value <1.53 × 10⁻⁵ from Wilcoxon signed rank test. (C–E) Abundance profiles of proteostasis network (PN) components along the lifespan of WT animals. Log2 relative changes in abundance are shown for HSP70 and HSP90 homologs (C), small HSPs (D), and proteins involved in oxidative stress defense (E). Only components quantified at day 1 and at least three consecutive time points are displayed.
Figure 3
Figure 3. Remodeling of the Proteostasis Network During Aging
(A–D) Abundance changes in components of the PN (see Figure S2A) during aging in daf-2 (A), WT (B), daf-16 (C) and hsf-1 (D) mutant worms. Concentric circles represent increasing age in days from center to periphery. Circle size corresponds with lifespan. Functional categories of components are indicated in the center: green, biosynthesis; red, degradation; light blue, conformational maintenance (see Figure S2A). Abundance changes of components within these categories relative to day 1 of each strain (yellow, >1.5-fold up; blue, >1.5-fold down) are indicated as bars, with the length of the bar representing the number of proteins undergoing change. The total number of proteins quantified in the respective categories are indicated.
Figure 4
Figure 4. Proteome-wide Analysis of Protein Aggregation during Aging
(A) Relative abundance of proteins in the insoluble fraction of WT animals during aging determined by SILAC quantification (see Figure S4C and Table S1D). At least 1355 proteins were quantified at the different time points (~3228 different proteins in total). ****, p-value <2.2 × 10⁻¹⁶ from Wilcoxon signed rank test. (B) Distribution of aggregation propensities of proteins (insoluble protein as fraction of total protein) in WT animals at day 12 (median from 3 independent experiments; Table S1E). Whole worm lysates and insoluble fractions were quantified against the same SILAC standard and ratios were calculated for each protein in % of total (see Figure S4D). (C) Relationship between aggregation propensity and total protein abundance. Proteins were divided into quantiles based on their measured aggregation propensities (median values are indicated in %). Label free absolute quantification was used to estimate total protein abundance (displayed as relative abundance values). ****, p-value <2.2 × 10⁻¹⁶ from Wilcoxon rank sum test. (D) Protein abundance in the insoluble fraction is positively correlated with abundance in the total proteome (absolute LFQ values). Data for WT animals at day 12 are shown. The Pearson correlation coefficient R is indicated. (E) Positive correlation between age-related protein abundance changes in the insoluble fraction and abundance changes for the same proteins in the total proteome. Abundance differences measured by SILAC between aged (day 12) and young (day 1) WT animals are plotted. The Pearson correlation coefficient R is indicated. (F) Aggregation propensities of small HSP family members relative to the aggregation propensities of all quantified proteins in the proteome of day 12 WT animals.
Figure 5
Figure 5. Protein Aggregation in Lifespan Mutant Worms During Aging
(A) Increased aggregate load in daf-2 mutant animals compared to WT, daf-16 and hsf-1 mutant animals at day 12. Relative abundance values of proteins in the insoluble fraction were determined by SILAC quantification. 1367, 1988, 1449 and 1485 proteins were quantified in WT, daf-2, daf-16 and hsf-1 mutant animals, respectively (one representative out of 4 independent experiments is displayed; Table S1F). ****, p-value <2.2 × 10⁻¹⁶ from Wicoxon signed rank test. (B and C) Quantiled abundance of proteins in the insoluble fraction of daf-2 (352–354 proteins per quantile) (B) and hsf-1 mutant (292 proteins per quantile) (C) relative to WT animals at day 12 plotted against differences in total protein abundance values. Quantile median values are indicated on the X-axis. Proteins that aggregated less in the mutant strains than in the WT have been grouped separately (91 proteins in daf-2 and 259 in hsf-1 mutant). (D–F) Physico-chemical properties of proteins enriched in the insoluble fractions of daf-2 and hsf-1 mutant relative to WT animals at day 12. (D), Aggregation propensity scores (Z-scores, see Extended Experimental Procedures). ***, p-value <1.4 · 10−4; *, p-value < 0.016, Wilcoxon rank sum test. (E), Net charge. ****, p-value <4.9 · 10−11; (F), Coil content. ***, p-value <1.1 · 10−4. (G), Overall hydrophobicity ****, p-value <2.9 · 10−7. Quantile median values are indicated on both axes and standard errors are reported on the y-axis.
Figure 6
Figure 6. Aggregation of small HSPs and Proteasome in Lifespan Mutant Worms
(A) Abundance of small HSPs in the insoluble fraction of daf-2, daf-16 and hsf-1 mutant relative to WT animals as determined by summed absolute LFQ values. 6–11 different small HSPs were quantified. **, p-value <0.0075 (WT vs. daf-2) and <0.0022 (WT vs. hsf-1) from Welch’s t-tests. (B) Abundance of 26S proteasome subunits in the insoluble fraction of daf-2, daf-16 and hsf-1 mutant relative to WT animals. 19–27 subunits were quantified. ***, p-value <2.1 · 10−4 (WT vs. daf-2) and <4.6 · 10−4 (WT vs. hsf-1) from Welch’s t-tests. (C) Enrichment of the small HSPs HSP-16.1, HSP-16.48, SIP-1, HSP-17 and Q9N350 in the insoluble fractions of day 12 WT (black circles), daf-2 mutant worms (red circles) and hsf-1 mutant worms (purple circles). Data from 2 to 4 independent experiments are shown. (D and E) Formation of HSP-16.1 inclusions in muscle cells. (D) Representative fluorescence images of muscle cells of WT and daf-2 mutant animals expressing HSP-16.1::GFP (top). Actin was stained with rhodamine-phalloidin (bottom). Scale bar, 10μm. (E) Animals with HSP-16.1::GFP inclusions in muscle cells were quantified (20 animals per group). Averages ± SD are given in % of total. *, p-value < 0.01 from Welch’s t-test.
Figure 7
Figure 7. Proteome Maintenance During Aging in C. elegans
(A) The proteome of young adult WT worms is maintained in balance by the proteostasis system. Aberrant protein species, including metastable conformers and soluble aggregates (red) are efficiently cleared. (B) In aged WT animals, numerous proteins increase in abundance and normal protein stoichiometries are lost, due in part to a relief of miRNA-mediated translational repression. The amount of aggregation-prone species exceeds clearance capacity and insoluble aggregates associated with small HSPs accumulate. Mechanisms of protective aggregate formation are partially activated. Proteostasis is strongly reduced. (C) Proteostasis collapse is delayed in aged daf-2 mutant worms. Proteome imbalance and the soluble aggregate pool is reduced relative to age-matched WT animals, as clearance by protein degradation may be more effective and protective aggregate formation is fully activated. (D) Protein aggregate loads increase proportionally to protein abundance. Although abundant proteins have lower aggregation propensities, they contribute more to aggregate load (see Figure 4). The age-dependent increase in expression level affects the subproteome of supersaturated proteins, which fail to maintain solubility as their levels increase and proteostasis capacity declines.

References

    1. Andersson V, Hanzen S, Liu B, Molin M, Nystrom T. Enhancing protein disaggregation restores proteasome activity in aged cells. Aging. 2013;5:802–812. - PMC - PubMed
    1. Arrasate M, Mitra S, Schweitzer ES, Segal MR, Finkbeiner S. Inclusion body formation reduces levels of mutant huntingtin and the risk of neuronal death. Nature. 2004;431:805–810. - PubMed
    1. Balch WE, Morimoto RI, Dillin A, Kelly JW. Adapting proteostasis for disease intervention. Science. 2008;319:916–919. - PubMed
    1. Ben-Zvi A, Miller EA, Morimoto RI. Collapse of proteostasis represents an early molecular event in Caenorhabditis elegans aging. Proc Natl Acad Sci USA. 2009;106:14914–14919. - PMC - PubMed
    1. Bensimon A, Heck AJ, Aebersold R. Mass spectrometry-based proteomics and network biology. Annu Rev Biochem. 2012;81:379–405. - PubMed

Publication types

MeSH terms