. 2015 May 10:15:391.
doi: 10.1186/s12885-015-1408-5.

NBPF1, a tumor suppressor candidate in neuroblastoma, exerts growth inhibitory effects by inducing a G1 cell cycle arrest

Affiliations

NBPF1, a tumor suppressor candidate in neuroblastoma, exerts growth inhibitory effects by inducing a G1 cell cycle arrest

Vanessa Andries et al. BMC Cancer. .

Abstract

Background: NBPF1 (Neuroblastoma Breakpoint Family, member 1) was originally identified in a neuroblastoma patient on the basis of its disruption by a chromosomal translocation t(1;17)(p36.2;q11.2). Considering this genetic defect and the frequent genomic alterations of the NBPF1 locus in several cancer types, we hypothesized that NBPF1 is a tumor suppressor. Decreased expression of NBPF1 in neuroblastoma cell lines with loss of 1p36 heterozygosity and the marked decrease of anchorage-independent clonal growth of DLD1 colorectal carcinoma cells with induced NBPF1 expression further suggest that NBPF1 functions as tumor suppressor. However, little is known about the mechanisms involved.

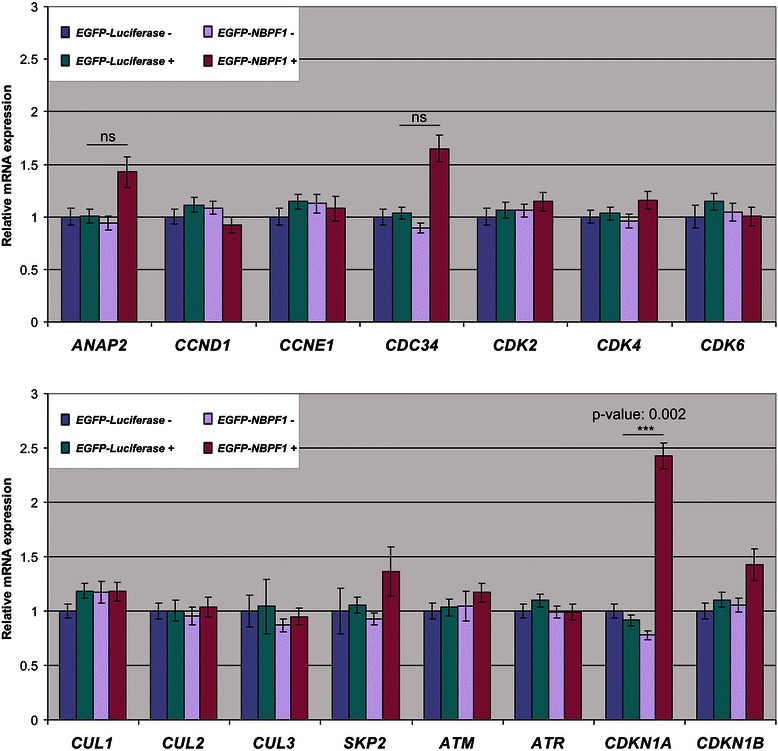
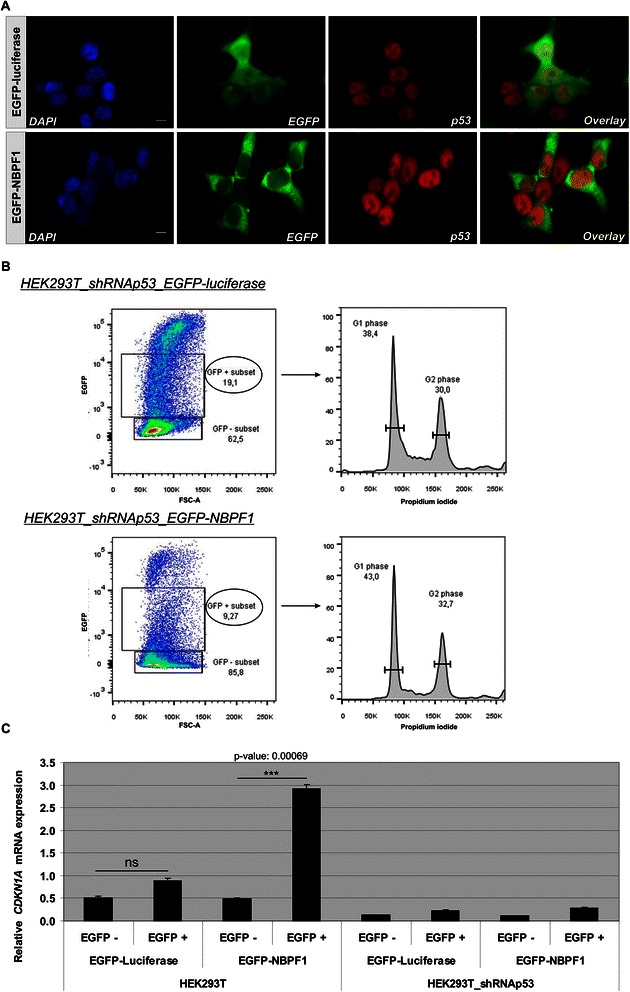
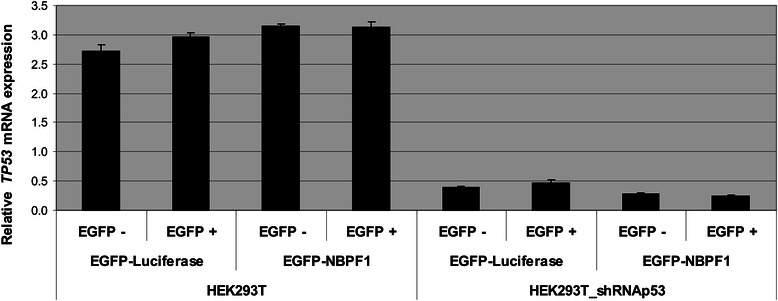
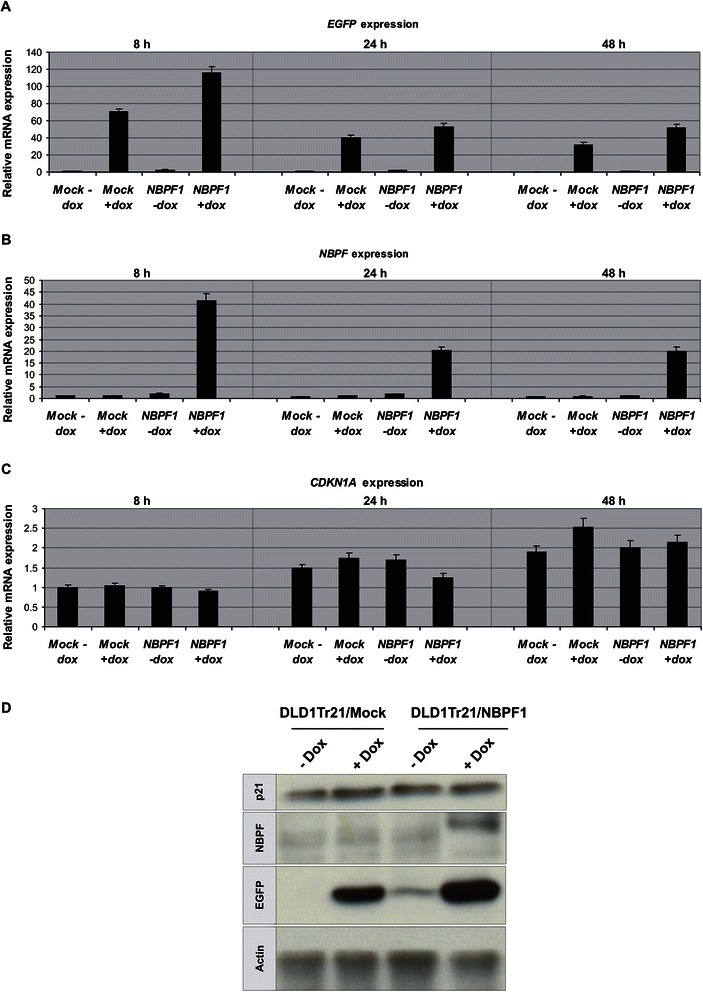
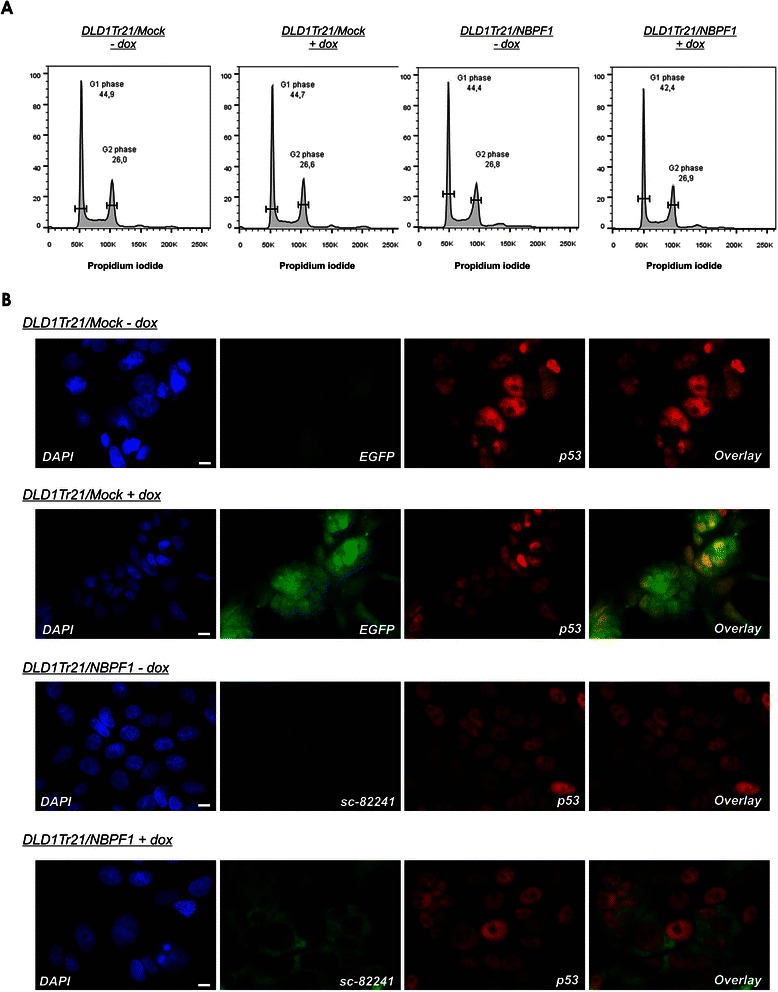
Methods: Expression of NBPF was analyzed in human skin and human cervix by immunohistochemistry. The effects of NBPF1 on the cell cycle were evaluated by flow cytometry. We investigated by real-time quantitative RT-PCR the expression profile of a panel of genes important in cell cycle regulation. Protein levels of CDKN1A-encoded p21(CIP1/WAF1) were determined by western blotting and the importance of p53 was shown by immunofluorescence and by a loss-of-function approach. LC-MS/MS analysis was used to investigate the proteome of DLD1 colon cancer cells with induced NBPF1 expression. Possible biological interactions between the differentially regulated proteins were investigated with the Ingenuity Pathway Analysis tool.

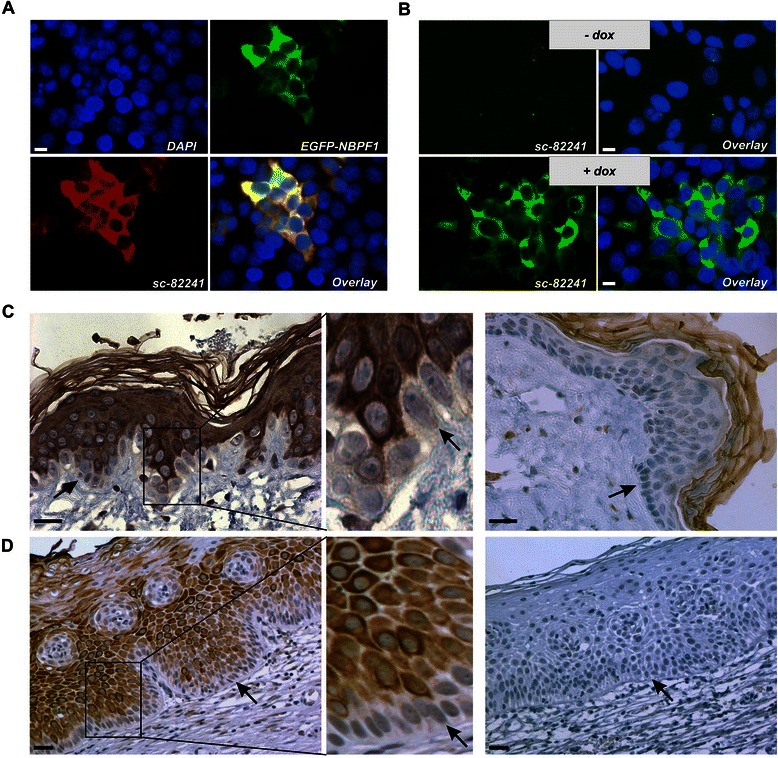
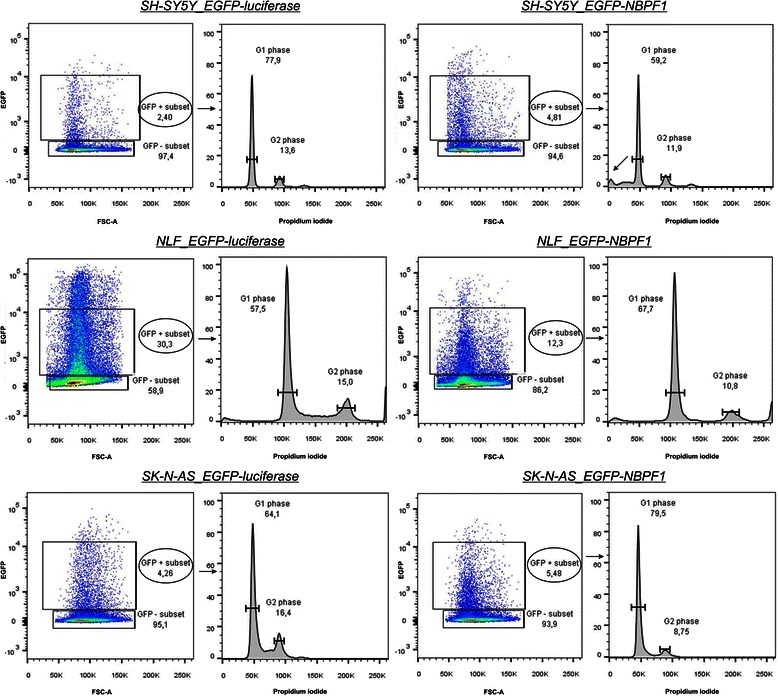
Results: We show that NBPF is expressed in the non-proliferative suprabasal layers of squamous stratified epithelia of human skin and cervix. Forced expression of NBPF1 in HEK293T cells resulted in a G1 cell cycle arrest that was accompanied by upregulation of the cyclin-dependent kinase inhibitor p21(CIP1/WAF1) in a p53-dependent manner. Additionally, forced expression of NBPF1 in two p53-mutant neuroblastoma cell lines also resulted in a G1 cell cycle arrest and CDKN1A upregulation. However, CDKN1A upregulation by NBPF1 was not observed in the DLD1 cells, which demonstrates that NBPF1 exerts cell-specific effects. In addition, proteome analysis of NBPF1-overexpressing DLD1 cells identified 32 differentially expressed proteins, of which several are implicated in carcinogenesis.

Conclusions: We demonstrated that NBPF1 exerts different tumor suppressive effects, depending on the cell line analyzed, and provide new clues into the molecular mechanism of the enigmatic NBPF proteins.


Figures

Fig. 1
Fig. 1
Polyclonal antibody sc-82241 recognizes NBPF proteins specifically and detects NBPF expression in suprabasal layers of normal human skin and cervix. (A) Upon overexpression of NBPF1, fused to EGFP, in HEK293T cells, a clear overlap is detected between the EGFP signal and the signal of the anti-NBPF antibody sc-82241. Nuclei were stained with DAPI. Scale bar: 10 μm. (B) The anti-NBPF antibody yields a specific cytoplasmic staining in DLD1Tr21/NBPF1 cells when NBPF1 expression is induced in the presence of dox. Scale bar: 10 μm. (C) Paraffin sections from human (left panel) and mouse skin (right panel) were stained with anti-NBPF antibody sc-82241. In the human epidermis, staining for NBPF is observed only in the non-proliferating, differentiated cells of the suprabasal layer and not in the proliferating basal cell layer (arrows). The middle panel shows a magnification of the boxed area. Mouse skin served as a negative control: no staining is seen in any of the living layers of the epidermis. The cornified envelope of the epidermis shows aspecific staining, since the signal is obtained in both mouse and human samples. Scale bars: 25 μm. (D) Normal human cervix stained with anti-NBPF antibody sc-82241 shows strong immunopositivity of the suprabasal layer. The middle panel shows a magnification of the boxed area. In the negative control (right panel), the primary antibody was omitted. Arrows point to basal cell layers. Scale bars: 25 μm
Fig. 2
Fig. 2
Time-lapse microscopy of NBPF1 expression in transfected HEK293T cells. Expression of EGFP-luciferase or EGFP-NBPF1 was followed for 15 h with images captured every 10 min. Individual frames are shown. Original movies are available as Additional files 1 and 2. Fluorescence levels are represented by pseudocolors, where blue indicates low EGFP levels and yellow indicates high EGFP levels (ImageJ LUT; color codes shown at the bottom). (A) Expression of EGFP-luciferase in cells remained at a constant level at all the indicated time points and did not interfere with cell division or induce cell death. The arrow points to an EGFP-positive mitotically dividing cell. (B) Expression of EGFP-NBPF1 in cells fluctuated, with some cells showing decreasing levels and others showing delayed expression. In no case were EGFP-NPBP1 expressing mitotic cells observed
Fig. 3
Fig. 3
Time-lapse microscopy of NBPF1 expression in transfected HEK293T cells stimulated with aphidicolin. EGFP-luciferase or EGFP-NBPF1 expression was followed for 15 h with images captured every 10 min. Individual frames are shown. Original movies are available as Additional files 3 and 4. Fluorescence levels are represented by pseudocolors, with blue indicating low EGFP levels and yellow indicating high EGFP levels (ImageJ LUT; color codes shown at the bottom). (A) Expression of EGFP-luciferase in cells stimulated with aphidicolin remained at a constant level at all the indicated time points. (B) Expression of EGFP-NBPF1 in cells stimulated with aphidicolin showed increased accumulation in the form of particulate or aggregated structures. In no case were cells with decreasing levels of EGFP-NBPF1 observed
Fig. 4
Fig. 4
NBPF1 inhibits cell cycle progression in transfected HEK293T cells. HEK293T cells were transfected with plasmids encoding either EGFP-luciferase (negative control) or EGFP-NBPF1. Cell cycle profiles were determined 48 h after transfection by flow cytometry on the effectively transfected (EGFP-positive) cell subpopulations. Transfection efficiency is represented as percentages in the left panels. The different cell cycle phases are shown only for the effectively transfected (EGFP-positive) subpopulations (right panels). Cells in G1 phase (2n DNA content) and cells in G2 phase (4n DNA content) are annotated on the histograms and calculated as percentage of the whole population
Fig. 5
Fig. 5
EGFP-luciferase and EGFP-NBPF1 expression in the cell lines used for flow cytometry in this study. Different cell lines (HEK293T, HEK293T_shRNAp53, SH-SY5Y, NLF and SK-N-AS) were transfected with plasmids expressing either EGFP-luciferase or EGFP-NBPF1 in order to investigate cell cycle distribution. As a control for efficient transfection and expression of EGFP-luciferase or EGFP-NBPF1, we took a fraction of the cells and prepared equal amounts of total cellular lysates for SDS-PAGE. These lysates were immunoblotted with an anti-NBPF antibody (sc-82241) to detect overexpressed NBPF1 protein, with an anti-EGFP antibody to detect the fusion proteins EGFP-luciferase (indicated by *) and EGFP-NBPF1 (indicated by **), or with an anti-actin antibody, which served as a loading control. All cell lines transfected for flow cytometry analysis showed effective expression of EGFP-luciferase or EGFP-NBPF1 proteins
Fig. 6
Fig. 6
NBPF1 overexpression increases CDKN1A transcript levels. HEK293T cells were transfected with plasmids encoding either EGFP-luciferase or EGFP-NBPF1. Both EGFP-positive (+) and EGFP-negative populations (−) were isolated by FACS, and the expression levels of important cell cycle related genes were determined by real-time qRT-PCR. The values of EGFP-luciferase negative cells were set to 1. p-values were calculated with one-way ANOVA; ns: not significant
Fig. 7
Fig. 7
NBPF1 overexpression increases p21CIP1/WAF1 protein levels. (A) HEK293T cells were transfected with plasmids encoding either EGFP-luciferase or EGFP-NBPF1. Both EGFP-positive (+) and EGFP-negative populations (−) were isolated by FACS, and the protein levels of p21CIP1/WAF1 were detected by western blotting (top row). Treatment of cells with doxorubicin (+ Doxo) served as a positive control for p21 induction. Detection with the anti-NBPF antibody (sc-82241) showed the successful isolation of EGFP-NBPF1 transfected cells (second row). Detection with an anti-EGFP antibody (third row) showed successful isolation of transfected cells that were EGFP-luciferase positive (indicated by *) or EGFP-NBPF1 positive (indicated by **). Vinculin expression acted as a loading control (bottom row). (B) Quantification of p21CIP1/WAF1 signals in the blot of (A), normalized against vinculin signals. In addition to the positive control (+ Doxo), only cells expressing EGFP-NBPF1 showed clear induction of p21. p-values were calculated with one-way ANOVA
Fig. 8
Fig. 8
NBPF1 overexpression induces nuclear accumulation of p53 as well as p53-dependent cell cycle arrest and CDKN1A induction. (A) HEK293T cells were transfected with a plasmid encoding either EGFP-luciferase (top panels) or EGFP-NBPF1 (lower panels). Immunofluorescence at 48 h after transfection for p53 revealed an increased accumulation in the nucleus upon EGFP-NBPF1 transfection. Nuclei were counterstained with DAPI. Scale bars: 10 μm. (B) HEK293T_shRNAp53 cells were transfected with plasmids encoding either EGFP-luciferase or EGFP-NBPF1. Cell cycle profiles were determined 48 h after transfection by flow cytometry on the effectively transfected (EGFP-positive) cell subpopulations. Transfection efficiency is represented as percentage in the left panels. The different cell cycle phases are shown only for the effectively transfected (EGFP-positive) subpopulations (right panels). Cells in G1 phase (2n DNA content) and cells in G2 phase (4n content) are annotated on the histograms and calculated as percentage of the whole population. NBPF1 overexpression does not induce G1 cell cycle arrest in HEK293T cells with stable knockdown of p53. (C) HEK293T and HEK293T_shRNAp53 cells were transfected with plasmids encoding either EGFP-luciferase or EGFP-NBPF1. Both EGFP-positive (+) and EGFP-negative populations (−) were isolated by FACS, and the expression levels of CDKN1A transcripts were determined by real-time qRT-PCR. EGFP-NBPF1 expression induced CDKN1A transcripts only in HEK293T cells. p-values were calculated with one-way ANOVA; ns: not significant
Fig. 9
Fig. 9
NBPF1 overexpression has no effect on the mRNA levels of the TP53 gene. HEK293T and HEK293_shRNAp53 cells were transfected with plasmids encoding either EGFP-luciferase or EGFP-NBPF1. Both EGFP-positive (+) and EGFP-negative populations (−) were isolated by FACS and the expression levels of TP53 were determined by real-time quantitative RT-PCR
Fig. 10
Fig. 10
NBPF1 induces cell death in an NB cell line with wild-type p53 and inhibits cell cycle progression in NB cell lines with mutated p53. Three different NB cell lines were transfected with plasmids encoding either EGFP-luciferase (left panels) or EGFP-NBPF1 (right panels) and cell cycle profiles were analyzed 48 h post-transfection. Transfection efficiency is represented as percentage in the left panels. The different cell cycle phases are shown only for the effectively transfected (EGFP-positive) subpopulations (right panels). Cells in G1 phase (2n DNA content) and cells in G2 phase (4n content) are annotated on the histograms and calculated as percentage of the whole population. Overexpression of NBPF1 in SH-SY5Y cells, bearing a wild-type TP53 gene, does not result in G1 cell cycle arrest, but induces cell death (sub-G1 peak, indicated by arrow) (top panel). Overexpression of NBPF1 in two NB cell lines, NLF (middle panel) and SK-N-AS (bottom panel), with mutated p53 induces G1 cell cycle arrest
Fig. 11
Fig. 11
NBPF1 overexpression increases p21CIP1/WAF1 protein levels in NB cell lines with mutant p53. (A) SH-SY5Y, NLF and SK-N-AS cells were transfected with plasmids encoding either EGFP-luciferase or EGFP-NBPF1. Both EGFP-positive (+) and EGFP-negative populations (−) were isolated by FACS, and the protein levels of p21CIP1/WAF1 were detected by western blotting (top row). Treatment of HEK293T cells with doxorubicin (+ Doxo) served as a positive control for p21 induction. Detection with the anti-NBPF antibody (sc-82241) showed successful isolation of EGFP-NBPF1 transfected cells (second row). Detection with an anti-EGFP antibody (third row) showed successful isolation of transfected cells that were EGFP-luciferase positive (indicated by *) or EGFP-NBPF1 positive (indicated by **). Actin expression acted as a loading control (bottom row). (B) Quantification of p21CIP1/WAF1 signals in the blot of (A), normalized against actin signals. In addition to the positive control (HEK293T + Doxo), only NB cells with mutant p53 expressing EGFP-NBPF1 showed clear induction of p21. p-values were calculated with one-way ANOVA
Fig. 12
Fig. 12
NBPF1 overexpression induces no nuclear accumulation of p53 in NB cell lines. SH-SY5Y, NLF and SK-N-AS cells were transfected with a plasmid encoding either EGFP-luciferase (top panel) or EGFP-NBPF1 (lower panel). Immunofluorescence for p53 revealed no increased accumulation in the nucleus upon EGFP-NBPF1 transfection in either cell line. EGFP-luciferase transfected cells were stained with an anti-EGFP antibody, whereas EGFP-NBPF1 transfected cells were stained with the anti-NBPF antibody sc-82241, both represented in green. Nuclei were counterstained with DAPI. Scale bars: 10 μm
Fig. 13
Fig. 13
CDKN1A expression is not induced upon NBPF1 expression in DLD1Tr21/NBPF1 cells. Expression analysis of selected genes and proteins was executed in DLD1Tr21/Mock and DLD1Tr21/NBPF1 cells, with or without dox treatment. Real-time quantitative RT-PCR measurements are shown for the expression levels of the IRES-driven marker gene EGFP (A), NBPF1 (B) and CDKN1A (C). Cells analyzed were kept untreated (− dox) or were dox treated for 8, 24 or 48 h in order to induce NBPF1 expression. CDKN1A mRNA induction upon NBPF1 expression was not observed in the dox-induced DLD1Tr21/NBPF1 cells. (D) Western blot was performed with lysates of dox-treated and non-treated DLD1Tr21/Mock and DLD1Tr21/NBPF1 cells. Cells were induced for 48 h and immunoblotted with an anti-p21 antibody. p21 protein induction was not observed in dox-induced DLD1Tr21/NBPF1 cells. EGFP detection showed efficient dox-dependent induction in both cell lines. Actin detection was used as a loading control
Fig. 14
Fig. 14
Induced expression of NBPF1 in DLD1Tr21 cells does not result in a G1 cell cycle arrest or nuclear accumulation of p53. (A) Cell cycle distribution of DLD1Tr21/Mock and DLD1Tr21/NBPF1 cells in the absence or presence of dox (48 h) shows no G1 arrest upon NBPF1 expression. (B) Immunofluorescence for p53 revealed no increased accumulation in the nucleus upon NBPF1 expression. Expression of EGFP or NBPF1 (using antibody sc-82241) is induced upon treatment of the cells with dox for 48 h. Nuclei were visualized with DAPI. Scale bars: 10 μm
Fig. 15
Fig. 15
Immunofluorescent analysis of the DLD1Tr21/Mock and DLD1Tr21/NBPF1 cell cultures used for proteomic analysis. Cell cultures were grown for 4 days in standard medium supplemented with dox. The induced DLD1Tr21/Mock cells were post-metabolically labeled with light 12C6-NHS-propionate, and the induced DLD1Tr21/NBPF1 cells were post-metabolically labeled with heavy 13C6-NHS-propionate, and then submitted to proteomic analysis as described in Methods. As a control for proper NBPF1 induction, replicate cell cultures were stained for induction of EGFP and NBPF1 expression by immunofluorescent microscopy. Expression of EGFP (shown in green) is induced in both cell lines upon the addition of dox (untreated cultures were fully negative). NBPF1 (antibody sc82241; red channel) was expressed only in DLD1Tr21/NBPF1 cells and only in the presence of dox. Nuclei were visualized with DAPI. Scale bars: 10 μm
Fig. 16
Fig. 16
Summary of Ingenuity Pathway Analysis (IPA). The dataset representing the 32 genes with significantly altered expression upon NBPF1 induction in DLD1Tr21 cells was imported into the IPA tool. (A) The top two networks obtained from the IPA analysis and their scores. (B) Network presentation of the most highly rated network. Solid lines represent a direct interaction between two gene products and dotted lines represent indirect interactions. Red symbols indicate input molecules that are downregulated upon NBPF1 expression, and green symbols represent input molecules that are upregulated upon NBPF1 expression

References

    1. Laureys G, Speleman F, Opdenakker G, Benoit Y, Leroy J. Constitutional translocation t(1;17)(p36;q12-21) in a patient with neuroblastoma. Genes Chromosomes Cancer. 1990;2:252–4. doi: 10.1002/gcc.2870020315. - DOI - PubMed
    1. Laureys G, Speleman F, Versteeg R, van der Drift P, Chan A, Leroy J, et al. Constitutional translocation t(1;17)(p36.31-p36.13;q11.2-q12.1) in a neuroblastoma patient. Establishment of somatic cell hybrids and identification of PND/A12M2 on chromosome 1 and NF1/SCYA7 on chromosome 17 as breakpoint flanking single copy markers. Oncogene. 1995;10:1087–93. - PubMed
    1. Vandepoele K, Andries V, Van Roy N, Staes K, Vandesompele J, Laureys G, et al. A constitutional translocation t(1;17)(p36.2;q11.2) in a neuroblastoma patient disrupts the human NBPF1 and ACCN1 genes (p. 1–12) PLoS One. 2008;3 doi: 10.1371/journal.pone.0002207. - DOI - PMC - PubMed
    1. Vandepoele K, Van Roy N, Staes K, Speleman F, van Roy F. A novel gene family NBPF: Intricate structure generated by gene duplications during primate evolution. Mol Biol Evol. 2005;22:2265–74. doi: 10.1093/molbev/msi222. - DOI - PubMed
    1. Popesco MC, Maclaren EJ, Hopkins J, Dumas L, Cox M, Meltesen L, et al. Human lineage-specific amplification, selection, and neuronal expression of DUF1220 domains. Science. 2006;313:1304–7. doi: 10.1126/science.1127980. - DOI - PubMed

Publication types

MeSH terms