. 2015 May 11:6:6931.
doi: 10.1038/ncomms7931.

Macrophages monitor tissue osmolarity and induce inflammatory response through NLRP3 and NLRC4 inflammasome activation

Affiliations

Macrophages monitor tissue osmolarity and induce inflammatory response through NLRP3 and NLRC4 inflammasome activation

W K Eddie Ip et al. Nat Commun. .

Abstract

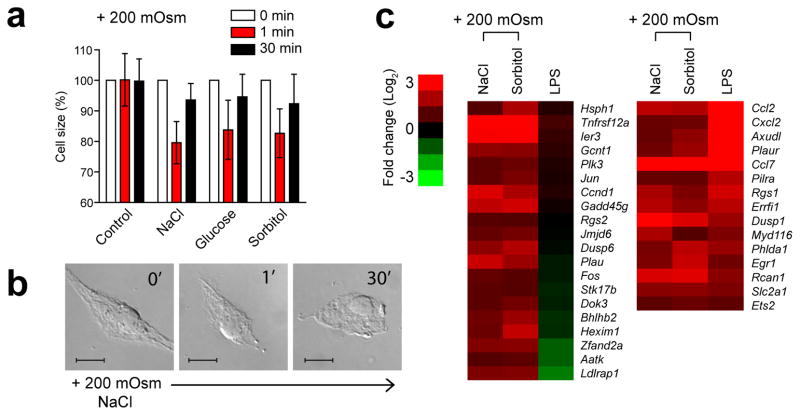
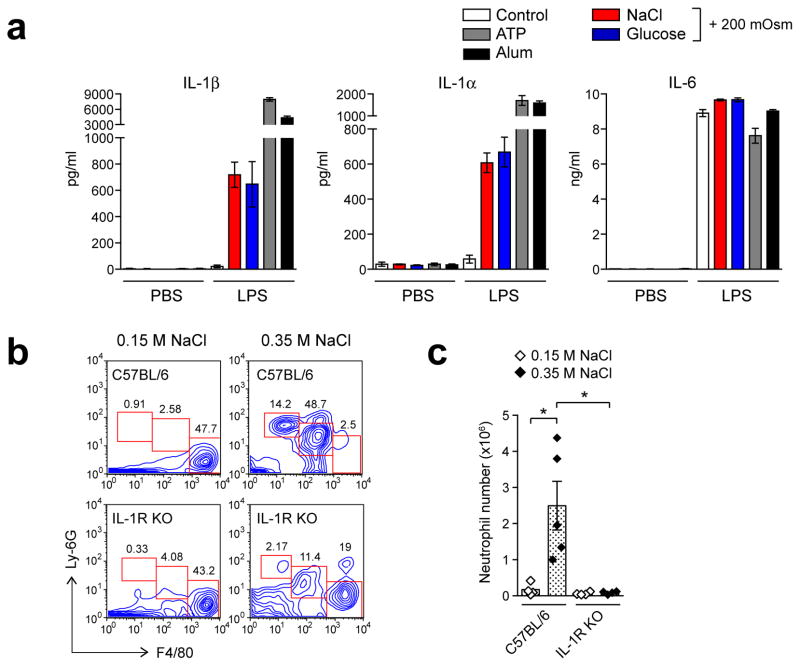
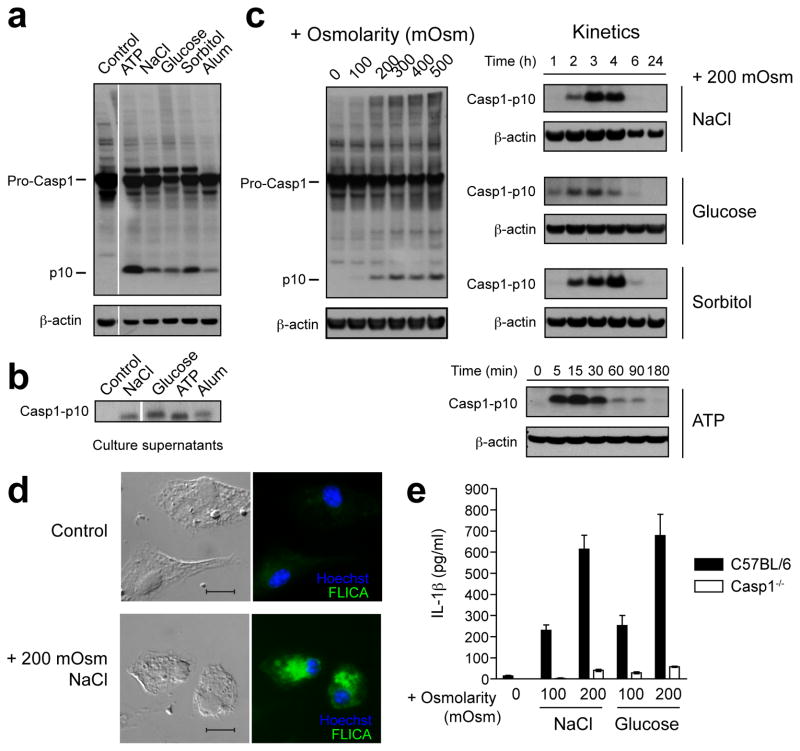
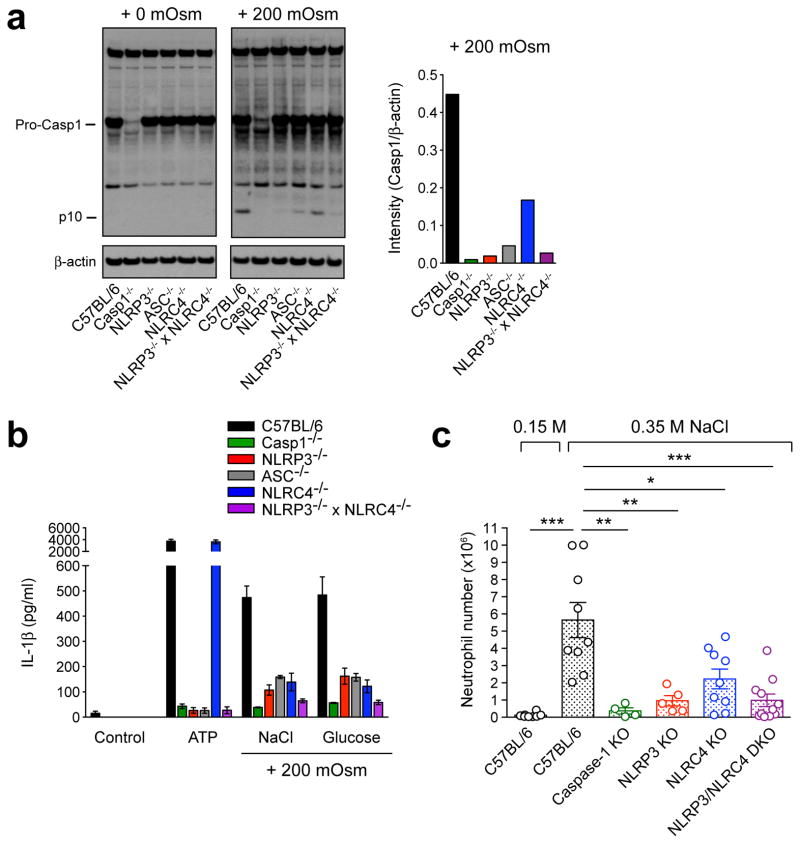
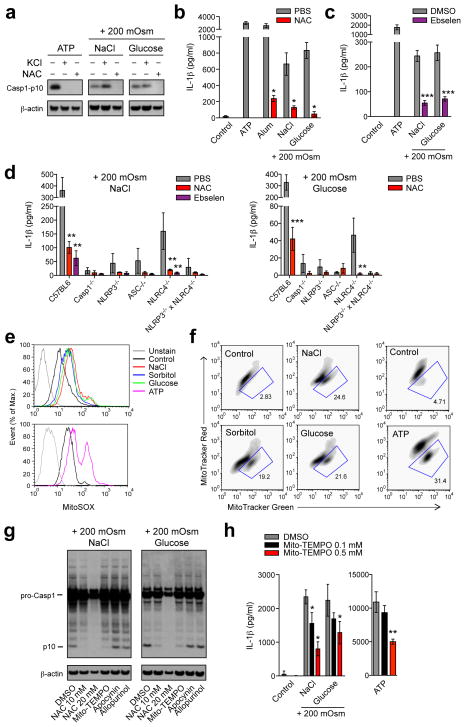
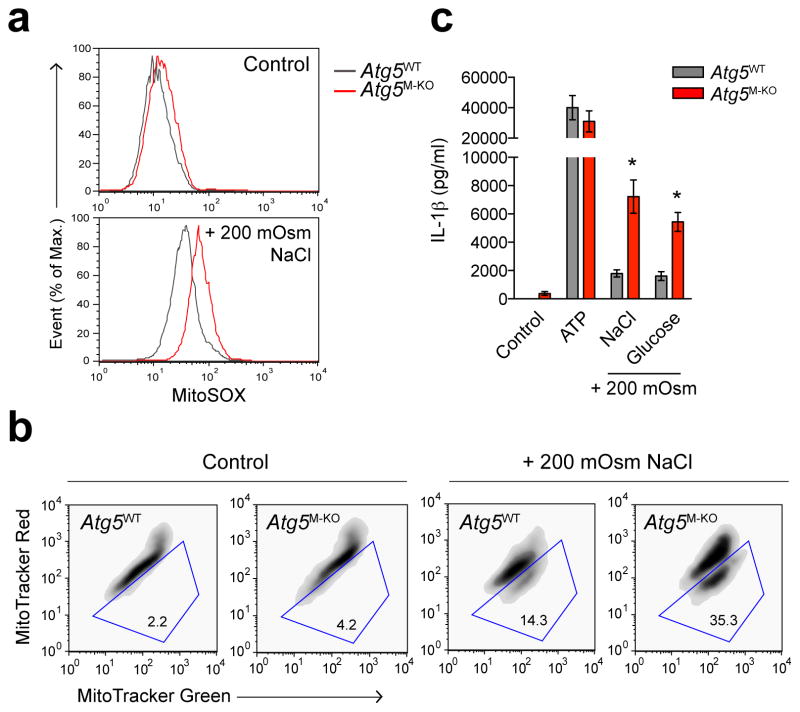
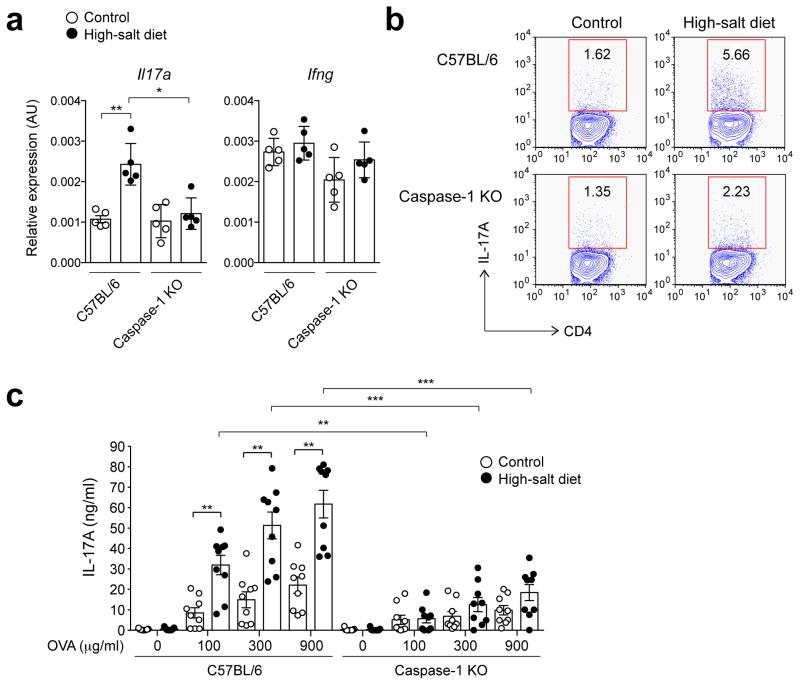
Interstitial osmolality is a key homeostatic variable that varies depending on the tissue microenvironment. Mammalian cells have effective mechanisms to cope with osmotic stress by engaging various adaptation responses. Hyperosmolality due to high dietary salt intake has been linked to pathological inflammatory conditions. Little is known about the mechanisms of sensing the hyperosmotic stress by the innate immune system. Here we report that caspase-1 is activated in macrophages under hypertonic conditions. Mice with high dietary salt intake display enhanced induction of Th17 response upon immunization, and this effect is abolished in caspase-1-deficient mice. Our findings identify an unknown function of the inflammasome as a sensor of hyperosmotic stress, which is crucial for the induction of inflammatory Th17 response.


Figures

Figure 1
Figure 1
Hyperosmotic stress induces adaptation response in macrophages. (a, b) BMDMs were maintained in isotonic conditions (controls) or switched to hypertonic conditions (+ 200 mOsm) by adding NaCl, glucose, or sorbitol. Cell size was measured by using a Coulter counter (a) or observed by microscopy (b) at the indicated times. (c) Heat map displaying microarray data, fold change of selected gene subset in BMDMs incubated in hypertonic conditions (NaCl or sorbitol) or stimulated with LPS for 3 h. Only genes with a significant fold change are presented. Data in a, b are representative of two independent experiments. Data in a are the mean ± s.d. of 1 × 10³ cells counted. Scale bar, 10 μm.
Figure 2
Figure 2
Hyperosmotic stress induces IL-1β secretion in macrophages (a) BMDMs primed without (PBS) or with LPS were incubated overnight in isotonic conditions (control) or hyperosmotic conditions (+ 200 mOsm) by adding NaCl, glucose, or sorbitol, or stimulated with ATP (5 mM) or alum (250 μg/ml) for 2 h or 6 h respectively. IL-1β, IL-1α and IL-6 in media supernatants were measured by ELISA. (b, c) Wild-type (C57BL/6) or IL-1R-deficient mice (IL-1R KO) were injected peritoneally with 0.15 M (“isotonic”) or 0.35 M (“hypertonic”) of NaCl (each group, n = 4). Peritoneal lavage cells were analyzed for neutrophils after 16 h. Contour plots of FACS analysis show the percentages of neutrophils (Ly-6G+, F4/80 negative), inflammatory monocytes (Ly-6G+, F4/80+low), and resident macrophages (Ly-6G negative, F4/80+high) cells (b). Neutrophil numbers were determined by using cell-counting beads as described in the Methods (c). Data are representative of three (a, b) independent experiments. Data indicate mean ± s.d. of quadruplicates (a), or for pooled groups of mice from three experiments (c). Student’s t test: *, P ≤ 0.05.
Figure 3
Figure 3
Hyperosmotic stress induces caspase-1 activation and caspase-1-dependent IL-1β secretion. (ad) BMDMs primed with LPS were maintained in isotonic conditions (control) or switched to hyperosmotic conditions (+ 200 mOsm (a, b) or as indicated (c, d)) by adding NaCl, glucose, or sorbitol for 3 h (a, c, d), overnight (b), or for the indicated times (c). LPS-primed BMDM stimulated with ATP (5 mM) for 30 min (a), 2 h (b), or the indicated times (c), or with alum (250 μg/ml) for 4 h (a) or 6 h (b), were used as positive controls. The cleavage of caspase-1 to its active p10 subunit in BMDMs was detected by immunoblot analysis in cell lysates (a, c) or in media supernatants (b; see also Supplementary Fig. 2a), or the caspase-1 activation was visualized by incubation with a fluorescent cell-permeable probe that binds only to activated caspase-1 (FLICA)(d). Scale bar, 10 μm. (e) Wild-type (C57BL/6) or caspase-1-deficient (Casp1−/−) BMDMs primed with LPS were incubated overnight in isotonic conditions (+ 0 mOsm) or hypertonic conditions (+ 100 or 200 mOsm). IL-1β in media supernatants was measured by ELISA. Data are representative of three independent experiments. Data in e are the mean ± s.d. of quadruplicates.
Figure 4
Figure 4
Hyperosmotic stress activates NLRP3 and NLRC4 inflammasomes. (a, b) LPS-primed BMDMs generated from wild-type (C57BL/6), Casp1−/−, NLRP3−/−, ASC−/−NLRC4−/−, or NLRP3−/− × NLRC4−/− mice were incubated for 3 h (a) or overnight (b) in isotonic conditions (+ 0 mOsm; control) or hypertonic conditions (+ 200 mOsm) by adding NaCl (a, b) or glucose (b). The cleavage of caspase-1 to its active p10 subunit in BMDMs was detected by immunoblot analysis in cell lysates (a). IL-1β in supernatants was measured by ELISA (b). (c) Wild-type mice (C57BL/6; n = 8) or mice deficient in genes encoding caspase-1 (n = 4), NLRP3 (n = 5), NLRC4 (n = 9), or NLRP3/NLRC4 (double knockout, DKO; n = 11) were injected peritoneally with 0.35 M (“hypertonic”) NaCl, or wild-type mice (C57BL/6; n = 8) with 0.15 M (“isotonic”) NaCl. Peritoneal lavage cells were analyzed for neutrophils after 16 h. Data are representative of three independent experiments (a, b). Data indicate mean ± SD of quadruplicates (b), or mean for pooled groups of mice from two to three experiments (c). Student’s t test: *, P ≤ 0.05, **, P ≤ 0.01, *** P ≤ 0.001.
Figure 5
Figure 5
Hyperosmotic stress activates inflammasomes via mitochondrial ROS. (ad) LPS-primed BMDMs generated from wild-type (C57BL/6) mice only (ac), or also from Casp1−/−, NLRP3−/−, ASC−/−NLRC4−/−, or NLRP3−/− × NLRC4−/− mice (d) were incubated for 3 h (a) or overnight (bd) in isotonic conditions (control) or hypertonic conditions (+ 200 mOsm) by adding NaCl, sorbitol or glucose, or stimulated with ATP (5 mM) for 30 min (a) or 2 h (b, c), or with alum (250 μg/ml) for 4 h (b), in the presence of 100 mM extracellular KCl or after pretreatment with 10 mM N-acetyl-L-cysteine (NAC) or 50 μM ebselen. Cell lysates or media supernatants were analyzed by immunoblotting for cleavage of caspase-1 (a; see also Supplementary Fig. 2b) or ELISA for IL-1β secretion (bd) respectively. (e, f) Primed BMDMs incubated hypertonically or with ATP as in (a) were labeled with MitoSOX (which fluoresces upon oxidation by mitochondria associated ROS) for mitochondrial ROS levels (e) or with MitoTracker Green (which stains the lipid membrane of the mitochondria) and MitoTracker Red (which fluoresces upon oxidation in respiring mitochondria) for dysfunctional mitochondria (f). Density plots (f) of FACS analysis show the percentages of dysfunctional mitochondria (MitoTracker Green+high, MitoTracker Red+low). (g, h) After pretreatment with NAC (10 or 20 mM), Mito-TEMPO (0.1 or 0.5 mM), apocynin (100 μM) or allopurinol (100 μM), primed macrophages were incubated hypertonically as in a for 3 h (g) or overnight (h), or stimulatd with ATP (5 mM) for 2 h (h). Cleavage of caspase-1 (g) or IL-1β secretion (h) was assayed as in a or b respectively. Data are representative of at least three independent experiments. Data indicate mean ± s.d. of quadruplicates. Student’s t test: *, P ≤ 0.05, **, P ≤ 0.01, ***, P ≤ 0.001.
Figure 6
Figure 6
Mitophagy controls hyperosmotic stress-induced inflammasome activation. (ac) LPS-primed BMDMs generated from Atg5flox/flox (Atg5WT) or Atg5flox/floxLysM-Cre (Atg5M-KO) mice were incubated for 3 h (a, b) or overnight (c) in isotonic conditions (control) or hypertonic conditions (+ 200 mOsm) by adding NaCl or glucose, and labeled with MitoSOX (which fluoresces upon oxidation by mitochondria associated ROS) for mitochondrial ROS levels (a) or MitoTracker Green (which stains the lipid membrane of the mitochondria) and MitoTracker Red (which fluoresces upon oxidation in respiring mitochondria) for dysfunctional mitochondria (b) or assayed for IL-1β in media supernatants by ELSIA (c). Density plots of FACS analysis show the percentages of dysfunctional mitochondria (MitoTracker Green+high, MitoTracker Red+low). Data are representative of two independent experiments. Data indicate mean ± s.d. of quadruplicates. Student’s t test: *, P ≤ 0.05.
Figure 7
Figure 7
Inflammasome activation promotes Th17 response in mice on high-salt diet. (ac) Wild-type mice (C57BL/6) or caspase-1-deficient mice (Caspase-1 KO) fed high-salt or control diet (each group, n = 9) were immunized with OVA/LPS for 7 days. Single-cell suspension prepared from draining lymph nodes was analyzed for Il17a and Ifng mRNA expression by qRT-PCR (a) or intracellular IL-17A production in CD4+ T cells by FACS (b), or re-stimulated in vitro with the indicated concentrations of OVA for 2 days and supernatants were analyzed for IL-17A by ELISA (c). Data are mean ± s.d. for pooled group of mice. Contour plots of FACS analysis show the percentages of IL-17-producing CD4+ T cells. Student’s t test: *, P ≤ 0.05, **, P ≤ 0.01, ***, P ≤ 0.001.

References

    1. Burg MB, Ferraris JD, Dmitrieva NI. Cellular response to hyperosmotic stresses. Physiol Rev. 2007;87(4):1441–1474. - PubMed
    1. Majmundar AJ, Wong WJ, Simon MC. Hypoxia-inducible factors and the response to hypoxic stress. Mol Cell. 2010;40(2):294–309. - PMC - PubMed
    1. Anckar J, Sistonen L. Regulation of HSF1 function in the heat stress response: implications in aging and disease. Annu Rev Biochem. 2011;80:1089–1115. - PubMed
    1. Hotamisligil GS. Endoplasmic reticulum stress and the inflammatory basis of metabolic disease. Cell. 2010;140(6):900–917. - PMC - PubMed
    1. Kaser A, Martinez-Naves E, Blumberg RS. Endoplasmic reticulum stress: implications for inflammatory bowel disease pathogenesis. Curr Opin Gastroenterol. 2010;26(4):318–326. - PMC - PubMed

Publication types

MeSH terms