. 2015 May 11:5:10152.
doi: 10.1038/srep10152.

The transgenic cloned pig population with integrated and controllable GH expression that has higher feed efficiency and meat production

Affiliations

The transgenic cloned pig population with integrated and controllable GH expression that has higher feed efficiency and meat production

Huiming Ju et al. Sci Rep. .

Abstract

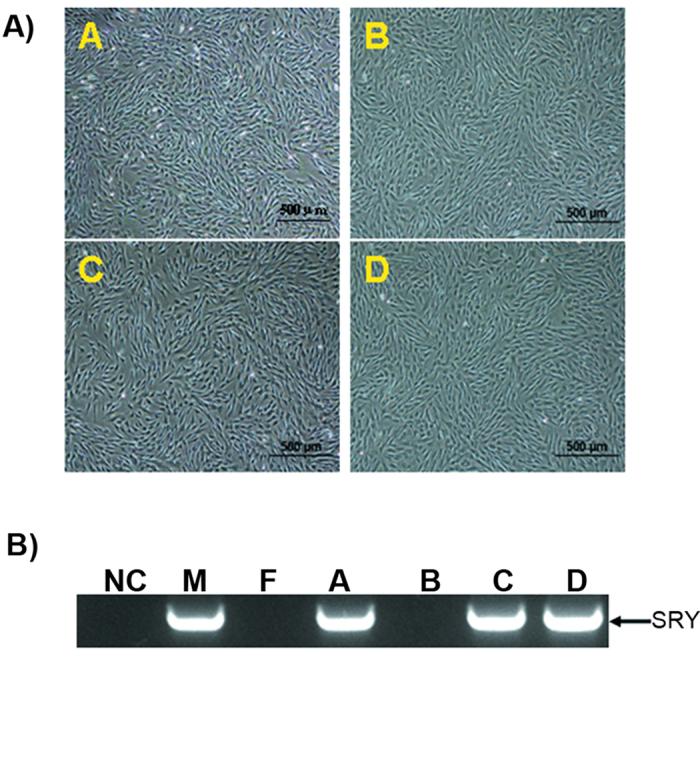
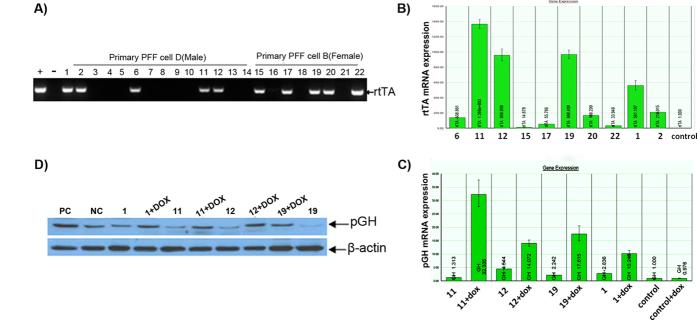
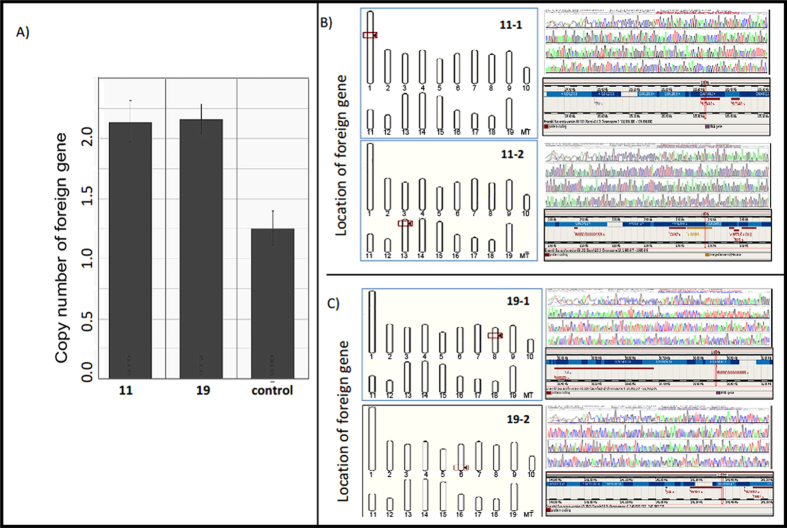
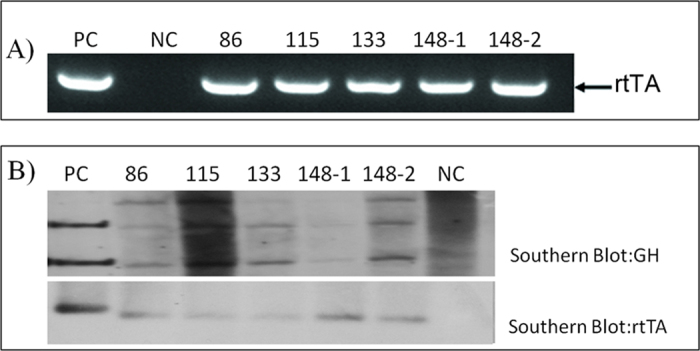
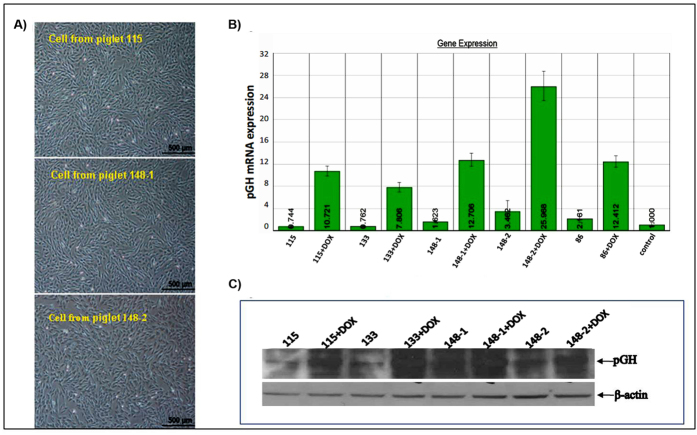
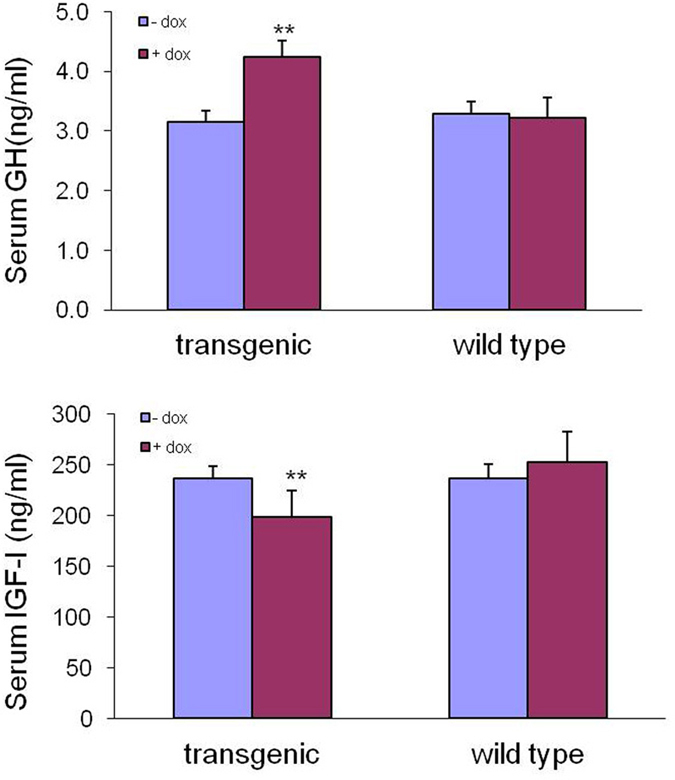
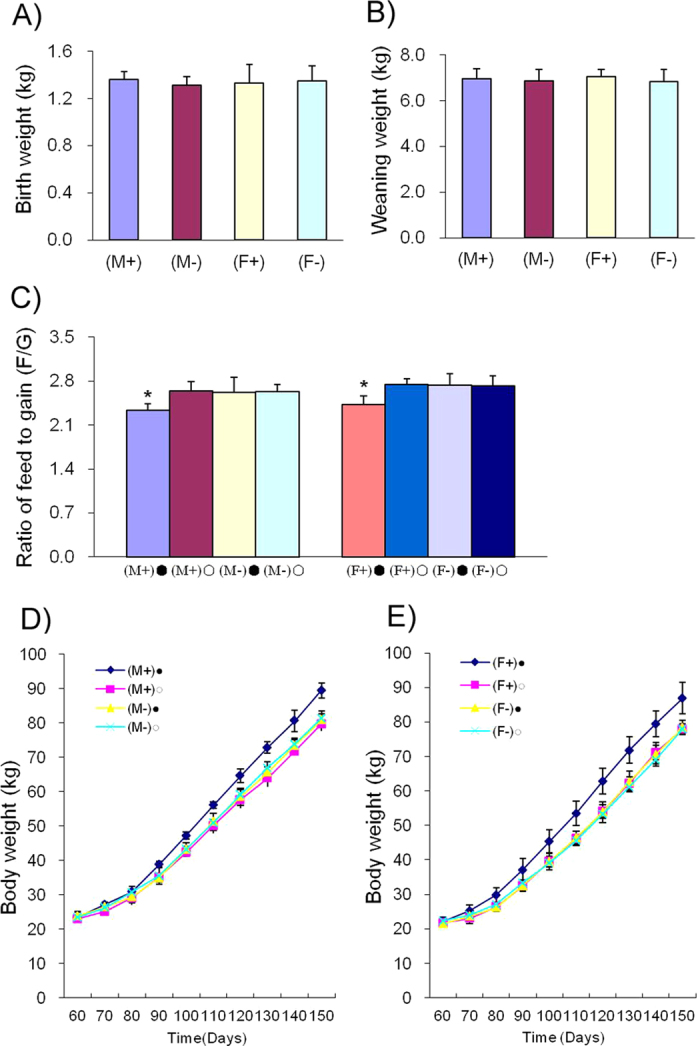
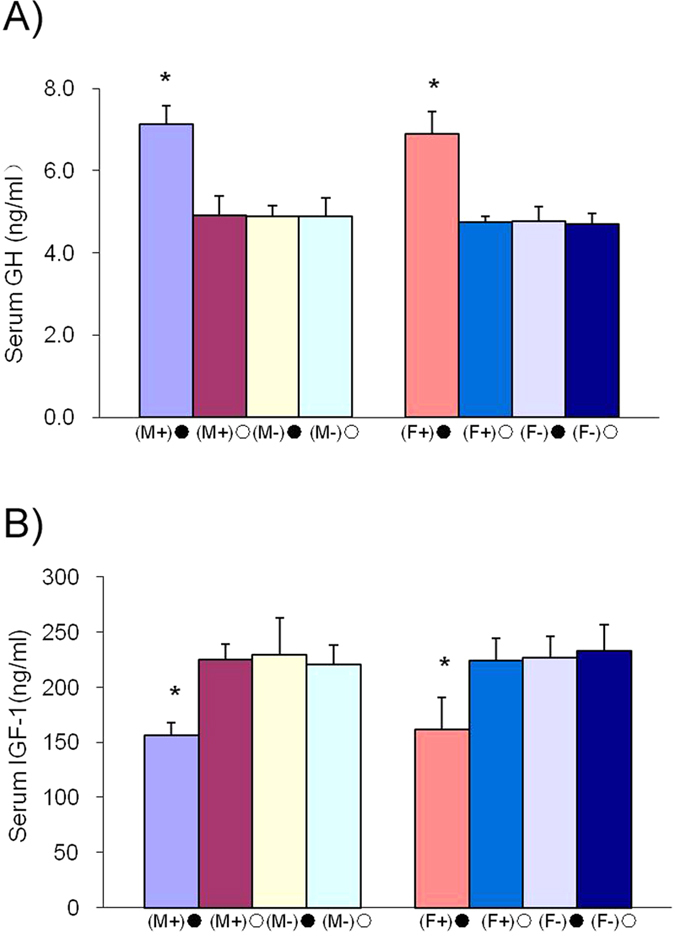
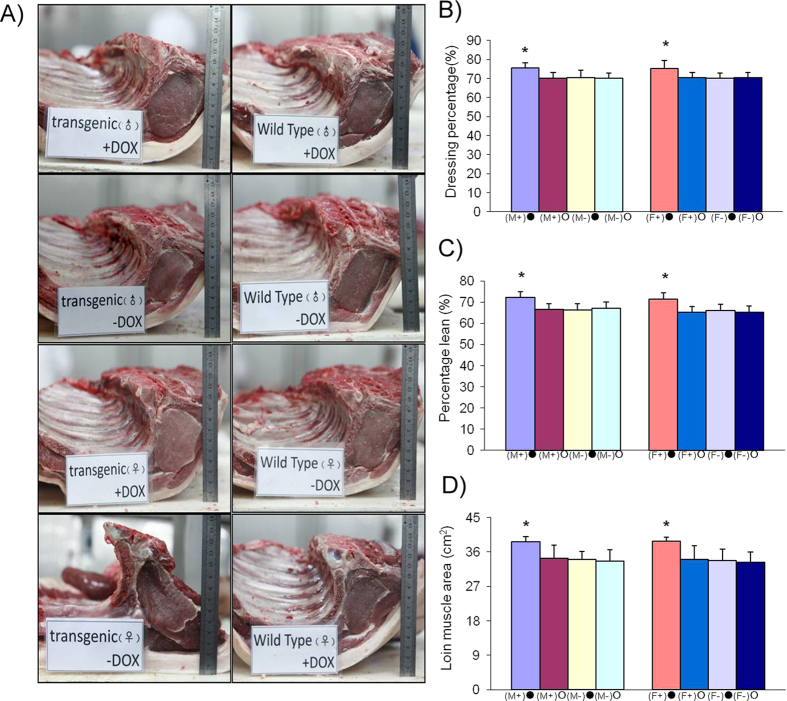
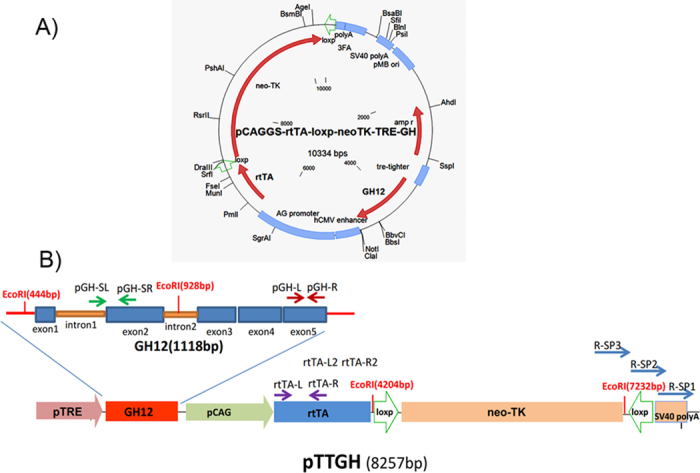
Sustained expression of the GH gene has been shown to have detrimental effects on the health of animals. In the current study, transgenic founder pigs, with controllable pig growth hormone (pGH) expression, were cloned via the handmade cloning method (HMC), and pGH expression levels were examined at the cellular and organismal levels. The serum pGH levels in 3 founder male pigs were found to be significantly higher after induction with intramuscular injection of doxycycline (DOX) compared to baseline. A daily dose of DOX was administered via feed to these animals for a period of 65 to 155 days. The growth rate, feed efficiency and pGH serum concentration increased in the DOX-induced transgenic group compared with the other groups. 8 numbers of animals were euthanized and the dressing percentage, loin muscle and lean meat percentage were significantly higher in the DOX-induced F1 transgenic group compared with the other groups. In this study a large population of transgenic pigs, with integrated controllable expression of a transgene, was obtained. The transgenic pigs were healthy and normal in terms of reproductive capability. At the same time, feed efficiency was improved, production processes were accelerated and meat yield was increased.


Conflict of interest statement

The authors declare no competing financial interests.

Figures

Figure 1
Figure 1. Separation and sex determination of PEF cells.
A) PEF cells were separated from porcine fetuses. B) Detection of the SRY gene from separated cell lines. M stands for DL2000 DNA marker, blank control (NC) using water as the amplification template. The blots have been cropped to focus on the bands of interest. See Supplementary Fig. S1 for full-length gels. M and F are male and female control cells; A, B, C and D are cell lines.
Figure 2
Figure 2. Identification and induction of transgenic donor cell clones.
A) rtTA gene detection in genomic DNA of G418 positive PEF cell lines. Lane M, DL2000 DNA marker; positive control (+, PC) and negative control (−, NC) using pTTGH plasmid DNA and untransfected PEF cell genomic DNA as templates, respectively. B) QRT-PCR analysis of rtTA expression in rtTA integrated cell clones. The cell clones with the highest rtTA mRNA expression levels are circled. C) Real-time PCR analysis of pGH mRNA expression in cell clones before and after DOX induction. The pGH mRNA expression levels in PEF cell clones NO.11 and NO.19 have low basic pGH expression levels and higher induction efficiency. D) Western blot analysis of pGH protein expression in cell clones before and after DOX induction. The positive control (PC) was the cells transfected with pcDNA-GH plasmid; the negative control was the normal cells. The gradation analysis method was used to compare the pGH induction and expression efficiency in PEF cell lines. The blots have been cropped to focus on the bands of interest. See Supplementary Fig. S2-3 for full-length gels.
Figure 3
Figure 3. Gene copy numbers and insertion sites in donor cell clones.
A) Foreign gene copy numbers were measured with a modified QRT-PCR method. Non-transgenic Large White pig genomic DNA was used as the control QRT-PCR template. The transgenic donor cell clones NO.11 and NO.19 were used as QRT-PCR templates. B, C) The locations of foreign genes in the transgenic donor cells. Specific DNA fragments obtained using the genomic walking method were recovered and sequenced. B) The foreign gene in donor cell clone NO.11 was located on chromosomes 1 and 13. C) The foreign gene in donor cell clone NO.19 was located on chromosomes 6 and 7.
Figure 4
Figure 4. Identification of F0 transgenic cloned pigs.
A) Detection of the rtTA gene in genomic DNA from blood samples of the 5 cloned pigs (lanes 4–8) and a non-transgenic pig (lane 2). Lane PC, using a pTTGH DNA fragment as a template; lane NC, using genomic DNA from non-transgenic pigs as a template. B) Transgenic pigs were identified using Southern blot and a Dig-labeled GH probe was used to hybridize the genomic DNA from ear tip tissue of transgenic pigs. After digestion with EcoRI, the endogenous GH (pGH1 in B) band and part of the pTTGH fragment (pGH2 in B) were detected in transgenic pigs. rtTA was also detected. The blots have been cropped to focus on the bands of interest. See Supplementary Fig. S4-5 for full-length gels.
Figure 5
Figure 5. Expression of pGH in cells from F0 transgenic pigs in the presence and absence of DOX.
A) Ear-tip fibroblasts were separated from partial transgenic pigs. B) QRT-PCR analysis of pGH mRNA expression in ear-tip fibroblast cells from transgenic pigs. C) Western blot analysis of pGH protein detection in cells from transgenic pigs. After DOX induction, pGH protein levels increased significantly compared with those in the control and the non-induced groups. The blots have been cropped to focus on the bands of interest. See Supplementary Fig. S6 for full-length gels.
Figure 6
Figure 6. Serum pGH and IGF-1 levels in F0 transgenic pigs before and after DOX induction.
A) Serum GH detection. Before DOX induction, the average serum pGH concentrations of 3 cloned transgenic pigs (86, 115, and 133) were significantly lower than the average concentrations after DOX induction. B) Serum IGF-1 detection. After DOX induction, the average serum IGF-1 concentrations of 3 cloned transgenic pigs decreased significantly compared with the average serum concentrations before DOX induction. The control pigs showed no significant differences in GH and IGF-1 levels, regardless of whether they were induced with DOX.
Figure 7
Figure 7. Growth rates and feed efficiencies of F1 transgenic and wild type pigs.
A) Birth weights of F1 transgenic and wild type pigs. B) Weaning weights on day 28 of F1 transgenic and wild type pigs. C) Ratio of feed to gain. D) Growth curve of F1 transgenic male pigs. E) Growth curve of F1 transgenic female pigs. (M+)•: transgenic male F1 + DOX, (M+) •: transgenic male F1-DOX, (M-) •: wild type male F1 + DOX and (M-) •: wild type male F1-DOX; (F +) •: transgenic female F1 +DOX, (F +) •: transgenic female F1-DOX, (F -) •: wild type female F1 +DOX and (F -) •: wild type female F1-DOX.
Figure 8
Figure 8. Serum pGH and IGF-1 levels in F1 transgenic pigs.
A) Serum GH detection. The average serum pGH concentrations in the transgenic induction group (male and female) were significantly higher than those in the transgenic non-induction group and the wild type induction and non-induction groups. B) Serum IGF-1 detection. The average serum IGF-1 concentration in the transgenic induction group (male and female) decreased significantly compared to that in the transgenic non-induction group and the wild type induction and non-induction groups. There was no significant difference in serum IGF-1 levels in the transgenic non-induction group or the wild type induction and non-induction groups.
Figure 9
Figure 9. Slaughter measurements of F1 transgenic and wild type pigs.
A) Cross sections through the loin at the 6th-7th rib of F1 transgenic and non-transgenic pigs. B) Lean percentage in F1 transgenic and non-transgenic pigs. C) Dressing percentage (%) of F1 pigs. D) Loin muscle area (cm2) of F1 pigs. (F+)• and (F-)•, female F1 transgenic and wild type pigs induced with DOX; (F+) mn • and (F-) •, female F1 transgenic and wild type pigs without DOX; (M+) • and (M-) •, male F1 transgenic and wild type pigs induced with DOX; (M+) • and (M-) •, male F1 transgenic and wild type pigs without DOX.
Figure 10
Figure 10. Schematic representation of the pCAGGS-rtTA-TRE-GH12 (pTTGH) vector fragment.
A) Schematic of the pTTGH vector. B) pCAGGS-rtTA-loxp-neoTK-TRE-GH12 fragment (pTTGH, Ssp I, Sfi I cut, 8257 bp). The pTTGH vector was cut with restriction enzymes, Ssp I and Sfi I, and the pTTGH fragment (8257 bp) was recovered. The pTTGH fragment was constructed with the GH expression box, a GH12 gene controlled with a pTRE promoter, a GH expression inducing box and an rtTA gene expressed with a pCAG promoter. A fusion gene of a neomycin resistant gene and a diphtherial toxin (DTA) gene, flanked by loxP sites, was chosen as a selectable gene. The relative positions of the primer pairs pGH-SL/ pGH-SR, pGH-L/ pGH-R, rtTA-L/rtTA-R, rtTA-L2/rtTA-R2 and 3 sequence specific primers for genome walking are shown. The EcoRI restriction enzyme sites (444 bp, 928 bp, 4204 bp and 7232 bp) are shown above.

References

    1. First N., Hansel W. & Wier B. New animal breeding techniques and their application. Proceedings of the second symposium on genetic engineering of animals held at Cornell University, USA, June. 3–14 Journals of Reproduction and Fertility Ltd. 1989).
    1. Pursel V. G. et al. Genetic engineering of livestock. Science. 244, 1281–1288 (1989). - PubMed
    1. Wolf E. et al. Transgenic technology in farm animals-progress and perspectives. Exp. Physiol. 85, 615–625 (2000). - PubMed
    1. Houdebine L. M. Transgenic animal bioreactors. Transgenic Res. 9, 305–320 (2000). - PMC - PubMed
    1. Lonberg N. Human antibodies from transgenic animals. Nat. Biotechnol. 23, 1117–1125 (2005). - PubMed

Publication types

MeSH terms