Measurements of Intra-Aortic Balloon Wall Movement During Inflation and Deflation: Effects of Angulation
- PMID: 25959284
- PMCID: PMC5034498
- DOI: 10.1111/aor.12509
Measurements of Intra-Aortic Balloon Wall Movement During Inflation and Deflation: Effects of Angulation
Abstract
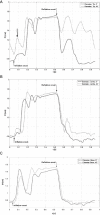
The intra-aortic balloon pump (IABP) is a ventricular assist device that is used with a broad range of pre-, intra-, and postoperative patients undergoing cardiac surgery. Although the clinical efficacy of the IABP is well documented, the question of reduced efficacy when patients are nursed in the semi-recumbent position remains outstanding. The aim of the present work is therefore to investigate the underlying mechanics responsible for the loss of IABP performance when operated at an angle to the horizontal. Simultaneous recordings of balloon wall movement, providing an estimate of its diameter (D), and fluid pressure were taken at three sites along the intra-aortic balloon (IAB) at 0 and 45°. Flow rate, used for the calculation of displaced volume, was also recorded distal to the tip of the balloon. An in vitro experimental setup was used, featuring physiological impedances on either side of the IAB ends. IAB inflation at an angle of 45° showed that D increases at the tip of the IAB first, presenting a resistance to the flow displaced away from the tip of the balloon. The duration of inflation decreased by 15.5%, the inflation pressure pulse decreased by 9.6%, and volume decreased by 2.5%. Similarly, changing the position of the balloon from 0 to 45°, the balloon deflation became slower by 35%, deflation pressure pulse decreased by 14.7%, and volume suctioned was decreased by 15.2%. IAB wall movement showed that operating at 45° results in slower deflation compared with 0°. Slow wall movement, and changes in inflation and deflation onsets, result in a decreased volume displacement and pressure pulse generation. Operating the balloon at an angle to the horizontal, which is the preferred nursing position in intensive care units, results in reduced IAB inflation and deflation performance, possibly compromising its clinical benefits.
Keywords: Balloon diameter; Counterpulsation; Deflation; Flow; Inflation; Intra-aortic balloon pump; Operating angle; Pressure; Visualization.
Copyright © 2015 The Authors. Artificial Organs published by Wiley Periodicals, Inc. on behalf of International Center for Artificial Organ and Transplantation (ICAOT).
Figures


References
-
- Thomas PJ, Paratz JD, Stanton WR, Deans R, Lipman J. Positioning practices for ventilated intensive care patients: current practice, indications and contraindications. Aust Crit Care 2006;19:122–132. - PubMed
-
- Li TST, Joynt GM, So HY, Gomersall CD, Yap FHY. Semi‐recumbent position in ICU. Crit Care & Shock 2008;11:61–66.
-
- Kollef MH. Prevention of hospital‐associated pneumonia and ventilator‐associated pneumonia. Crit Care Med 2004;32:1396–1405. - PubMed
-
- Lorente L, Blot S, Rello J. Evidence on measures for the prevention of ventilator‐associated pneumonia. Eur Respir J 2007;30:1193–1207. - PubMed
-
- Bleifeld W, Meyer‐Hartwig K, Irnich W, Bussmann WD, Meyer J. Dynamics of balloons in intraaortic counterpulsation. Am J Roentgenol Radium Ther Nucl Med 1972;116:155–164. - PubMed
Publication types
MeSH terms
Grants and funding
LinkOut - more resources
Full Text Sources
Other Literature Sources

