. 2015 Aug;36(8):3104-16.
doi: 10.1002/hbm.22831. Epub 2015 May 9.

The trajectory of disturbed resting-state cerebral function in Parkinson's disease at different Hoehn and Yahr stages

Affiliations

The trajectory of disturbed resting-state cerebral function in Parkinson's disease at different Hoehn and Yahr stages

ChunYan Luo et al. Hum Brain Mapp. 2015 Aug.

Abstract

Objective: We aim to investigate the disturbance of neural network associated with the different clinical stages of Parkinson's disease (PD).

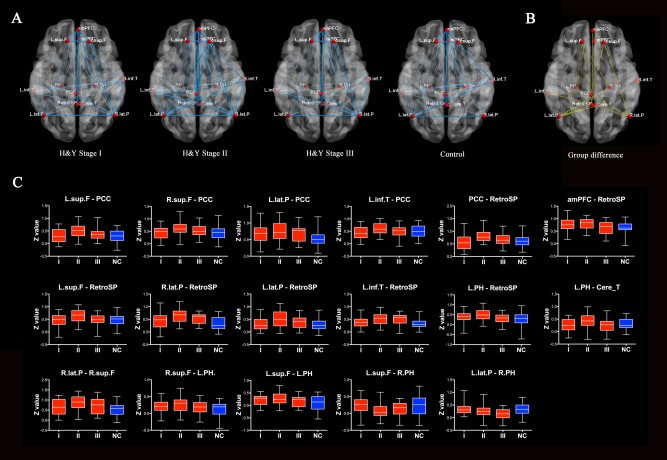
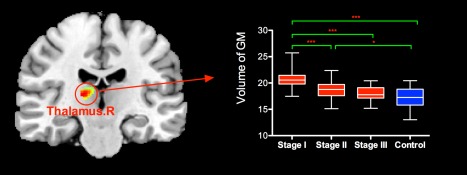
Method: We recruited 80 patients at different H&Y stages of PD (28 at H&Y stage I, 28 at H&Y stage II, 24 at H&Y stage III) and 30 normal controls. All participants underwent resting-state fMRI scans on a 3-T MR system. The amplitude of low-frequency fluctuation (ALFF) of blood oxygen level-dependent signals was used to characterize regional cerebral function. Functional integration across the brain regions was evaluated by a seed voxel correlation approach.

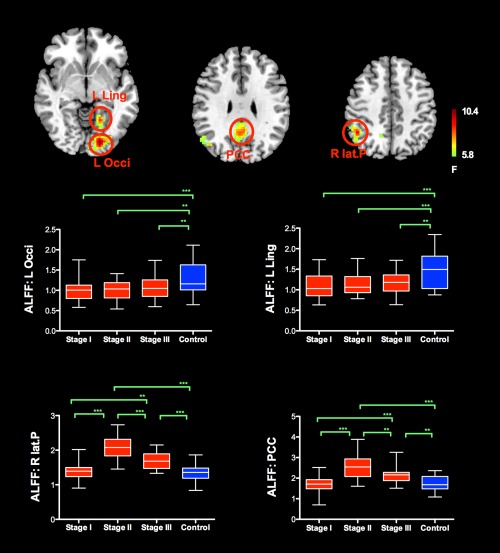
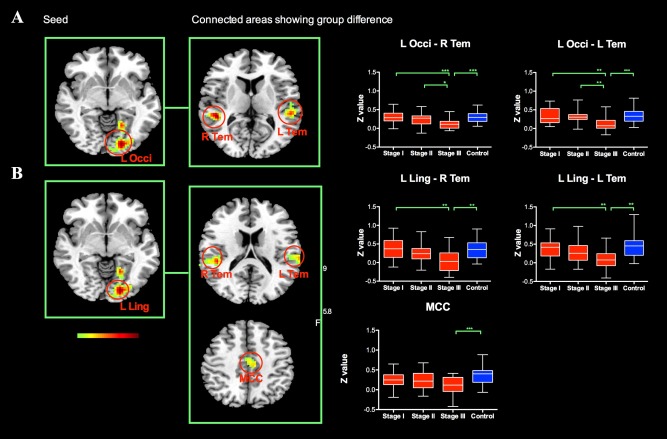
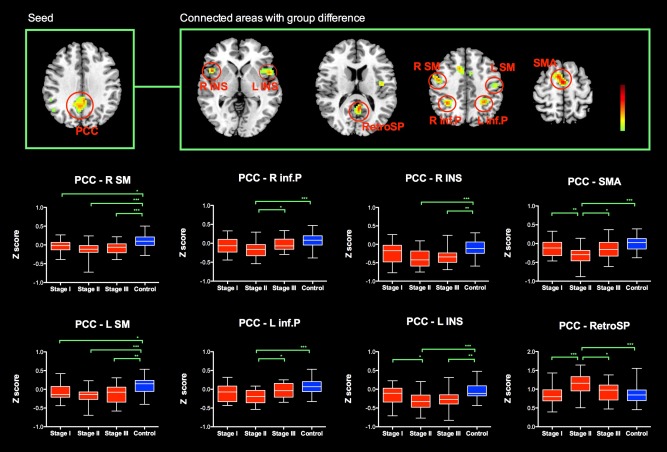
Results: PD patients had decreased regional activities in left occipital and lingual regions; these regions show decreased functional connection pattern with temporal regions, which is deteriorating as H&Y stage ascending. In addition, PD patients, especially those at stage II, exhibit increased regional activity in the posterior regions of default mode network (DMN), increased anticorrelation between posterior cingulate cortex (PCC) and cortical regions outside DMN, and higher temporal coherence within DMN. Those indicate more highly functioned DMN in PD patients at stage II.

Conclusions: Our study demonstrated the trajectories of resting-state cerebral function disturbance in PD patients at different H&Y stages. Impairment in functional integration of occipital-temporal cortex might be a promising measurement to evaluate and potentially track functional substrates of disease evolution of PD.

Keywords: Hoehn and Yahr stage; Parkinson's disease; default mode network; occipital-temporal; resting-state fMRI.


Figures

Figure 1
Figure 1
The group level ALFF analysis revealed significant group differences in PCC/precuneus, right lateral parietal cortex, left occipital cortex and left lingual gyrus. Compared with normal control subjects, PD patients showed significant decreased ALFF in the left occipital cortex and left lingual gyrus in comparison to normal controls. Conversely, PD patients at H&Y stage II and III showed higher ALFF in the posterior cingulate cortex and right lateral parietal cortex. The pattern of increased ALFF in PD patients across different H&Y stages (I‐III) was more prominent in patients at H&Y stage II and resembles inverted “V” type. Abbreviation L: left; R: right; Occi: occipital; Ling: lingual; lat.P: lateral parietal; PCC: posterior cingulate cortex. [Color figure can be viewed in the online issue, which is available at http://wileyonlinelibrary.com.]
Figure 2
Figure 2
The group level analysis of the FC maps of left occipital cortex and left lingual gyrus revealed significant group differences in bilateral temporal cortex. PD patients at H&Y stage III demonstrated significant decreased functional connectivity of left occipital cortex/left lingual gyrus with bilateral temporal cortex. In PD patients, the functional connectivity of left occipital–temporal circuit showed descending pattern as H&Y stage ascending. Abbreviation: L: left; R: right; Occi: occipital; Ling: lingual; Tem: temporal; MCC: middle cingulate cortex. [Color figure can be viewed in the online issue, which is available at http://wileyonlinelibrary.com.]
Figure 3
Figure 3
The group level analysis of the FC maps of PCC revealed group differences in supplementary motor area, bilateral insular, bilateral sensorimotor area, bilateral inferior parietal cortex and retrosplenial cortex. In comparison to control group, the functional connectivity of PCC with supplementary motor cortex, bilateral insular, bilateral sensorimotor cortex and bilateral inferior parietal cortex were relatively decreased in PD patients, and further shift to negative connectivity pattern. The anticorrelation pattern (negative functional connectivity of PCC) was most prominent in PD patients at H&Ystage II. Conversely, PCC shows positive correlation with retrosplenial cortex. The functional connectivity of PCC with retrosplenial cortex was significantly increased in PD patient at H&Y stage II compared with normal controls. Abbreviation: L: left; R: right; PCC: posterior cingulate cortex; SM: sensorimotor area; inf.P: inferior parietal cortex; INS: insular; SMA: supplementary motor area; RetroSP: retrosplenial cortex. [Color figure can be viewed in the online issue, which is available at http://wileyonlinelibrary.com.]
Figure 4
Figure 4
UPDRS III score was negatively correlated with the z values of the left lingual/occipital regions with bilateral temporal regions in PD patients. MMSE score was positively correlated with z values of left lingual/occipital regions with occipital regions. Abbreviation: L: left; R: right; Occi: occipital; Ling: lingual. [Color figure can be viewed in the online issue, which is available at http://wileyonlinelibrary.com.]
Figure 5
Figure 5
(A) Graph visualization of the mean connectivity within DMN in controls and PD patients across different H&Y stage (I–III). Undirected edges (functional connectivity) are demonstrated with two different width lines according to three different connection strengths (r > 0.2 and r > 0.4). (B) Graph represents the differences in region‐wise functional connectivity among the four groups (P = 0.036, corrected). (C) Among those connections, 15 connections exhibited increased values in the PD patients, especially in PD patients at stage II, as compared with the controls. Two connections showed relatively decreased values in PD patients as compared with the controls. Abbreviation: see Supporting Information Table S2. [Color figure can be viewed in the online issue, which is available at http://wileyonlinelibrary.com.]
Figure 6
Figure 6
VBM analysis revealed PD patients at early stage (especially those at H&Y stage I) have relatively higher gray matter (GM) volume than controls in right thalamus. [Color figure can be viewed in the online issue, which is available at http://wileyonlinelibrary.com.]

References

    1. Abe Y, Kachi T, Kato T, Arahata Y, Yamada T, Washimi Y, Iwai K, Ito K, Yanagisawa N, Sobue G (2003): Occipital hypoperfusion in parkinson's disease without dementia: Correlation to impaired cortical visual processing. J Neurol Neurosurg Psychiatry 74:419–422. - PMC - PubMed
    1. Agosta F, Canu E, Stojkovic T, Pievani M, Tomic A, Sarro L, Dragasevic N, Copetti M, Comi G, Kostic VS , Filippi M. (2013): The topography of brain damage at different stages of parkinson's disease. Hum Brain Mapp 34:2798–2807. - PMC - PubMed
    1. Ashburner J. (2007): A fast diffeomorphic image registration algorithm. Neuroimage 38:95–113. - PubMed
    1. Baggio HC, Segura B, Sala‐Llonch R, Marti MJ, Valldeoriola F, Compta Y, Tolosa E, Junque C. (2014): Cognitive impairment and resting‐state network connectivity in Parkinson's disease. Hum Brain Mapp. - PMC - PubMed
    1. Baglio F, Blasi V, Falini A, Farina E, Mantovani F, Olivotto F, Scotti G, Nemni R, Bozzali M (2011): Functional brain changes in early parkinson's disease during motor response and motor inhibition. Neurobiol Aging 32:115–124. - PubMed