Comparative Study
. 2015 May 19;11(7):1110-22.
doi: 10.1016/j.celrep.2015.04.023. Epub 2015 May 7.

Principles of long noncoding RNA evolution derived from direct comparison of transcriptomes in 17 species

Affiliations
Comparative Study

Principles of long noncoding RNA evolution derived from direct comparison of transcriptomes in 17 species

Hadas Hezroni et al. Cell Rep. .

Abstract

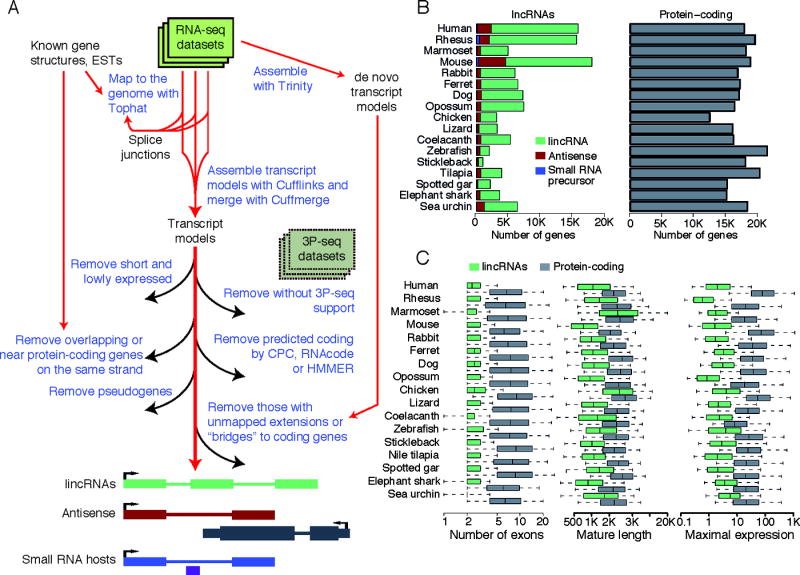
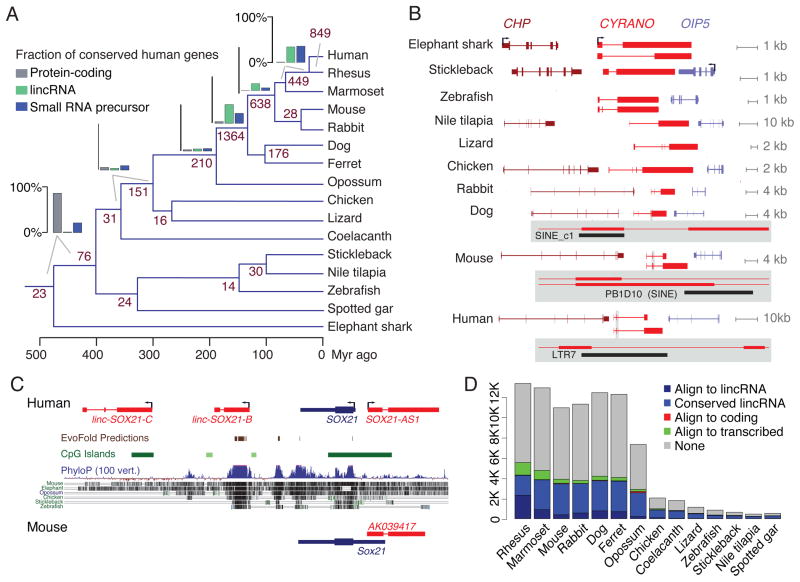
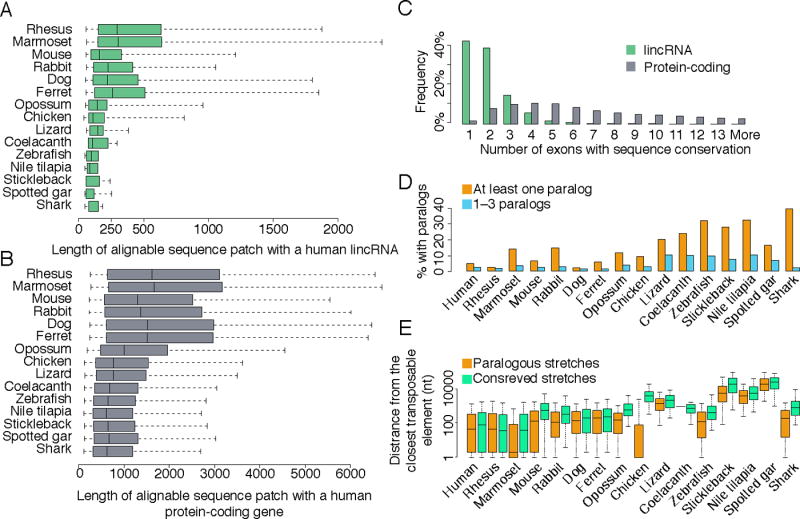
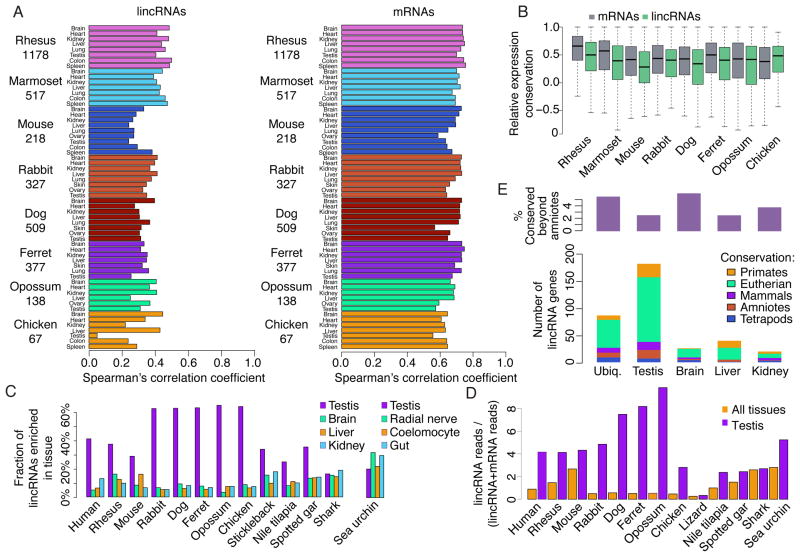
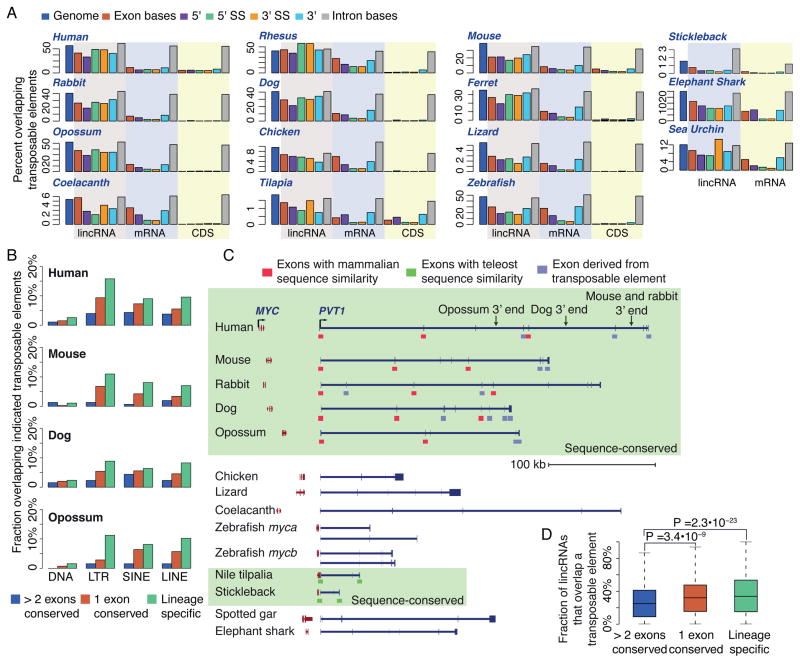
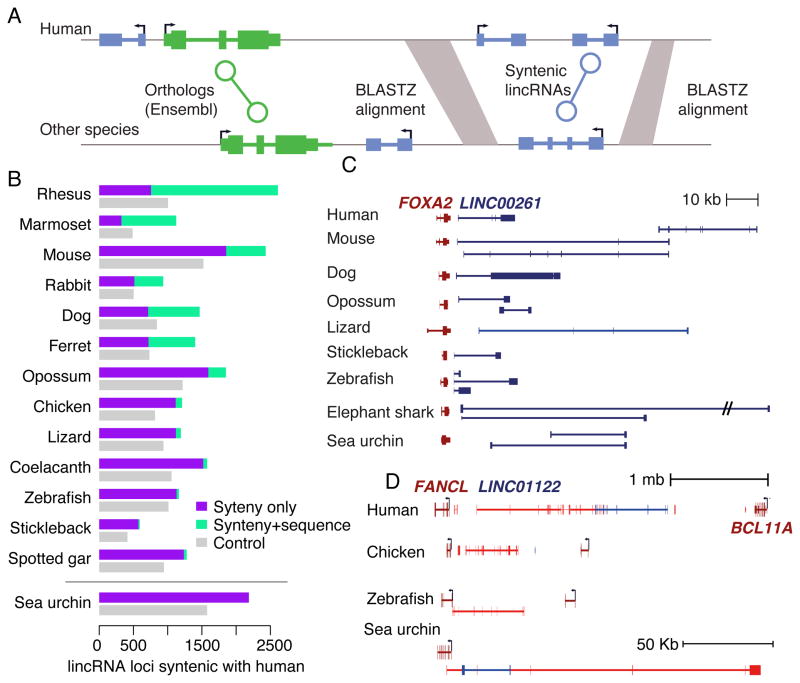
The inability to predict long noncoding RNAs from genomic sequence has impeded the use of comparative genomics for studying their biology. Here, we develop methods that use RNA sequencing (RNA-seq) data to annotate the transcriptomes of 16 vertebrates and the echinoid sea urchin, uncovering thousands of previously unannotated genes, most of which produce long intervening noncoding RNAs (lincRNAs). Although in each species, >70% of lincRNAs cannot be traced to homologs in species that diverged >50 million years ago, thousands of human lincRNAs have homologs with similar expression patterns in other species. These homologs share short, 5'-biased patches of sequence conservation nested in exonic architectures that have been extensively rewired, in part by transposable element exonization. Thus, over a thousand human lincRNAs are likely to have conserved functions in mammals, and hundreds beyond mammals, but those functions require only short patches of specific sequences and can tolerate major changes in gene architecture.


Figures

Figure 1
Figure 1. Reconstruction of lncRNA transcripts in 17 species
(A) PLAR pipeline. On the bottom, green, red and blue transcript models represent lincRNA, antisense RNA, and small RNA hosts, respectively. The gray and the purple models represent a coding gene and a small RNA, respectively. (B) Numbers of distinct lncRNA and protein-coding transcript models reconstructed in each species. (C) Features of lncRNA and protein-coding genes reconstructed in each species. Expression levels in each species are the maximum over all samples and computed in FPKM (fragments per kilobase per million of reads) units using CuffDiff (Trapnell et al., 2012). See also Tables S1,S2, and S3 and Figures S1 and S2.
Figure 2
Figure 2. Conservation of lincRNAs in vertebrates
(A) Phylogeny of the species studied with the numbers of lincRNAs that are estimated to have emerged at different times. The numbers shown next to each split are numbers of clusters with representatives in both lineages for the split and no representatives in more basally split groups. The bar plots present the fraction of all clusters with a representative from the human genome that are estimated to emerge before the adjacent split. (B) Evolution of the Cyrano lincRNA in vertebrates. Representative isoforms of the coding and lincRNA transcripts in each species are shown. Shaded boxes show magnification of splice junctions derived from transposable elements in dog, mouse and human. Cyrano is also annotated as OIP5-AS1 in human. (C) lincRNAs in the Sox21 locus in human and mouse. Representative isoforms are shown in each species. Sequence conservation computed by PhyloP (Pollard et al., 2010), EvoFold (Pedersen et al., 2006) predictions, CpG island annotations and whole genome alignments taken from the UCSC genome browser. (D) Numbers of human lincRNA genes that align to the indicated species are split based on the indicated categories. “Align to lincRNA” are lincRNAs that have sequences mapping to a lincRNA in the indicated species (and therefore are conserved lincRNAs by definition). “Conserved lincRNAs” have sequence-similar homologs in some other species, but the sequence they align to in the indicated genome does not overlap a lincRNA in that specific genome. “Align to coding” are lincRNAs that are not conserved and whose projection through the whole genome alignment overlapped with a protein-coding gene in the other species. “Align to transcribed” are those nonconserved lincRNAs that align to a transcribed region in our transcriptome reconstruction in the other species that was not classified as protein-coding or as lincRNA. “None” are those lincRNAs that have only sequences aligning to untranscribed portions of the corresponding genome. See also Table S4 and Figure S3.
Figure 3
Figure 3. Conserved and paralogous patches in lincRNAs
(A) Distributions of lengths of conserved patches, defined as the total length of the sequence alignable by BLASTN between a human lincRNA transcript and any lincRNA transcript in the indicated species. (B) Same as A, but for protein-coding gene reconstructions. (C) When considering patches of conservation of human lincRNAs with species except for rhesus, the distributions of the number of exons that overlap a conserved sequence patch. (D) Fraction of lincRNA genes that have a paralogous lincRNA (BLASTN E-value<10−5) within the same species. Fractions are shown either when including all paralogous pairs, or only considering lincRNAs that have less than four distinct paralogous lincRNAs. (E) Distributions of distances of paralogous and conserved sequence patches from the nearest annotated transposable element. See also Figure S4.
Figure 4
Figure 4. Expression patterns of conserved and lineage-specific lincRNAs
(A) Correlation of absolute expression levels between human lincRNAs and mRNAs and their conserved homologs in indicated other species. (B) Distributions of correlations of relative expression levels, computed as Spearman’s correlations between expression patterns, between lincRNAs/mRNAs and their conserved homologs in the indicated species. (C) Fraction of all lincRNAs in the indicated species that are enriched in the indicated tissue. (D) Number of RNA-seq reads that mapped to a lincRNA out of all reads that could be mapped to any mRNA or lincRNA. “All tissues” is the median fraction across all tissues, and “Testis” is the fraction just in the testis samples. (E) Comparison of conservation levels of lincRNAs enriched in different tissues. The top part of the panel shows the fraction of the human lincRNAs enriched in the indicated tissue in human that are conserved in a non-mammalian species. The bottom part shows the absolute number of conserved lincRNAs enriched in each tissue, partitioned based on the conservation level of the lincRNA (the most distant species where homologs of the lincRNA can be found). “Ubiq.” are ubiquitously expressed genes. See also Figure S5.
Figure 5
Figure 5. Transposable elements rewire lincRNA loci
(A) Fraction of different genomic elements (bases, 5′ and 3′ ends of the transcript, and 5′ and 3′ splice sites (SSs)) overlapping a transposable element. (B) Same as (A), but showing only overlap with the transcription start sites and considering separately transposable elements of the indicated families. (C) Schematic representation of the Myc/Pvt1 locus in different vertebrates. Representative isoforms of Myc/Pvt1 are shown. Bars beneath exons represent their conservation and origin status. Shaded regions group together two groups of Pvt1 homologs that share alignable sequences, one in mammals and the other in fish. (D) Comparison of the fraction of lncRNA sequences in different subgroups of lincRNAs that overlap a transposable element. The number of conserved exons in a lincRNA gene is the maximum number of conserved exons across all its isoforms. See also Figure S6 and Table S5.
Figure 6
Figure 6. Hundreds of lincRNAs appear in syntenic positions without sequence conservation
(A) A cartoon illustrating our approach for identifying stringently syntenic lincRNAs between human and other genomes. (B) Number of lincRNAs appearing at syntenic positions with (“Synteny+Sequence”) and without (“Synteny only”) sequence conservation. Control numbers were obtained by randomly placing the human lincRNAs in intergenic regions and repeating the analysis ten times, averaging the numbers of observed synteny relationships. All numbers were obtained using the stringent procedure described in Experimental procedures, except for sea urchin. (C) Schematic representation of the Foxa2/Linc00261 locus in different species. (D) Schematic representation of the Fancl/Bcl11a locus in different species with lincRNA gene models collapsed into a single meta-gene. Transcripts on the left-to-right strand are in red and those on the right-to-left strand are in blue. See also Table S6.

References

    1. Bartel DP. MicroRNAs: target recognition and regulatory functions. Cell. 2009;136:215–233. - PMC - PubMed
    1. Cabili MN, Trapnell C, Goff L, Koziol M, Tazon-Vega B, Regev A, Rinn JL. Integrative annotation of human large intergenic noncoding RNAs reveals global properties and specific subclasses. Genes & development. 2011;25:1915–1927. - PMC - PubMed
    1. Chodroff RA, Goodstadt L, Sirey TM, Oliver PL, Davies KE, Green ED, Molnar Z, Ponting CP. Long noncoding RNA genes: conservation of sequence and brain expression among diverse amniotes. Genome biology. 2010;11:R72. - PMC - PubMed
    1. Chureau C, Prissette M, Bourdet A, Barbe V, Cattolico L, Jones L, Eggen A, Avner P, Duret L. Comparative sequence analysis of the X-inactivation center region in mouse, human, and bovine. Genome research. 2002;12:894–908. - PMC - PubMed
    1. Clark MB, Amaral PP, Schlesinger FJ, Dinger ME, Taft RJ, Rinn JL, Ponting CP, Stadler PF, Morris KV, Morillon A, et al. The reality of pervasive transcription. PLoS biology. 2011;9:e1000625. discussion e1001102. - PMC - PubMed

Publication types

Substances

Associated data

LinkOut - more resources