. 2015 May 18;25(10):1319-26.
doi: 10.1016/j.cub.2015.03.023. Epub 2015 May 7.

Genetic dissection of a regionally differentiated network for exploratory behavior in Drosophila larvae

Affiliations

Genetic dissection of a regionally differentiated network for exploratory behavior in Drosophila larvae

Jimena Berni. Curr Biol. .

Abstract

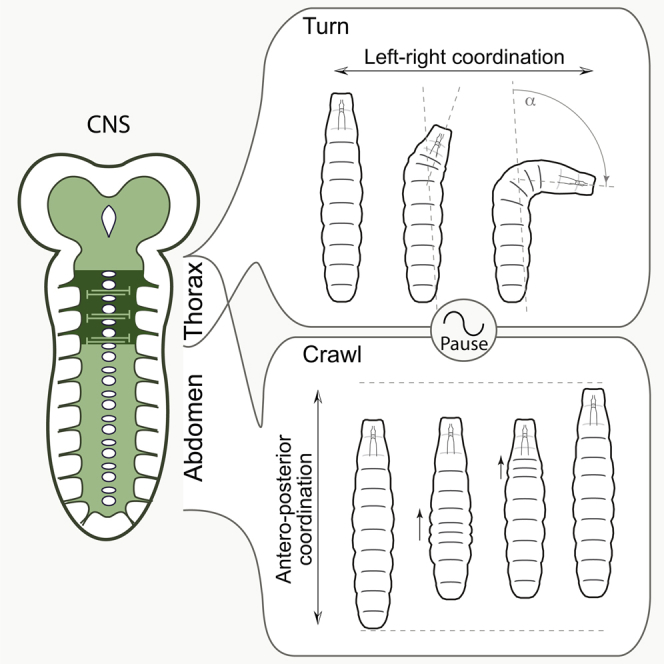
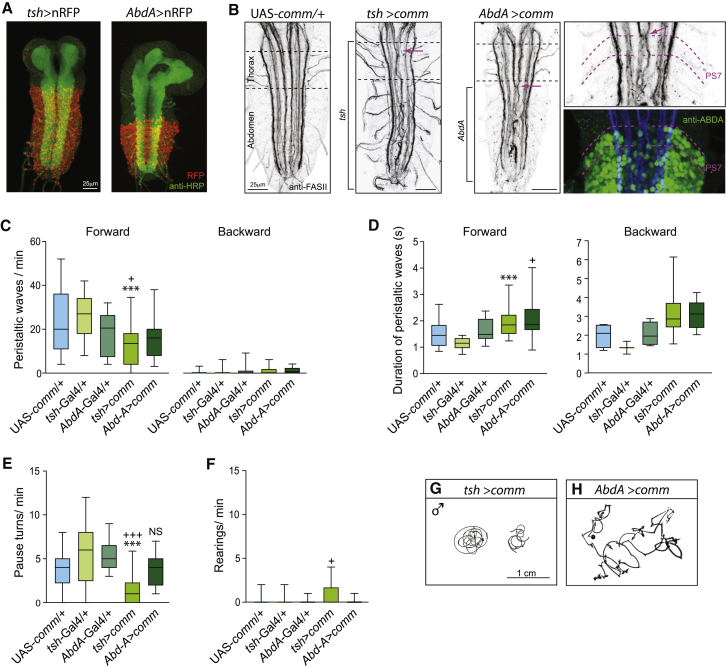
An efficient strategy to explore the environment for available resources involves the execution of random walks where straight line locomotion alternates with changes of direction. This strategy is highly conserved in the animal kingdom, from zooplankton to human hunter-gatherers. Drosophila larvae execute a routine of this kind, performing straight line crawling interrupted at intervals by pause turns that halt crawling and redirect the trajectory of movement. The execution of this routine depends solely on the activity of networks located in the thoracic and abdominal segments of the nervous system, while descending input from the brain serves to modify it in a context-dependent fashion. I used a genetic method to investigate the location and function of the circuitry required for the different elements of exploratory crawling. By using the Slit-Robo axon guidance pathway to target neuronal midline crossing defects selectively to particular regions of the thoracic and abdominal networks, it has been possible to define at least three functions required for the performance of the exploratory routine: (1) symmetrical outputs in thoracic and abdominal segments that generate the crawls; (2) asymmetrical output that is uniquely initiated in the thoracic segments and generates the turns; and (3) an intermittent interruption to crawling that determines the time-dependent transition between crawls and turns.


Figures

None
Graphical abstract
Figure 1
Figure 1
Survival of Drosophila robo Mutants (A) Staining showing the Fasciclin II (FASII) positive axon tracts in first instar larval nerve cords for the different allelic combinations used in the study. The increase in the number of axons that cross the midline produces the characteristic circular appearance around the commissures. The penetrance of this phenotype is complete (robo1/robo2 82/82; robo2/robo8 42/42 and [10]). See Figure S1 for evaluation of excitatory and inhibitory midline connectivity. (B) Average percentage of fertilized eggs hatching (±SEM). (C) Average percentage of hatched larvae that survived until emergence of the adult (±SEM). A Kruskal-Wallis test with Dunn’s multiple comparison comparing OrR with all genotypes and each allelic combination with their heterozygote alleles was performed. Asterisk () indicates p < 0.05 when compared to OrR. ++p < 0.05 when compared to robo1/+.
Figure 2
Figure 2
Locomotor Behavior of robo Mutant Larvae (A–F) Characteristic tracks of first instar larvae. OrR (A) and heterozygous robo mutant alleles (D–F) explore by alternating straight movements with turns. robo mutant larvae perform circular crawls (B and C). (G and H) Representative crawling patterns depicted by perimeter stacks. OrR larvae perform pause turns (G) (asterisk) by bending the anterior part of the body. robo mutants crawl in circles without performing turns (H). See also Movies S1, S2, S3, and S4 and Figure S2 for a detailed description of the behaviors. (I) Number of forward and backward waves per minute. (J) Duration of forward and backward waves in seconds. (K) Distribution of duration of forward peristalsis for all waves analyzed. The gray box highlights the duration of waves in OrR larvae. Binning is 200 ms; OrR n = 375; robo1/robo2 n = 471; robo2/robo8 n = 319. (L) Number of pause turns per minute. (M) Number of rearing events per minute. (N) Proportion of transitions. The number of pauses turns + rearing movements divided by the number of forward waves + backward waves was calculated. There are no significant differences between any genotype. A Kruskal-Wallis test with Dunn’s multiple comparison was used in (I), (J), (L), (M), and (N). Forward and backward waves were compared independently. Asterisk () indicates comparison with robo2/+; + indicates comparison with the other heterozygote control; and # indicates comparison with OrR. p < 0.05; ∗∗p < 0.01; ∗∗∗p < 0.001; +++p < 0.001. 32–41 larvae were evaluated per group. Boundaries of boxplots represent first and third quartiles; the middle line indicates the median. Whiskers indicate the highest and lowest value of each experimental group.
Figure 3
Figure 3
Output Activity of the CPG for Exploration (A) Schematic denoting the location in the motor neuropile of the anatomically distinct nodes of fluorescence at the level of the intersegmental nerve that has been analyzed: ROI, region of interest; PC, posterior commissure; AC, anterior commissure. (B) Equivalent region as in right panel of (A) in a CNS stained against GFP. (C) Snapshot of GCaMP3 fluorescence in glutamatergic neurons in an isolated nerve cord. Right: the ROIs on both sides of the nerve cord are shown. (D and E) Relative fluorescence change in isolated nervous systems. Left (blue) and right (green) sides of thoracic and abdominal segments were analyzed. Characteristic traces in control nervous system (D). Forward waves (“F”) of activity propagating along segments can be observed as well as asymmetric periods (“A”) in anterior segments. In robo2/robo1 mutants, forward and backward waves (“B”) are present (E). The asymmetric periods are absent, but symmetrical periods in the half anterior segments (“H”) can be observed. (F and G) Normalized intensity difference between the left and right side for the recording shown in (D) and (E), respectively. (H) Number of events per minute. n = 9 per group. A t test was performed comparing the number of waves between genotypes. Boxplots are described in the legend of Figure 2. (I and J) Average normalized intensity per second (±SEM). The periods of symmetrical and asymmetrical activity are compared in control animals showing that differences in activity occur mainly in anterior segments (I). An ANOVA (F21,375 = 18.36; p < 0.0001) with Bonferroni’s multiple comparison test comparing between genotypes for each segment was performed. ∗∗p < 0.001. n = 16 symmetrical periods and n = 20 asymmetrical periods. The difference of intensity for all active periods in control and robo mutants are compared (H). Anterior segments show a difference in symmetry. An ANOVA (F21,161 = 2.967; p < 0.0001) with Bonferroni’s multiple comparison test comparing between genotypes for each segment was performed. p < 0.05. In robo mutant, there is no significant difference among segments, indicating that the output of the CPG is symmetrical (Bonferroni’s multiple comparison test comparing between segments). n = 8 per group. See also Figure S3 for a comparison between neuronal activity recorded with calcium imaging and behavior.
Figure 4
Figure 4
The Thoracic Segments Generate the Output for a Turn (A) Pattern of expression of the Gal4 lines used. The driver lines were crossed to the fluorescent reporter UAS-nuclear red fluorescent protein (nRFP). Anti-HRP staining was used to show the neuropile. tsh-Gal4 is expressed in the thoracic and abdominal segments [11]. In AbdA-Gal4, the gal4 is inserted in the largest intron of the abd-A transcription unit and reproduces the expression profile of Abd-A [23, 24] from the posterior half of A1 until the posterior half of A7 [25]. (B) Midline crossing defect as depicted by staining against Fas II. tsh>comm have midline crossing defects in thoracic and abdominal neuromeres, while aberrant crossing is only present in the abdominal segments of AbdA>comm larval nervous systems starting in segment A1, coinciding with the anterior boundary of AbdA expression (right panels). Magenta arrows indicate the anterior boundary of midline crossing defects. (C) Number of forward and backward waves per minute. (D) Duration of forward and backward waves in seconds. (E) Number of pause turns per minute. (F) Number of rearing events per minute. (G and H) Representative tracks of male tsh>comm and AbdA>comm larvae. A Kruskal-Wallis test with Dunn’s multiple comparison was used. Asterisk () indicates comparison with the same heterozygous driver line. p < 0.05; ∗∗∗p < 0.001. + indicates comparison with UAS-comm/+. +p < 0.05; ++p < 0.01; +++p < 0.001. nUAS-comm/+ = 23; ntsh-Gal4/+ = 23; nAbdA-Gal4/+ = 14; ntsh>comm = 30; nAbdA>comm = 19. Boxplots are described in the legend of Figure 2.

References

    1. Garcia R., Moss F., Nihongi A., Strickler J.R., Göller S., Erdmann U., Schimansky-Geier L., Sokolov I.M. Optimal foraging by zooplankton within patches: the case of Daphnia. Math. Biosci. 2007;207:165–188. - PubMed
    1. Pierce-Shimomura J.T., Morse T.M., Lockery S.R. The fundamental role of pirouettes in Caenorhabditis elegans chemotaxis. J. Neurosci. 1999;19:9557–9569. - PMC - PubMed
    1. Hills T., Brockie P.J., Maricq A.V. Dopamine and glutamate control area-restricted search behavior in Caenorhabditis elegans. J. Neurosci. 2004;24:1217–1225. - PMC - PubMed
    1. Reynolds A.M., Frye M.A. Free-flight odor tracking in Drosophila is consistent with an optimal intermittent scale-free search. PLoS ONE. 2007;2:e354. - PMC - PubMed
    1. McClellan A.D., Hagevik A. Descending control of turning locomotor activity in larval lamprey: neurophysiology and computer modeling. J. Neurophysiol. 1997;78:214–228. - PubMed

Publication types

LinkOut - more resources