. 2015 Jun 1;25(11):1426-36.
doi: 10.1016/j.cub.2015.04.005. Epub 2015 May 7.

Phenotypic characterization of speed-associated gait changes in mice reveals modular organization of locomotor networks

Affiliations

Phenotypic characterization of speed-associated gait changes in mice reveals modular organization of locomotor networks

Carmelo Bellardita et al. Curr Biol. .

Abstract

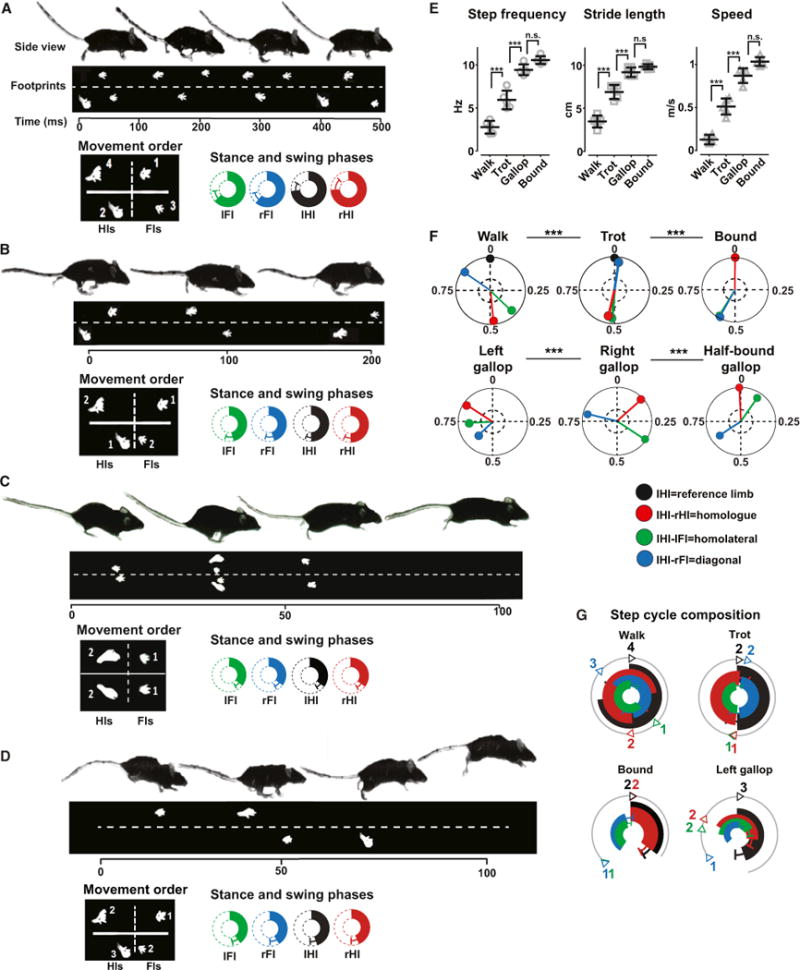
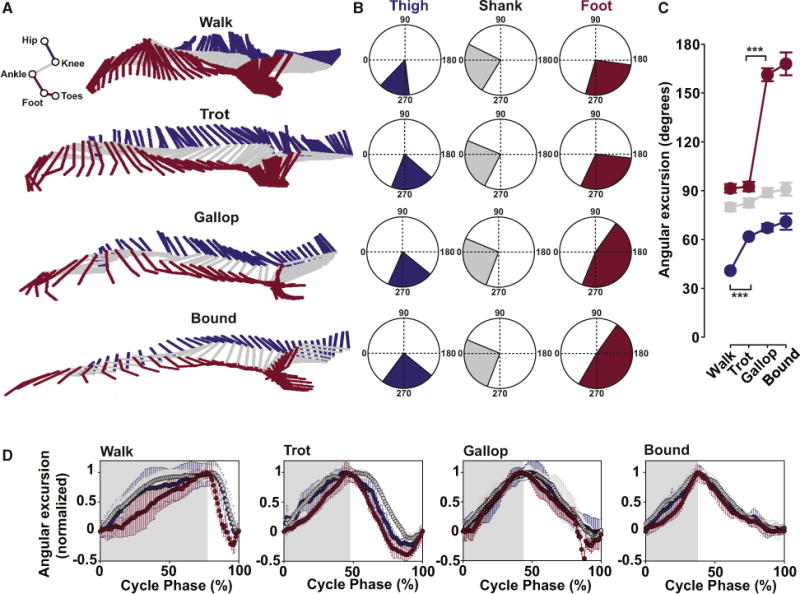
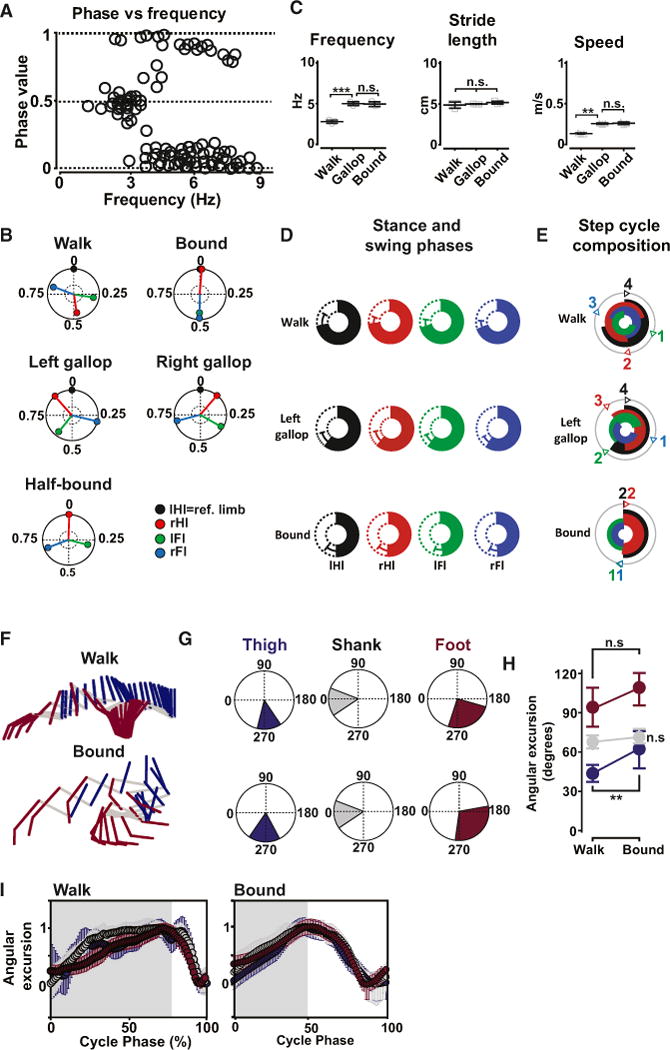
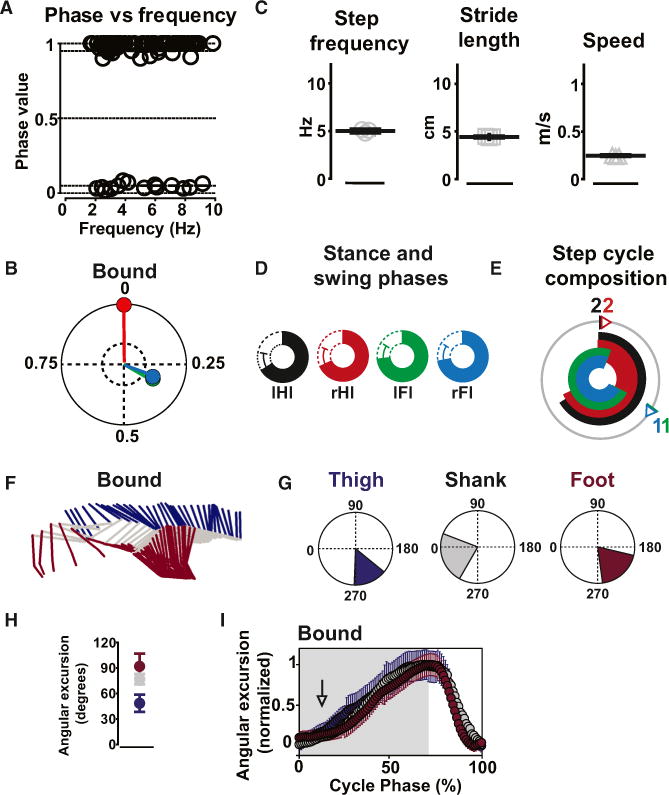
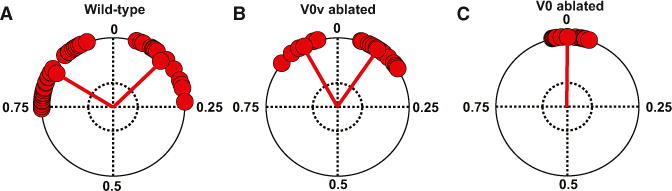
Studies of locomotion in mice suggest that circuits controlling the alternating between left and right limbs may have a modular organization with distinct locomotor circuits being recruited at different speeds. It is not clear, however, whether such a modular organization reflects specific behavioral outcomes expressed at different speeds of locomotion. Here, we use detailed kinematic analyses to search for signatures of a modular organization of locomotor circuits in intact and genetically modified mice moving at different speeds of locomotion. We show that wild-type mice display three distinct gaits: two alternating, walk and trot, and one synchronous, bound. Each gait is expressed in distinct ranges of speed with phenotypic inter-limb and intra-limb coordination. A fourth gait, gallop, closely resembled bound in most of the locomotor parameters but expressed diverse inter-limb coordination. Genetic ablation of commissural V0V neurons completely removed the expression of one alternating gait, trot, but left intact walk, gallop, and bound. Ablation of commissural V0V and V0D neurons led to a loss of walk, trot, and gallop, leaving bound as the default gait. Our study provides a benchmark for studies of the neuronal control of locomotion in the full range of speeds. It provides evidence that gait expression depends upon selection of different modules of neuronal ensembles.


Figures

Figure 1
Figure 1. Mice Exhibit Four Gaits
(A–D) Side views of mice showing a sequence of walk (A), trot (B), bound (C), and gallop (D) with indication of footprints of the hind- and the forelimbs below. The scale bars give time in ms. The square box in the bottom panel to the left indicates the order of the movements of the feet (Fls, forelimbs; Hls, hindlimbs). The circular plots below show the duration of the stance phase (filled bars) and swing phases (open bars), in percent of a normalized step cycle (mean ± SD). IFI, left forelimb, green; IHI, left hindlimb, black; rFI, right forelimb, blue; rHI, right hindlimb, red. (E) Mean (±SD) step frequency (walk [Hz]: 2.7 ± 0.7; trot: 5.9 ± 1.0; gallop: 9.8 ± 0.7; bound: 10 ± 0.4), stride length (walk [cm]: 3.4 ± 0.6; trot: 6.8 ± 0.8; gallop: 9.1 ± 0.5; bound: 9.8 ± 0.2), and speed (walk [m/s]: 0.09 ± 0.05; trot: 0.51 ± 0.09; gallop: 0.91 ± 0.8; bound: 1.0 ±0.05) for walk, trot, gallop, and bound (number of steps: walk, n = 66; trot, n = 174; gallop, n = 61; bound, n = 26). The mean for individual mice (n = 5) are represented in the graph by single points in each category. (F) Circular plots with the mean phase values between the IHI, the reference (black vector: phase value equals 0) and the right hindlimb (IHI-rHI; red vector), left forelimb (IHI-IFI; green vector), and the right forelimb (IHI-rFI; blue vector) for walk, trot, bound, and the different types of gallop. Gallop was sorted using the leading hindlimb into right and left gallop (right gallop: n = 11; left gallop: n = 40) and half-bound gallop (n = 10). Phase values of 0.5 correspond to strict alternation, whereas phase values of 0 or 1 correspond to strict synchrony. The length of the vector indicated the concentration of phase values around the mean. The dotted inner circles represent a significance level of p = 0.05. The limb coordination was significantly different during the different types of gallop (Watson and William’s test; p < 0.05). (G) Circular bar graphs of the stance phase in normalized step cycles during walk, trot, bound, and gallop. The mean phase values (obtained from values in F) set the onsets of the stance phases, and the duration of individual stance phases are obtained from data presented in the plots in the lower panel in (A), with specific color codes for the individual legs. The circular bar graphs only show the stance phase of the individual legs. The numbers correspond to order of movements of the feet (see A and B). See also Figure S1 and Movies S1, S2, S3, and S4.
Figure 2
Figure 2. Intra-limb Coordination during Different Gaits
(A) Stick diagrams of the left hindlimb during a typical step during walk (top), trot (second from top), gallop (second from bottom), and bound (bottom). The thigh is violet, the shank gray, and the foot magenta. (B) Mean ranges of angular excursions in degrees for walk, trot, gallop, and bound. Same color code for thigh, shank, and foot as in (A). (C) Mean angular excursion (±angular deviation) of each joint in the four gaits. Note the phenotypic changes from walk to trot to gallop/bound. Data were compared using Watson and Williams’s test (***p < 0.001). (D) Normalized angular excursions of thigh, shank, and foot for walk, trot, bound, and gallop plotted as a function of a normalized step cycle with stance indicated in gray and swing in white. The three segments are sequentially activated in the stance phase during walk, less so during trot, but not at all during gallop and bound, where a high degree of synchronous activity in both the stance and the swing phases is present (seen as an overlap between the curves).
Figure 3
Figure 3. Gait Transitions Happen Instantaneously
Consecutive steps showing gait switch from walk to trot (A), from gallop to trot (B), and from walk to gallop to walk (C). Each panel displays the instantaneous speed during each step (top) and the phase differences between homologous limbs (Fls, black circles; Hls, red circles), homolateral limbs (IHI-IFI: green triangles) and diagonal limbs (IHI-rFI: blue squares). In all graphs, the transition phases are indicated with a gray background. (AI–CIII) The dynamic of the gaits switches were analyzed by calculating the mean speed, the mean stride length, and the mean step frequency before, during, and after the transition phase. The switch from walk to trot (n = 14; N = 3) resulted in an increase in speed (AI) as a result of a significant increase in locomotor frequency (AIII) with retained stride length (AII). The switch from gallop to trot (n = 7; N = 3) was accompanied by a significant decrease in speed (BI) mediated by an abrupt decrease in step frequency (BIII) with no changes in stride length (BII). The switch from walk to gallop (n = 10; N = 3) was instantaneous with no transition steps signifying the abrupt increase in speed (CI), which was obtained by an significant increase in both the stride length (CII) and the frequency of locomotion (CIII). The switch from gallop to walk (n = 9; N = 3) required transition steps, and a significant decrease in speed (CI) was obtained by a decrease both in stride length (CII), and step frequency (CIII). All data show mean ± SEM and were compared using one-way ANOVA followed by Bonferroni’s post-test (*p < 0.05, **p < 0.01, and ***p < 0.001).
Figure 4
Figure 4. Trot Is Lost in Mice Lacking Excitatory V0V Commissural Interneurons
(A) V0v-ablated mice (Vglut-2::Cre; Dbx1-DTA) displayed hindlimb alternation (phase values around 0.5) at low frequencies of locomotion (n = 36; N = 3) and hindlimb synchronization (phase values around 0 or 1; n = 86; N = 3) at medium to high frequencies of locomotion. (B) Circular plots showing phase values of the rHI (red vector), the IFI (green vector), and rFI (blue vector) with respect to the reference IHI (black vector) for steps in (A). All the steps with hindlimb alternation displayed pattern of movement of the limbs typical of walk, whereas all the steps with hindlimb phase values around 0 or 1 displayed pattern of movement of the limbs typical of gallop (right, left, and half-bound gallop) or bound. Trot was never seen. (C) Mean values (±SD) for frequency (walk [Hz]: 2.7 ± 0.4; gallop: 4.9 ± 1.0; bound: 4.9 ± 0.7), stride length (walk [cm]: 4.8 ± 0.1; gallop: 4.9 ± 0.2; bound: 5.1 ± 0.1), and speed (walk [m/s]: 0.13 ± 0.04; gallop: 0.24 ± 0.05; bound: 0.25 ± 0.06) of locomotion obtained from data in (B). Note that gallop and bound appeared at much lower frequencies in V0V-ablated mice than in wild-type mice. The significant change in mean speed between walk and mean speed in gallop and bound was mainly obtained by changing the step frequency (one-way ANOVA followed by Bonferroni’s post-test; *p < 0.05; **p < 0.01; ***p < 0.001). (D) Circular bar plots of the stance (colored bars) and swing phase (open bars), expressed as % of a step cycle (mean ± SD) for the IHI (black), the rHI (red), the IFI (green), and the rFI (blue) during walk (top), left gallop (middle), and bound (bottom). (E) Step-cycle composition for the stance phase during walk, left gallop, and bound in V0V-ablated mice. The small number in the outer gray circle represents the sequence of activations of the limbs (same color code as in D). There was no aerial phase during gallop and bound in the V0V-ablated mice. (F) Stick diagrams of the left hindlimb during walk and bound in a V0V-ablated mouse. (G) Mean ranges of angular excursions in degrees during walk and bound plotted in circular plots (same color code as F). (H) Mean angular excursions (±angular deviation) for each segment in (G). The mean angular excursion increased for the thigh, but not for the shank and foot, when switching from walk to bound in the V0V-ablated animals. (I) Normalized angular excursions of thigh, shank, and foot for walk and bound plotted as a function of a normalized step cycle with stance indicated in gray and swing in white. The kinematic of the three segments is similar to wild-type mice with a sequential activation of the three segments during walk and a strict synchronization in each phase of the step cycle during bound. See also Figure S2 and Movies S5 and S6.
Figure 5
Figure 5. Walk, Trot, and Gallop Are Lost in Mice with Ablation of V0 Commissural Interneurons
(A) Phase values of hindlimbs plotted as a function of the step frequency in mice with selective loss of V0 neurons (E1Ngn2::Cre; Dbx1:DTA) showing synchronization of hindlimbs at all frequencies of locomotion (n = 107; N = 3). (B) Circular plots showing phase values for the rHI (red), the IFI (green), and rFI (blue) with respect to the reference IHI (black) for steps in (A). Walk and trot and left and right gallop were never seen. (C) Mean values (±SD) of step frequency (5 ± 0.18 Hz), stride length (4.4 ± 0.7 cm), and speed (0.22 ± 0.07 m/s) of locomotion. (D) Circular bar plots with stance (colored bars) and swing phase (open bars), expressed as % of a step cycle (mean ± SD) for the IHI (black vector), the rHI (red), the IFI (green), and the rFI (blue) for bound in V0-ablated animals. The mean stance phase duration is significantly longer than the one measured in bound for wild-type and V0V-ablated mice (one-way ANOVA followed by Bonferroni’s post-test; p < 0.001). (E) Step composition for the stance phase in bound. There was no typical aerial phase of bounding as seen in wild-type mice. (F) Stick diagrams of the left hindlimb during walk and bound in a V0-ablated mouse. (G) The mean range of angular excursion for the thigh, the shank, and the foot were measured. Same color code as in (F). (H) Mean angular excursions (±angular deviation) for each segment in (G). (I) Normalized angular excursions of thigh, shank, and foot for bound plotted as a function of a normalized step cycle with stance indicated in gray and swing in white. The activation of the three segments was typical of bound in wild-type animals with strong synchronous activation in both stance and swing phase. See also Figure S2 and Movie S7.
Figure 6
Figure 6. Coordination of Gallop Is Affected by the Presence of Walk and Trot
Hindlimb phase coordination during gallop in (A) wild-type and in (B) V0V-ablated (Vglut-2::Cre; Dbx1:DTA) mice and (C) bound in V0-ablated mice (E1Ngn2::Cre; Dbx1:DTA). Wild-type mice exhibited more diverse phase values (from −0.23 to 0.24; left; n = 51) than V0V-ablated mice (between −0.17 and 0.18; middle; n = 43). The mean phases for left and right gallop were 0.83 ± 0.011 and 0.12 ± 0.015, respectively, in wild-type mice and 0.92 ± 0.08 and 0.09 ± 0.007, respectively, in V0V-ablated mice. The mean phase values for left and right gallop are significantly different between wild-type and V0V-ablated mice (Watson and William’s test; p < 0.001). V0-ablated mice showed perfect synchronization of the hindlimb movements (0 ± 0.007; right; n = 88).

Similar articles

Cited by

References

    1. McLean DL, Fetcho JR. Spinal interneurons differentiate sequentially from those driving the fastest swimming movements in larval zebrafish to those driving the slowest ones. J Neurosci. 2009;29:13566–13577. - PMC - PubMed
    1. McLean DL, Masino MA, Koh IY, Lindquist WB, Fetcho JR. Continuous shifts in the active set of spinal interneurons during changes in locomotor speed. Nat Neurosci. 2008;11:1419–1429. - PMC - PubMed
    1. Ampatzis K, Song J, Ausborn J, El Manira A. Separate microcircuit modules of distinct v2a interneurons and motoneurons control the speed of locomotion. Neuron. 2014;83:934–943. - PubMed
    1. Talpalar AE, Bouvier J, Borgius L, Fortin G, Pierani A, Kiehn O. Dual-mode operation of neuronal networks involved in left-right alternation. Nature. 2013;500:85–88. - PubMed
    1. Crone SA, Quinlan KA, Zagoraiou L, Droho S, Restrepo CE, Lundfald L, Endo T, Setlak J, Jessell TM, Kiehn O, Sharma K. Genetic ablation of V2a ipsilateral interneurons disrupts left-right locomotor coordination in mammalian spinal cord. Neuron. 2008;60:70–83. - PubMed

Publication types