. 2015 Jun 1;25(11):1526-34.
doi: 10.1016/j.cub.2015.04.025. Epub 2015 May 7.

A convergent and essential interneuron pathway for Mauthner-cell-mediated escapes

Affiliations

A convergent and essential interneuron pathway for Mauthner-cell-mediated escapes

Alix M B Lacoste et al. Curr Biol. .

Abstract

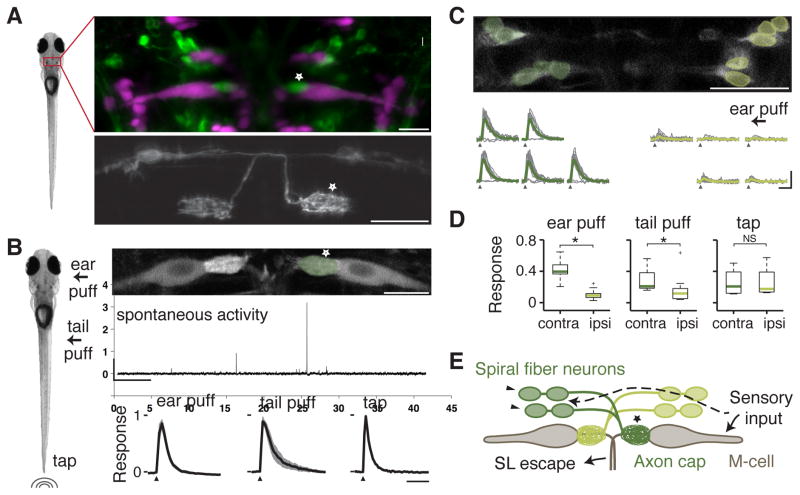
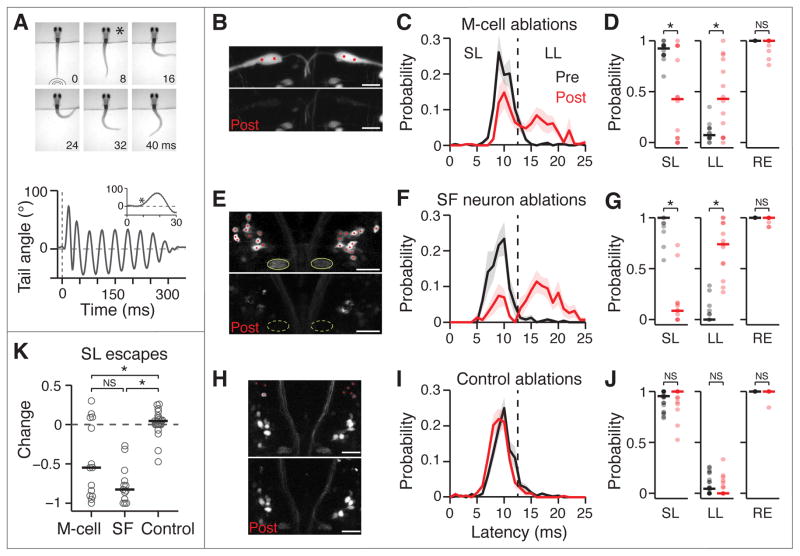
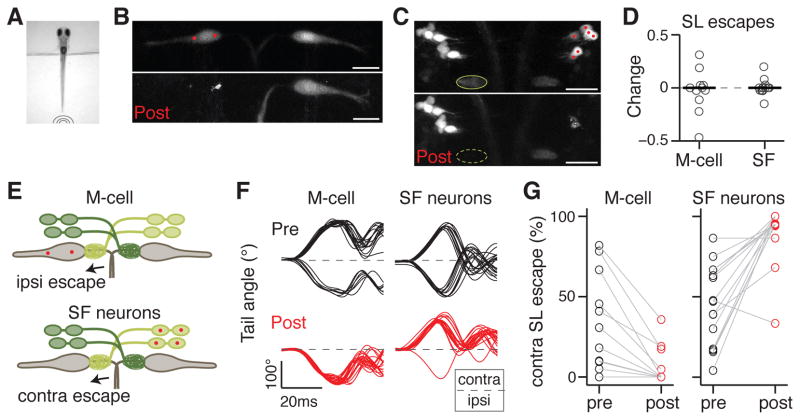
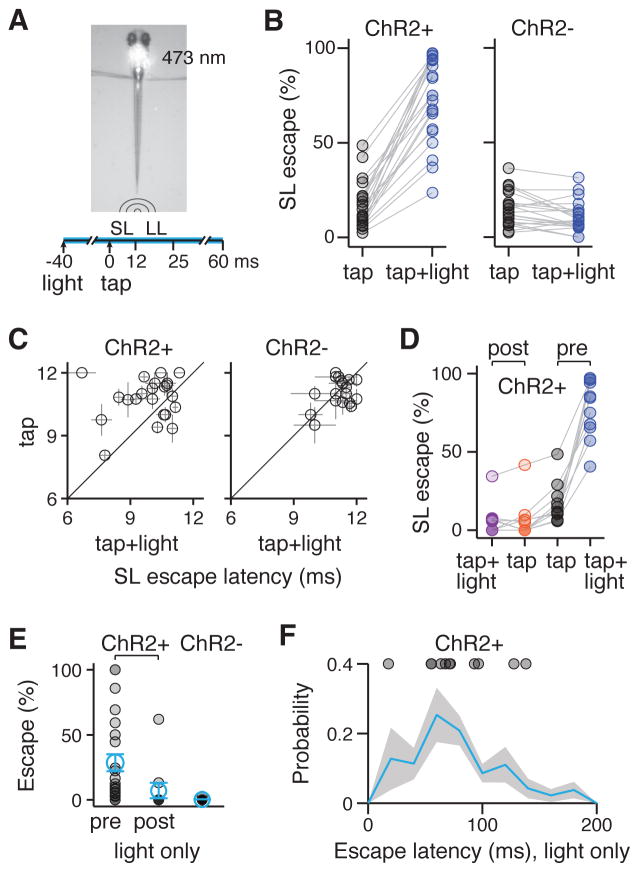
The Mauthner cell (M-cell) is a command-like neuron in teleost fish whose firing in response to aversive stimuli is correlated with short-latency escapes [1-3]. M-cells have been proposed as evolutionary ancestors of startle response neurons of the mammalian reticular formation [4], and studies of this circuit have uncovered important principles in neurobiology that generalize to more complex vertebrate models [3]. The main excitatory input was thought to originate from multisensory afferents synapsing directly onto the M-cell dendrites [3]. Here, we describe an additional, convergent pathway that is essential for the M-cell-mediated startle behavior in larval zebrafish. It is composed of excitatory interneurons called spiral fiber neurons, which project to the M-cell axon hillock. By in vivo calcium imaging, we found that spiral fiber neurons are active in response to aversive stimuli capable of eliciting escapes. Like M-cell ablations, bilateral ablations of spiral fiber neurons largely eliminate short-latency escapes. Unilateral spiral fiber neuron ablations shift the directionality of escapes and indicate that spiral fiber neurons excite the M-cell in a lateralized manner. Their optogenetic activation increases the probability of short-latency escapes, supporting the notion that spiral fiber neurons help activate M-cell-mediated startle behavior. These results reveal that spiral fiber neurons are essential for the function of the M-cell in response to sensory cues and suggest that convergent excitatory inputs that differ in their input location and timing ensure reliable activation of the M-cell, a feedforward excitatory motif that may extend to other neural circuits.


Conflict of interest statement

The authors declare no competing financial interest.

Figures

Figure 1
Figure 1. Spiral fiber neurons respond to aversive stimuli
A. Left image: 5 day old zebrafish larvae. Top image: Tg(-6.7FRhcrtR:gal4VP16); Tg(UAS:GCaMP5) labels spiral fiber neurons (arrowhead) among other neurons. The M-cell and other reticulospinal neurons are labeled with tetramethylrhodamine dextran by reticulospinal backfill. Spiral fiber neuron cell bodies are located in rhombomere 3 in two rostro-caudal (R↔C) clusters, approximately 25–40 μm rostral, 5–15 μm lateral, and 0–20 μm ventral of the axon cap. They all have axons descending contralaterally into the axon cap of the M-cell. Bottom image: Transient expression of membrane targeted GFP (UAS:GAP43-GFP) in Tg(-6.7FRhcrtR:gal4VP16) labels two spiral fiber neurons on the left and one spiral fiber neuron on the right that project to the contralateral M-cell axon cap (star). B. Left image: 3 different stimuli were delivered to paralyzed zebrafish larvae: water puffs directed at the right ear, water puffs directed at the right side of the tail, and non-directional taps delivered onto the dish holding the fish. Top image: Projection of two-photon image stack showing M-cells and spiral fiber neuron axon terminals labeled with the calcium indicator Tg(UAS:GCaMP-HS) driven by Et(fos:Gal4-VP16)s1181t and Tg(-6.7FRhcrtR:gal4VP16) respectively. Middle panel: Typical spontaneous activity in the spiral fiber neuron axon terminals. Scale bars: 5 min horizontally, 1 Δf/f vertically. Bottom panel: Mean response amplitude in the right spiral fiber neuron axon terminals for different stimuli: ear puffs (n = 7, left panel), tail puffs (n = 5, middle panel), and taps (n = 6, right panel). For each fish, the change in fluorescence (Δf/f) from trials in which the axon cap was active was normalized to the maximum Δf/f across trials, and then averaged. The black line is the mean across fish with the standard error of the mean (SEM) shaded. Stimulus delivery is indicated by an arrowhead. Horizontal scale bar: 2 sec. C. Top panel: Single recording plane showing spiral fiber neuron somata in Tg(-6.7FRhcrtR:gal4VP16); Tg(UAS:GCaMP-HS). Bottom panel: Mean Δf/f across trials in green and individual trials in grey for spiral fiber neuron somata from the top panel located on the left (dark green) and on the right (light green) responding to a water puff delivered to the right ear (arrow). Contralateral spiral fiber neurons respond to the stimulus, but ipsilateral spiral fiber neurons do not. Traces in which spiral fiber neurons on the left do not respond correspond to the same trials. Note that while caudal neurons seem to respond before rostral neurons, this is an artifact of the delay introduced by 2-photon line scanning. Scale bars: 2 sec horizontally, 2 Δf/f vertically. D. Boxplot showing the normalized response of spiral fiber neurons across fish. Response was defined as the area under the Δf/f curve over a 1.5 sec response window. This was normalized for each cell to the maximum response observed in a given experiment and then cells located on the contralateral (contra) and ipsilateral (ipsi) side with respect to the stimulus were averaged. Green lines are the medians across fish, box edges are the 25th and 75th percentiles, the whiskers extend to the most extreme data points not considered outliers, and crosses are outliers. Stimuli delivered: ear puffs (left panel, n = 10 fish, p = 2.5*10−4), tail puffs (middle panel, n = 10, p = 0.02), and taps (right panel, n = 4, p = 0.89). * denotes p < 0.05, NS not significant by Wilcoxon rank sum test. E. Model showing the M-cells receiving ipsilateral sensory input, which includes auditory/vestibular afferents onto the lateral dendrite. Our results suggest that spiral fiber neuron somata receive similar sensory information from the contralateral side. Pictures are oriented rostral up; scale bars: 20 μm; arrows point to spiral fiber neuron somata; a star indicates spiral fiber neuron terminals at the M-cell axon cap. Abbreviations: contra: contralateral; ipsi: ipsilateral; SL: short-latency. See also Figure S1 and Movie S1.
Figure 2
Figure 2. Loss of M-cells or spiral fiber neurons largely abolish short-latency escapes
A. Top image: Representative escape behavior of a head-embedded larval zebrafish responding to a tap stimulus. Images were recorded every millisecond and here every 8th image is shown. The first image was taken at the time the tap stimulus hit the dish holding the larvae. The image marked with a star corresponds to the beginning of the escape response (8 ms latency). Bottom panel: Representative smoothed tail trace showing the angle of the last tail segment with respect to the vertical in response to a tap. The escape behavior consists of a sharp angle C-bend, followed by a counter turn in the opposite direction and subsequent swimming lasting hundreds of milliseconds. The dotted line shows the stimulus. The inset shows the first 300 ms after stimulus onset and the star indicates the start of the C-bend. B–J. Results of M-cell ablations (B–D, n = 14 fish), spiral fiber (SF) neuron ablations (E–J, n = 13) and control ablations (H–J, n = 23) on the escape behavior in response to taps. B, E, H. Stack projections showing before (top image) and immediately after (B) or 24 hours after (E, H) two-photon laser-mediated bilateral ablations (bottom image). B. Et(fos:Gal4-VP16)s1181t; Tg(UAS:GCaMP-HS). E, H. Tg(-6.7FRhcrtR:gal4VP16); Tg(UAS:Kaede). Red dots mark the cells or location within the M-cell that were targeted for ablation. Green ovals in E mark the axon caps, which are no longer apparent 24 hours after ablations. High fluorescence cell debris can be observed in the post images. C, F, I. Escape probability as a function of latency of all escapes performed, mean +/- SEM, before ablations (black) and after (red). The dotted line at 13 ms demarcates short- (SL, ≦ 12 ms) and long-latency (LL, 13–25 ms) escapes. D, G, J. Probabilities of different types of responses as a function of all trials before (black) and after (red) ablations. Individual fish are displayed as semi-transparent dots and horizontal bars are the medians. Left: SL escapes; middle: LL escapes; right: overall responses (RE). M-cell: p = 0.013 pre vs. post (SL), 0.016 (LL) and 0.125 (RE); spiral fiber neuron: p = 2.4*10−4, 2.4*10−4, and 0.25; Control: p = 0.28, 0.20 and 1; Wilcoxon signed rank test. K. Change in SL escape probability as a function of all trials (post-pre) based on the SL data plotted in D, G, J. Individual fish (grey circles), median (black line). M-cell vs. spiral fiber neurons: p = 0.11; M-cell vs. Control: p = 0.011; spiral fiber neurons vs. Control: p = 1.6*10−6, Wilcoxon rank sum test. * denotes p < 0.05; NS not significant. Pictures are oriented rostral up; scale bars: 20 μm. Abbreviations: SF: spiral fiber; LS: short-latency; LL: long-latency; overall response. See also Figure S2.
Figure 3
Figure 3. Spiral fiber neurons are necessary for lateralized M-cell mediated escapes
A. Tail free larvae are presented with a non-directional tap stimulus as in Figure 2. B. Projection of two-photon image stack showing M-cells before (top image) and 24 hours after (bottom image) ablation of the M-cell on the left in Et(fos:Gal4-VP16)s1181t; Tg(UAS:Kaede). C. Projection of two-photon image stack showing spiral fiber neurons before (top image) and 24 hours after (bottom image) ablation of spiral fiber neuron somata located on the right in Tg(-6.7FRhcrtR:gal4VP16); Tg(UAS:Kaede). The axon cap (green oval) contralateral to the targeted spiral fiber neurons is no longer apparent 24 hours after ablations. D. Normalized change in short-latency (SL) escape probability as a function of all trials (post-pre/post+pre). Individual fish (grey circles) and median (black line). Left: M-cell ablation (n = 11). Right: spiral fiber neuron ablations (n = 17). The probability change is not significantly different from 0 in either condition (p = 0.67 and 0.98 respectively, Wilcoxon signed rank test). E. Model showing that when M-cells or spiral fiber neurons are ablated unilaterally, escapes in response to taps become strongly biased towards one direction: ipsilateral to the ablated M-cell or contralateral to the ablated spiral fiber neurons. F. Example tail traces for a fish before (top plots, black) and after (bottom plots, red) ablation of the left M-cell (left plots) and a fish before and after ablations of spiral fiber neuron somata on the right (right plots). The directionality of the initial tail bend is expressed as ipsilateral (ipsi) or contralateral (contra) with respect to the ablated soma(ta). Traces begin at the time of tap delivery. G. Probability of contralateral SL escapes as a function of all SL escapes of either direction. Left panel: M-cell ablation. Right panel: spiral fiber neuron ablations. Escapes shift toward the ipsilateral side for M-cell ablation, and to the contralateral side for spiral fiber neuron ablations. The laterality bias following M-cell or spiral fiber neuron ablation was not statistically distinguishable (p = 0.45, Wilcoxon rank sum test). Scale bars: 20 μm. Pictures are oriented rostral up. Abbreviations: SF: spiral fiber; LS: short-latency; contra: contralateral; ipsi: ipsilateral.
Figure 4
Figure 4. Activation of spiral fiber neurons enhances the probability of M-cell mediated escapes
A. 473 nm blue light is shone on the hindbrain of Tg(-6.7FRhcrtR:gal4VP16); Tg(UAS:ChR2(H134R)-EYFP) larvae using a focused laser beam for a total of 100 ms. 20–60 ms after the onset of the light, a low-intensity tap is delivered and tail movements are scored for short-latency (SL) or long-latency (LL) escapes. B. % SL escapes for individual fish in response to taps alone (black circles) and taps paired with blue light (blue circles). Left panel: ChR2+ fish (n = 22, 17% ± 4.9% tap, 73.4% ± 4.7% tap + light, mean ± SEM, corresponding to a 4.4 fold enhancement of SL escapes with blue light, p = 4.0*10−5). Right panel: ChR2- controls (n = 22, 15% ± 1.9% tap, 11% ± 1.7% tap + light, corresponding to a 1.4 fold decrease of SL escapes with blue light, p = 0.01, Wilcoxon signed rank test). C. SL escape latency in ms in response to taps (y-axis) or taps paired with blue light (x-axis) for individual fish tested (black circles). Left panel: ChR2+ fish (n = 22, 11 ms ± 0.22 ms tap, 9.9 ms ± 0.27 ms tap + light, mean ± SEM, p = 0.01). Right panel: ChR2- fish (n = 22, 11 ms ± 0.14 ms tap, 11 ms ± 0.13 ms ms tap + light, p = 0.72, Wilcoxon signed rank test). D. % SL escapes in response to taps or taps paired with light before (pre) or after (post) bilateral spiral fiber neuron ablations. (n = 11 ChR+ larvae, pre: 17% ± 3.7% tap, 78 ± 5.4% tap + light, mean ± SEM, corresponding to a 4.7-fold enhancement, p = 9.8*10−4; post: 6.3% ± 3.5% tap, 5.6 ± 2.9% tap + light, p = 0.58, Wilcoxon signed rank test). Data in the pre condition are a subset of the data in B. E. % Escapes for individual fish (black circles, mean ± SEM in blue) in response to blue light alone (in absence of taps). ChR2+ fish before (pre, n = 22) and after (post, n = 11) spiral fiber neuron ablations; ChR2- fish (n = 22). F. Distribution of escape latencies in ChR2+ after the onset of a 100 ms blue light pulse (blue line ± shaded SEM, n = 185 escapes, 11 fish). Circles represent the mean of escape latencies for larvae displaying >10 % probability of escapes (see E pre, n = 11). Note: to ensure that escapes to blue light alone could be disambiguated with escapes in response to taps paired with light, larvae that responded to blue light alone with mean escapes latencies <70 ms were tested with a 20 ms delay between taps and blue light, otherwise, 40 or 60 ms delays were used (see A). See also Supplemental Experimental Procedures. Abbreviations: ChR2: channelrhodopsin 2; LS: short-latency; LL: long-latency. See also Figure S3.

References

    1. Casagrand JL, Guzik AL, Eaton RC. Mauthner and reticulospinal responses to the onset of acoustic pressure and acceleration stimuli. J Neurophysiol. 1999;82:1422–1437. - PubMed
    1. Eaton RC, Lee RK, Foreman MB. The Mauthner cell and other identified neurons of the brainstem escape network of fish. Prog Neurobiol. 2001;63:467–485. - PubMed
    1. Pfaff DW, Martin EM, Faber D. Origins of arousal: roles for medullary reticular neurons. Trends Neurosci. 2012:1–9. - PubMed
    1. Zottoli SJ, Faber DS. The Mauthner Cell: What Has it Taught us? The Neuroscientist. 2000;6:26–38.
    1. Korn H, Faber DS. The Mauthner cell half a century later: a neurobiological model for decision-making? Neuron. 2005;47:13–28. - PubMed

Publication types

LinkOut - more resources