. 2015 Apr 17:8:14.
doi: 10.1186/s13072-015-0007-7. eCollection 2015.

Pan-cancer stratification of solid human epithelial tumors and cancer cell lines reveals commonalities and tissue-specific features of the CpG island methylator phenotype

Affiliations

Pan-cancer stratification of solid human epithelial tumors and cancer cell lines reveals commonalities and tissue-specific features of the CpG island methylator phenotype

Francisco Sánchez-Vega et al. Epigenetics Chromatin. .

Abstract

Background: The term CpG island methylator phenotype (CIMP) has been used to describe widespread DNA hypermethylation at CpG-rich genomic regions affecting clinically distinct subsets of cancer patients. Even though there have been numerous studies of CIMP in individual cancer types, a uniform analysis across tissues is still lacking.

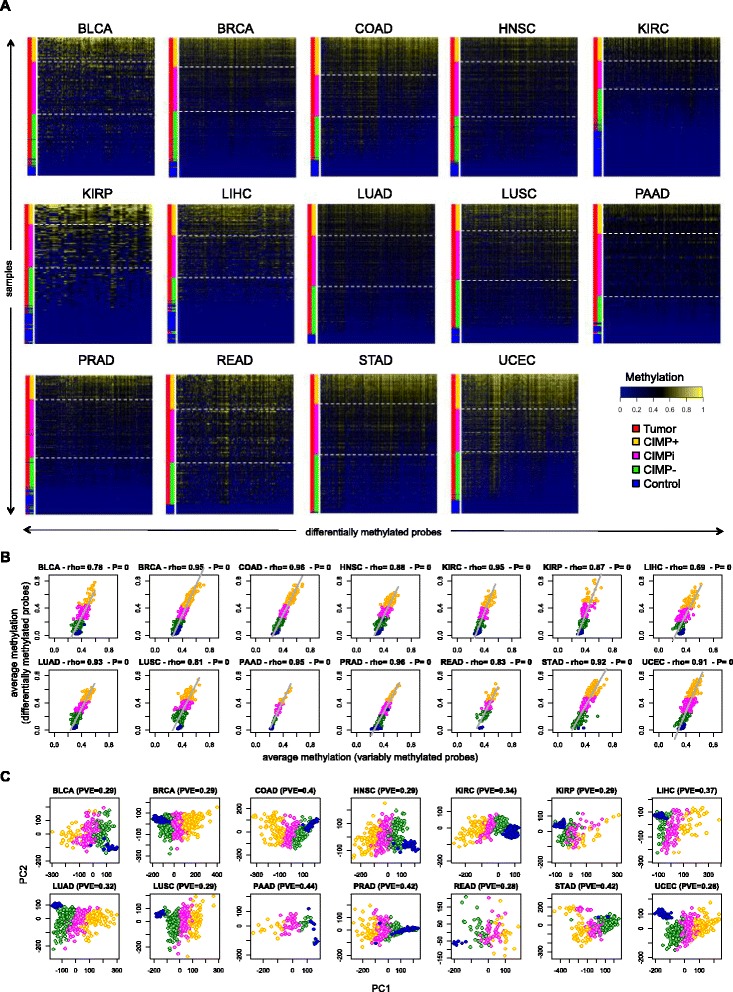
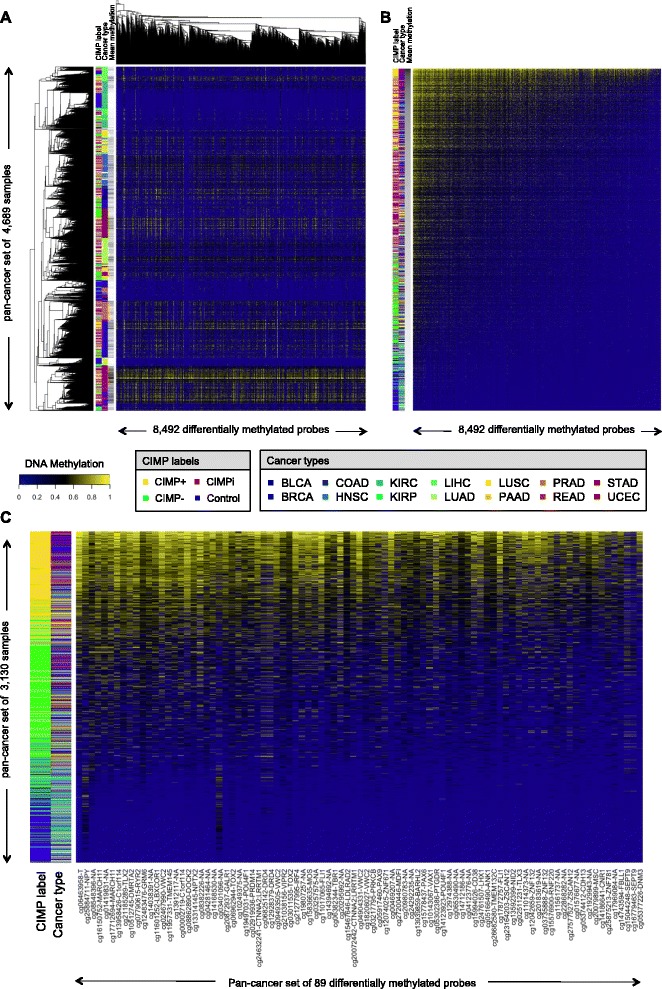
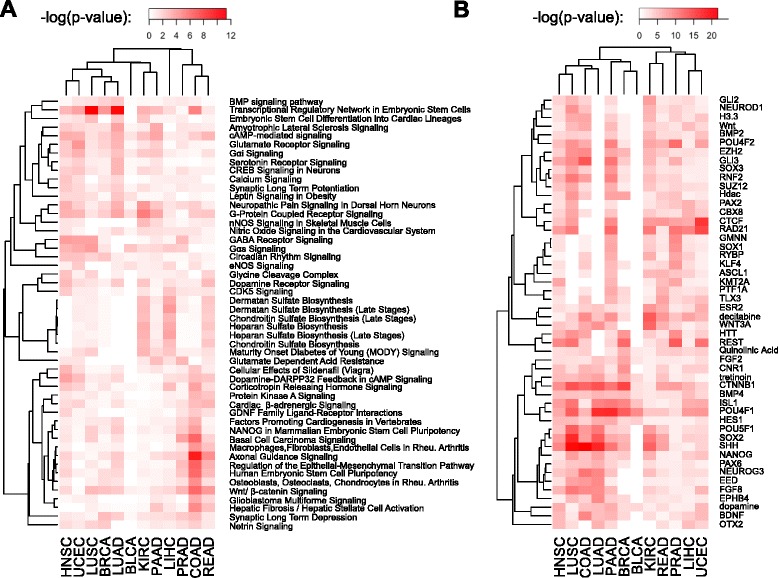
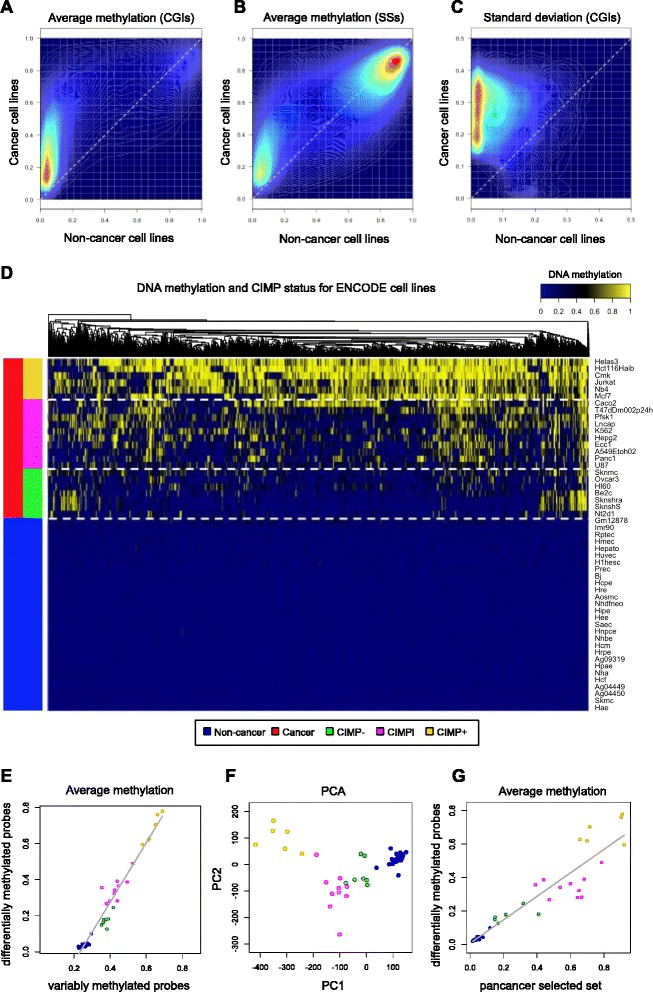
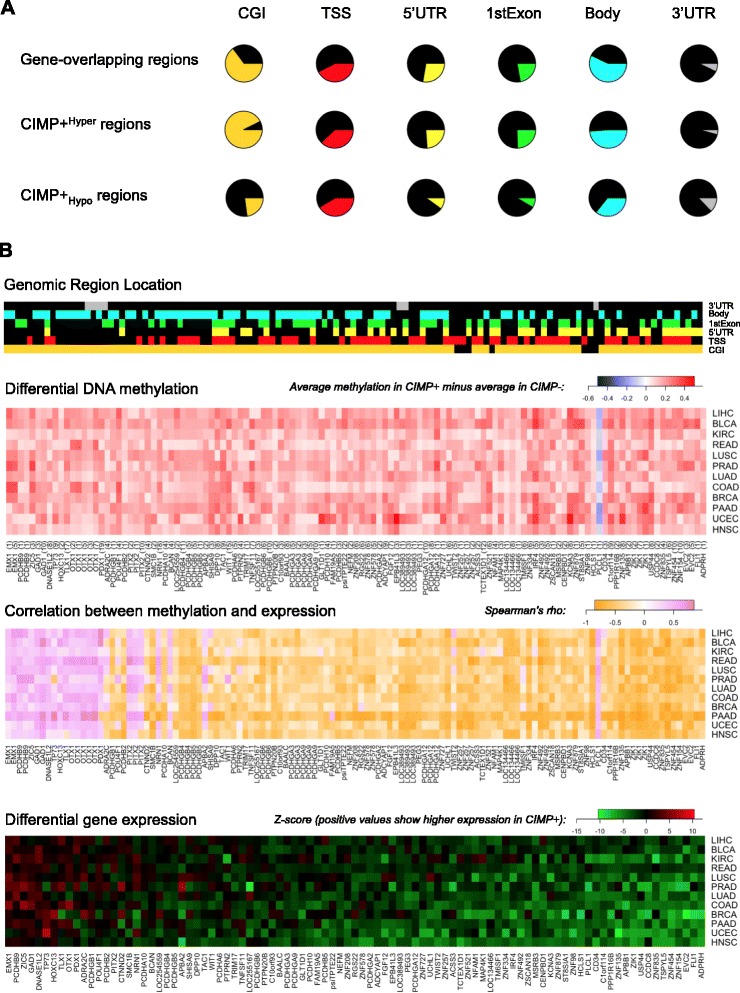
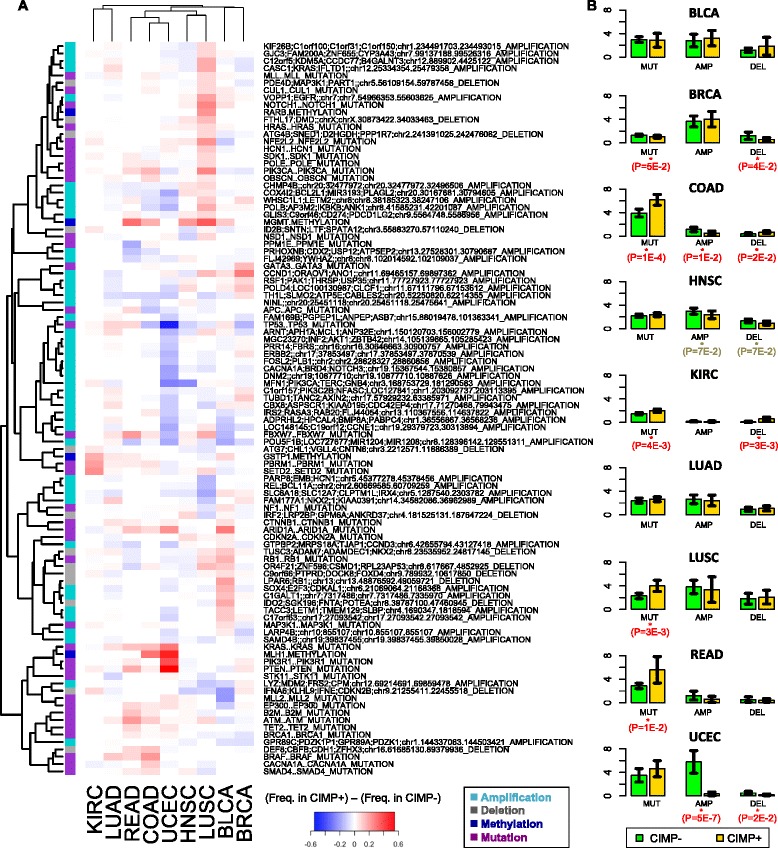
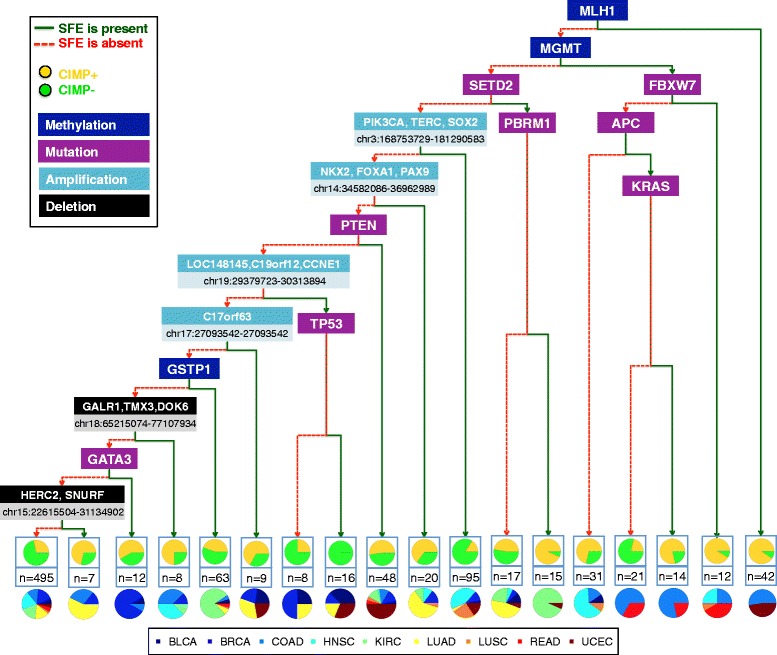
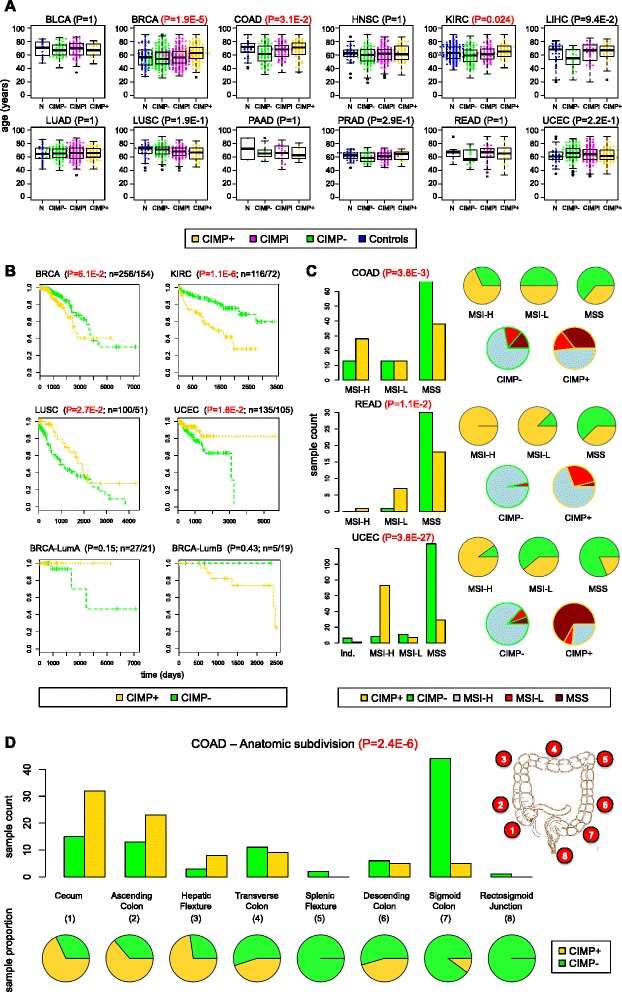
Results: We analyze genome-wide patterns of CpG island hypermethylation in 5,253 solid epithelial tumors from 15 cancer types from TCGA and 23 cancer cell lines from ENCODE. We identify differentially methylated loci that define CIMP+ and CIMP- samples, and we use unsupervised clustering to provide a robust molecular stratification of tumor methylomes for 12 cancer types and all cancer cell lines. With a minimal set of 89 discriminative loci, we demonstrate accurate pan-cancer separation of the 12 CIMP+/- subpopulations, based on their average levels of methylation. Tumor samples in different CIMP subclasses show distinctive correlations with gene expression profiles and recurrence of somatic mutations, copy number variations, and epigenetic silencing. Enrichment analyses indicate shared canonical pathways and upstream regulators for CIMP-targeted regions across cancer types. Furthermore, genomic alterations showing consistent associations with CIMP+/- status include genes involved in DNA repair, chromatin remodeling genes, and several histone methyltransferases. Associations of CIMP status with specific clinical features, including overall survival in several cancer types, highlight the importance of the CIMP+/- designation for individual tumor evaluation and personalized medicine.

Conclusions: We present a comprehensive computational study of CIMP that reveals pan-cancer commonalities and tissue-specific differences underlying concurrent hypermethylation of CpG islands across tumors. Our stratification of solid tumors and cancer cell lines based on CIMP status is data-driven and agnostic to tumor type by design, which protects against known biases that have hindered classic methods previously used to define CIMP. The results that we provide can be used to refine existing molecular subtypes of cancer into more homogeneously behaving subgroups, potentially leading to more uniform responses in clinical trials.

Keywords: CIMP; Cancer; CpG island methylator phenotype; DNA methylation; ENCODE; Pan-cancer; TCGA.


Figures

Figure 1
Figure 1
CIMP+ and CIMP− samples across cancer types. (A) Heat maps showing differentially methylated probes for each individual cancer type. Rows and columns represent samples and selected probes, respectively. Color side bars show tumor vs. control labels, as well as CIMP+, CIMPi, and CIMP− labels resulting from k-means clustering on the vector of average methylation values computed over differentially methylated sites. Rows were ranked from top to bottom in decreasing order of average methylation computed over selected probes. Columns were ordered horizontally using hierarchical correlational clustering. White dashed horizontal lines were used to highlight different subgroups based on CIMP status. (B) Average sample methylation computed over the sets of variably methylated probes (horizontal axes) vs. average sample methylation computed over the set of selected differentially methylated probes (vertical axes). For each plot, we provide the Spearman rho coefficient and the corresponding P-value. (C) PCA results where samples are projected onto the first two principal components. PCA was computed using data for all variably methylated probes within each cancer type. For each plot, we provide the corresponding percentage of variance explained (PVE) by the first two principal components. In panels (B) and (C), each point represents an individual sample and samples are colored according to their CIMP status, using the same color labels as in (A). THCA was excluded from the three panels because no differentially methylated probes had been selected for it.
Figure 2
Figure 2
Pan-cancer clustering of TCGA tumors based on DNA methylation levels. Heat maps show levels of DNA methylation for TCGA tumor and control samples. Samples were pooled together across 14 cancer types (all except THCA). Each row corresponds to a sample and each column corresponds to a probe. Color bars show the CIMP status and the cancer type associated to each sample. (A) Heat map showing results for CIMP+, CIMPi, CIMP−, and control samples over a reference pan-cancer set of 8,492 probes (obtained as the union of type-specific sets of differentially methylated probes). Rows and columns were ordered using hierarchical correlational clustering. (B) Same as panel (A), but rows and columns were ranked in decreasing order of average methylation, from top to bottom and from left to right, respectively. (C) Same as panel (B), but average levels of methylation were computed using our proposed panel of 89 pan-cancer differentially methylated loci. In panels (A) and (B), a third color bar shows the relative ranking of each sample in terms of average methylation, with black showing the most methylated sample and white showing the least methylated sample. In panel (C), CIMPi tumors were excluded to facilitate visual comparison of the CIMP+/− categories and, for probes associated to known genes, the actual gene or genes are included next to each probe identifier.
Figure 3
Figure 3
Canonical pathways and upstream regulators associated to selected differentially methylated sites across cancer types. (A) Enrichment of canonical pathways associated to genes that are interrogated by selected differentially methylated probes. (B) Enriched upstream regulators of selected probes. Heat map colors show –log(P-values), so that more intense red color corresponds to higher statistical significance. Each panel shows the top 50 scorers based on Fisher’s sum for combining P-values. Rows correspond to pathways or regulators, while columns correspond to different cancer types. Rows and columns were ordered using hierarchical correlational clustering.
Figure 4
Figure 4
Characterization of CIMP in ENCODE cell lines. (A) Density plot of average site methylation for variably methylated in-CGI probes in cancer vs. non-cancer cell lines. (B) Same plot for probes in CGI shores and shelves. (C) Density plot showing standard deviation for variably methylated sites. (D) Heat map showing results from the CIMP classification algorithm. (E) Average cell line methylation computed over selected differentially methylated probes vs. average methylation computed over variably methylated probes. (F) PCA results showing samples projected onto the first two principal components and colored according to their CIMP status. (G) Average cell line methylation computed over variably methylated probes (vertical axis) vs. average methylation computed over set of 89 pan-cancer selected differentially methylated probes (horizontal axis).
Figure 5
Figure 5
Differentially methylated regions and differentially expressed genes in CIMP+ relative to CIMP- samples from TCGA. (A) Proportion of gene-associated regions, CIMP + Hyper regions and CIMP + Hypo regions overlapping CGIs, TSSs, 5′ UTRs, first exons, gene bodies, and 3′ UTRs. (B) Differentially expressed genes exhibiting significant correlation with methylation at associated CIMP + Hyper or CIMP + Hypo regions. The 93 genes selected in the bottom panel overlapped at least one CIMP + Hyper or one CIMP + Hypo region and exhibited significant levels of Spearman correlation (FDR < 0.10) in all the 12 cancer types that we analyzed. Top color bars shows genomic locations of probes within each of the 120 CIMP + Hyper and 1 CIMP + Hypo regions overlapping one of those 93 genes. Top heat map shows differences in mean methylation for these 121 regions. Middle heat map shows values of Spearman correlation between methylation within these 121 regions and expression of the 93 associated genes. Bottom panel shows differential expression (Z-scores) for these 93 genes in CIMP+ vs. CIMP− samples, with red corresponding to genes with higher expression levels in CIMP+. Rows and columns in the bottom heat map were ordered according to average Z-score, decreasing from left to right and from top to bottom. Columns in the middle and top heat map were drawn so that genes associated to differentially methylated regions were shown in the same order as in the bottom heat map. Row order was also chosen to be the same as in the bottom heat map. The number of array probes located within each CIMP + Hyper or CIMP + Hypo region is shown in parentheses after the corresponding gene name below the differential methylation heat map.
Figure 6
Figure 6
Frequency of SFE occurrence in CIMP+ vs. CIMP− samples from TCGA. (A) The heat map shows frequency of occurrence in CIMP+ samples minus frequency in CIMP- samples for the top 100 SFEs with the greatest absolute variation across cancer types. Each row corresponds to a SFE and each column corresponds to a different cancer type. The color side bar shows the category associated to each SFE (amplification, deletion, mutation or methylation event). (B) Average number of mutations, amplifications and deletions per sample in different types of cancer. Error bars show 95% confidence intervals. Reported P-values were computed using a one sided t-test.
Figure 7
Figure 7
Pan-cancer partitioning of TCGA tumors using a binary classification tree. Pan-cancer binary tree for classification of tumor samples into the CIMP+ and the CIMP− categories. Red and green branches illustrate the absence or presence of the corresponding SFE, respectively. Terminal nodes show the number of samples and associated fractions of CIMP+ vs. CIMP− labels, as well as proportions of different cancer types represented in each subset.
Figure 8
Figure 8
Associations between CIMP status and clinical annotations. (A) Age vs. CIMP status across 12 cancer types. (B) Overall survival curves for the four cancer types exhibiting significant differences based on CIMP status (BRCA, KIRC, LUSC, UCEC) and overall survival curves for luminal A and luminal B subtypes in BRCA based on CIMP status. (C) Microsatellite instability vs. CIMP status in COAD, READ, and UCEC. (D) CIMP status as a function of anatomic subdivision in COAD. P-values come from a Kruskal-Wallis test for difference in medians in panel (A), a log-rank test for survival curve differences in panel (B), and Fisher’s exact test in panels (C) and (D). For each survival curve in (B), the number of CIMP−/CIMP+ samples is provided next to the corresponding P-value.

Similar articles

Cited by

References

    1. Robertson KD, Wolffe AP. DNA methylation in health and disease. Nat Rev Genet. 2000;1:11–9. doi: 10.1038/35049533. - DOI - PubMed
    1. Jaenisch R, Bird A. Epigenetic regulation of gene expression: how the genome integrates intrinsic and environmental signals. Nat Genet. 2003;33(Suppl):245–54. doi: 10.1038/ng1089. - DOI - PubMed
    1. Portela A, Esteller M. Epigenetic modifications and human disease. Nat Biotechnol. 2010;28:1057–68. doi: 10.1038/nbt.1685. - DOI - PubMed
    1. Baylin SB. Aberrant patterns of DNA methylation, chromatin formation and gene expression in cancer. Hum Mol Genet. 2001;10:687–92. doi: 10.1093/hmg/10.7.687. - DOI - PubMed
    1. Baylin SB, Jones PA. A decade of exploring the cancer epigenome - biological and translational implications. Nat Rev Cancer. 2011;11:726–34. doi: 10.1038/nrc3130. - DOI - PMC - PubMed