. 2015:2015:135787.
doi: 10.1155/2015/135787. Epub 2015 Apr 16.

Mathematical modeling of subthreshold resonant properties in pyloric dilator neurons

Affiliations

Mathematical modeling of subthreshold resonant properties in pyloric dilator neurons

Babak Vazifehkhah Ghaffari et al. Biomed Res Int. 2015.

Abstract

Various types of neurons exhibit subthreshold resonance oscillation (preferred frequency response) to fluctuating sinusoidal input currents. This phenomenon is well known to influence the synaptic plasticity and frequency of neural network oscillation. This study evaluates the resonant properties of pacemaker pyloric dilator (PD) neurons in the central pattern generator network through mathematical modeling. From the pharmacological point of view, calcium currents cannot be blocked in PD neurons without removing the calcium-dependent potassium current. Thus, the effects of calcium (I(Ca)) and calcium-dependent potassium (I(KCa)) currents on resonant properties remain unclear. By taking advantage of Hodgkin-Huxley-type model of neuron and its equivalent RLC circuit, we examine the effects of changing resting membrane potential and those ionic currents on the resonance. Results show that changing the resting membrane potential influences the amplitude and frequency of resonance so that the strength of resonance (Q-value) increases by both depolarization and hyperpolarization of the resting membrane potential. Moreover, hyperpolarization-activated inward current (I(h)) and I(Ca) (in association with I(KCa)) are dominant factors on resonant properties at hyperpolarized and depolarized potentials, respectively. Through mathematical analysis, results indicate that I h and I(KCa) affect the resonant properties of PD neurons. However, I(Ca) only has an amplifying effect on the resonance amplitude of these neurons.


Figures

Figure 1
Figure 1
Conductance-based model of PD neuron. Dashed box denotes the individual ionic channels, that is, Ca (calcium channels (CaT and CaS)), h (hyperpolarization-activated channel), and KCa (calcium-dependent potassium channel).
Figure 2
Figure 2
Equivalent model of first group of ionic channels. The model of (a) CaT-, (b) CaS-, and (c) h-channels (all left traces). The equivalent RL circuit model of (a) CaT-, (b) CaS-, and (c) h-channels (all right traces) for small input perturbation. The details of each component in the equivalent circuit models are shown in Appendix A.1, A.2, and A.3.
Figure 3
Figure 3
Equivalent model of first group of ionic channels. The model of (a) CaT-, (b) CaS-, and (c) h-channels (all left traces). The equivalent RL circuit model of (a) CaT-, (b) CaS-, and (c) h-channels (all right traces) for small input perturbation. The details of each component in the equivalent circuit models are shown in Appendix A.1, A.2, and A.3.
Figure 4
Figure 4
Equivalent electrical RLC circuit for a compartmental neuron model with CaT-, CaS-, h-, and KCa-channels.
Figure 5
Figure 5
Comparison between the HH-type model and the equivalent RLC circuit model. (a) The voltage response and impedance profile of HH-type model under control condition. (b) The voltage response and impedance profile of equivalent RLC circuit model.
Figure 6
Figure 6
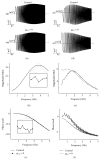
The roles of I h and I Ca in membrane resonance of PD neurons. (a) Control condition. (b) Blocking I Ca mainly affected the upper envelope of the voltage profile. (c) Blocking I h dramatically changed the lower envelope of voltage profile. The local minimum value disappeared after blocking I h.
Figure 7
Figure 7
The response of HH-type model to the Chirp input. (a) The voltage response at the resting membrane potential of −59 mV (left trace) and −55 mV (right trace). The peak-to-peak amplitude of voltage response is reduced and shifted to right by decreasing the resting membrane potential. (b) Impedance magnitude. Both the maximum impedance magnitude (|Z|max⁡) and resonance frequency (f res) depend on the resting membrane potential. (c) Three-dimensional plot showing the impedance magnitude plot (Z-f curve) at different resting potentials. (d) The values of Q-factor at different resting potentials.
Figure 8
Figure 8
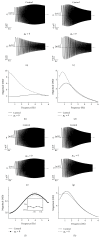
Effects of removing g h on resonance at different resting potentials. (a) Voltage response to the Chirp input at the hyperpolarized resting potential (−80 mV) under control condition (upper trace) and after removing g h (lower trace). (b) Impedance magnitude, as a function of frequency. At hyperpolarized resting potential, both the impedance magnitude (|Z|max⁡) and resonance frequency (f res) disappeared by removing g h. (c) In the phase profile, the resonant property is removed by removing g h at hyperpolarized resting potential. (d) Voltage response at the depolarized resting potential (−53 mV) under control condition (upper trace) and after removing g h (lower trace). (e) At depolarized resting potential, by removing g h, the impedance magnitude is increased and resonance frequency is transferred to the lower frequencies. (f) In the phase profile, the resonant property is decreased at depolarized resting potential. The fluctuating form of phase curve is caused by ionic channels properties (high nonlinearity of HH-type dynamics of PD neurons).
Figure 9
Figure 9
Effects of removing g Ca on resonance at different holding potentials. Removing g Ca has no effect on (a) voltage response, (b) impedance magnitude, or (c) phase profile at hyperpolarized membrane potentials. However, at depolarized membrane potentials removing g C, (d) abolish the resonance in upper trace of voltage response and also manipulate the lower trace. Removing g Ca also mainly removes the resonance in (e) impedance. It means that these channels are dominant factor in resonance at depolarized voltages. (f) Removing g Ca decreases the resonant properties of phase at depolarized voltages. The fluctuating form of phase curve (f) is caused by ionic channels properties (high nonlinearity of HH-type dynamics of PD neurons).
Figure 10
Figure 10
The effects of removing h- and Ca2+-channels on resonance at different resting membrane potentials for equivalent RLC circuit model. (a) The voltage responses at the hyperpolarized resting membrane potential (−80 mV) for control condition (upper trace) and without h-channel (lower trace). (b) The impedance magnitude at the hyperpolarized resting membrane potential (−80 mV) for control condition (solid line) and without h-channel (dashed line). (c) At the depolarized resting membrane potential (−53 mV), the voltage response for control condition (upper trace) and without h-channel (lower trace). (d) The impedance magnitude at the depolarized resting membrane potential (−80 mV) for control condition (solid line) and without h-channel (dashed line). For removing Ca2+-channel, at hyperpolarized resting membrane potential (−80 mV), (e) the voltage response for control condition (upper trace) and without Ca2+-channel (lower trace) and (f) impedance magnitude for control condition (solid line) and without h-channel (circles). At depolarized resting membrane potential (−53 mV), (g) the voltage response for control condition (upper trace) and without Ca2+-channel (lower trace), and (h) impedance magnitude for control condition (solid line) and without Ca2+-channel (dashed line).
Figure 11
Figure 11
The effect of h-channel on the resonance in the equivalent RLC circuit model. (a) Voltage response for control condition (left trace), for g h = 0.1 mS/cm2 (middle trace) and for g h = 0.3 mS/cm2 (right trace). (b) Impedance magnitude for control condition (solid line), for g h = 0.1 mS/cm2 (dashed line) and for g h = 0.3 mS/cm2 (broken line). (c) Phase profile for control condition (solid line), for g h = 0.1 mS/cm2 (dashed line) and for g h = 0.3 mS/cm2 (broken line).
Figure 12
Figure 12
The effects of changing g Ca and g KCa in the equivalent RLC circuit model. (a) Voltage response for control condition. By decreasing g Ca and g KCa, the resonance property of voltage response is abolished (both (b) and (e) upper trace of voltage responses). In contrast, by increasing g Ca and g KCa, the resonance property of voltage response is magnified (both (b) and (e) lower trace of voltage responses). In impedance profile, by increasing g Ca and g KCa, the impedance magnitude is increased (because of amplifying roles of g Ca) and the resonance frequency (f res) moved right because of the resonating role of g KCa ((c) and (f)). The impedance phase shows positive phase area in control condition. The positive area increases by increasing g Ca and g KCa ((d) and (g)).

References

    1. Hermann L. Beiträge zur Physiologie und Physik des Nerven. Archiv für die Gesamte Physiologie des Menschen und der Tiere. 1905;109(3-4):95–144. doi: 10.1007/bf01677961. - DOI
    1. Mauro A., Conti F., Dodge F., Schor R. Subthreshold behavior and phenomenological impedance of the squid giant axon. Journal of General Physiology. 1970;55(4):497–523. doi: 10.1085/jgp.55.4.497. - DOI - PMC - PubMed
    1. Koch C. Cable theory in neurons with active, linearized membranes. Biological Cybernetics. 1984;50(1):15–32. doi: 10.1007/BF00317936. - DOI - PubMed
    1. Lampl I., Yarom Y. Subthreshold oscillations and resonant behavior: two manifestations of the same mechanism. Neuroscience. 1997;78(2):325–341. doi: 10.1016/s0306-4522(96)00588-x. - DOI - PubMed
    1. Puil E., Meiri H., Yarom Y. Resonant behavior and frequency preferences of thalamic neurons. Journal of Neurophysiology. 1994;71(2):575–582. - PubMed

Substances

LinkOut - more resources