Clinical Trial
. 2015 May 11;10(5):e0125954.
doi: 10.1371/journal.pone.0125954. eCollection 2015.

A Phase I Double Blind, Placebo-Controlled, Randomized Study of the Safety and Immunogenicity of an Adjuvanted HIV-1 Gag-Pol-Nef Fusion Protein and Adenovirus 35 Gag-RT-Int-Nef Vaccine in Healthy HIV-Uninfected African Adults

Affiliations
Clinical Trial

A Phase I Double Blind, Placebo-Controlled, Randomized Study of the Safety and Immunogenicity of an Adjuvanted HIV-1 Gag-Pol-Nef Fusion Protein and Adenovirus 35 Gag-RT-Int-Nef Vaccine in Healthy HIV-Uninfected African Adults

Gloria Omosa-Manyonyi et al. PLoS One. .

Abstract

Background: Sequential prime-boost or co-administration of HIV vaccine candidates based on an adjuvanted clade B p24, RT, Nef, p17 fusion protein (F4/AS01) plus a non-replicating adenovirus 35 expressing clade A Gag, RT, Int and Nef (Ad35-GRIN) may lead to a unique immune profile, inducing both strong T-cell and antibody responses.

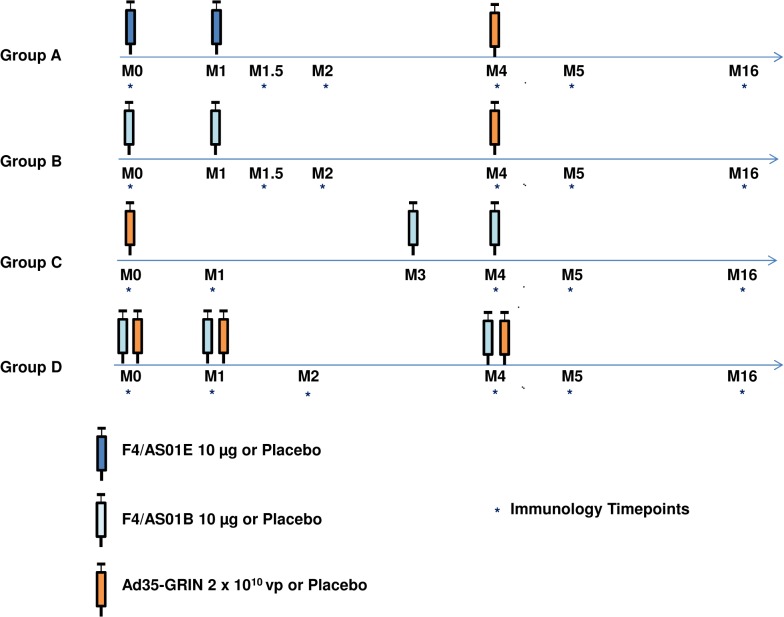
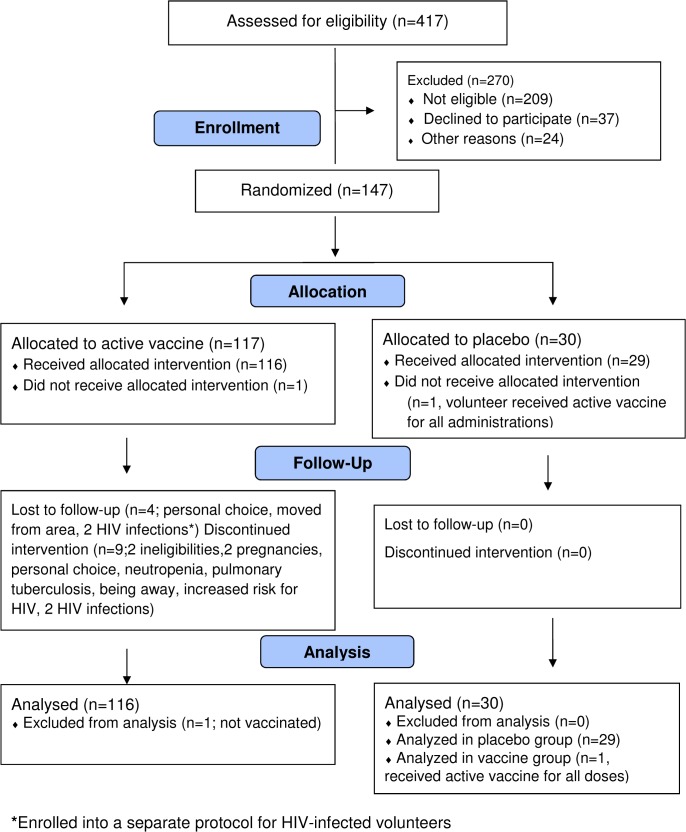
Methods: In a phase 1, double-blind, placebo-controlled trial, 146 healthy adult volunteers were randomized to one of four regimens: heterologous prime-boost with two doses of F4/AS01E or F4/AS01B followed by Ad35-GRIN; Ad35-GRIN followed by two doses of F4/AS01B; or three co-administrations of Ad35-GRIN and F4/AS01B. T cell and antibody responses were measured.

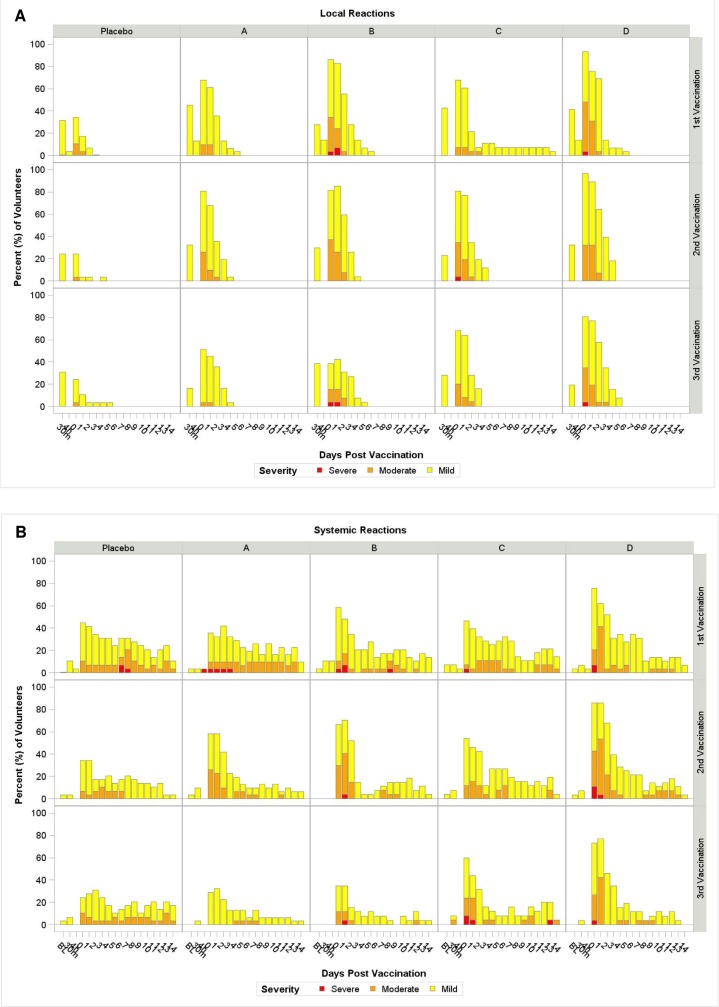
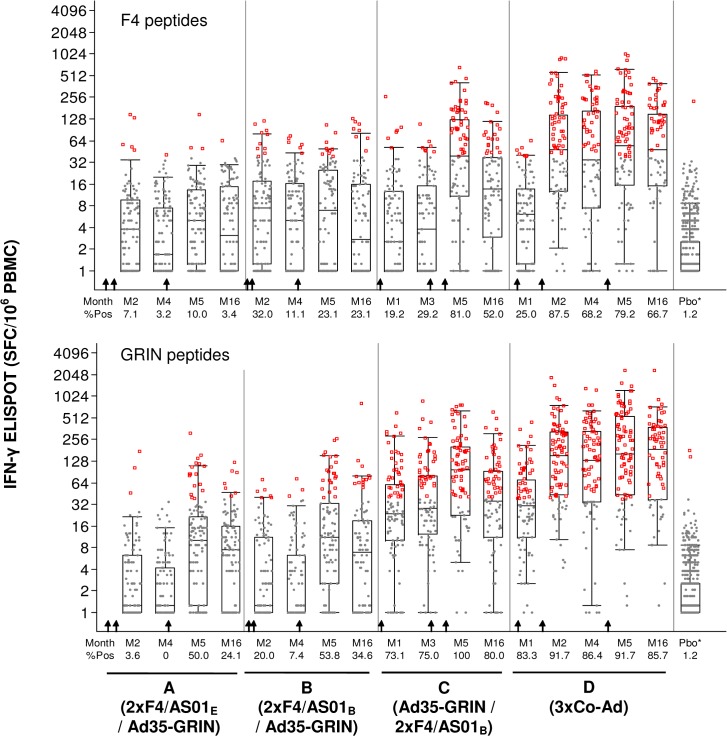
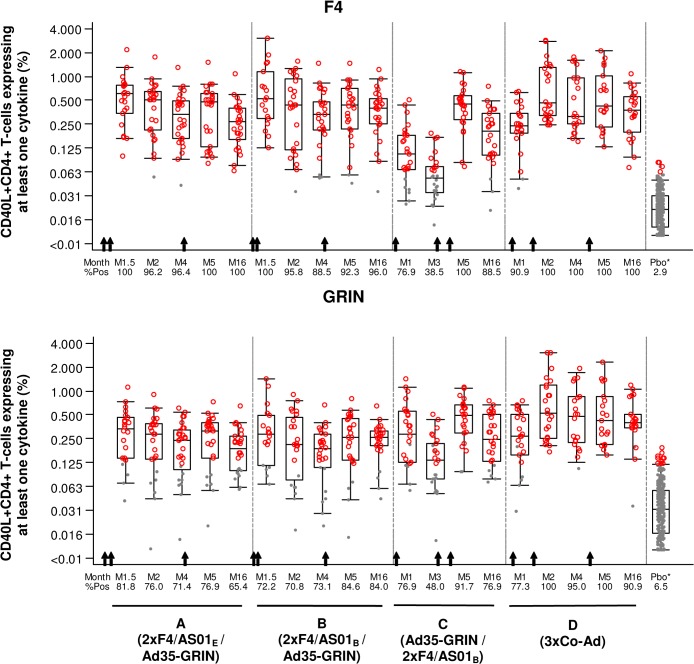
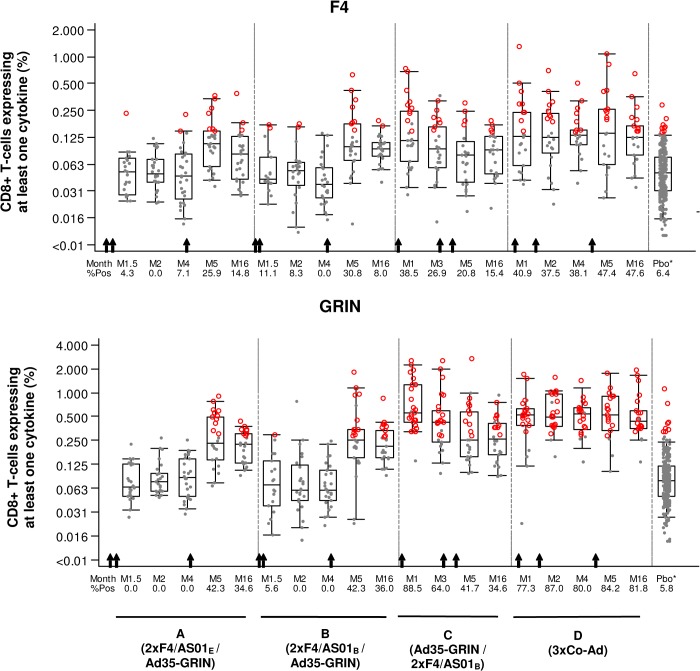
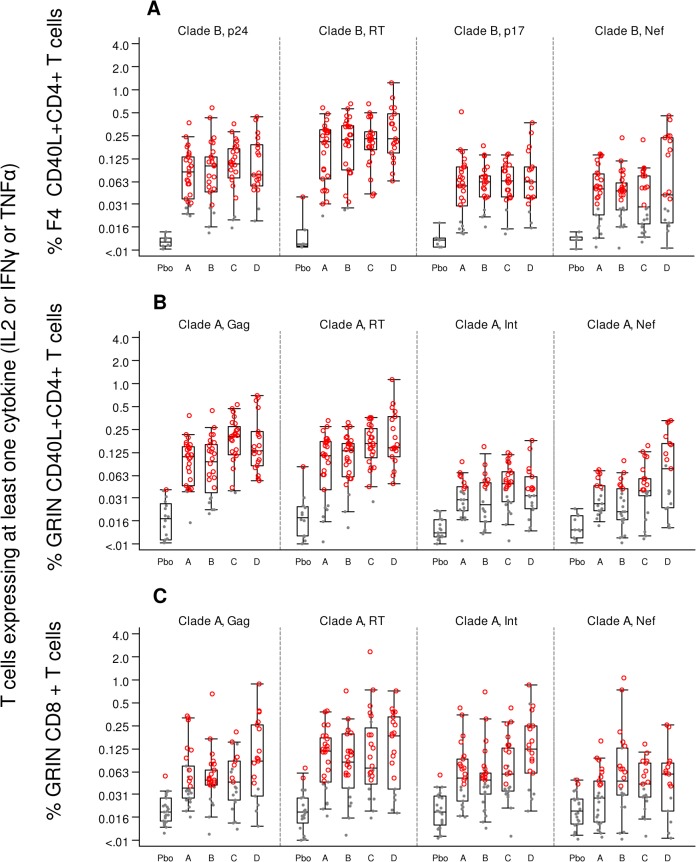
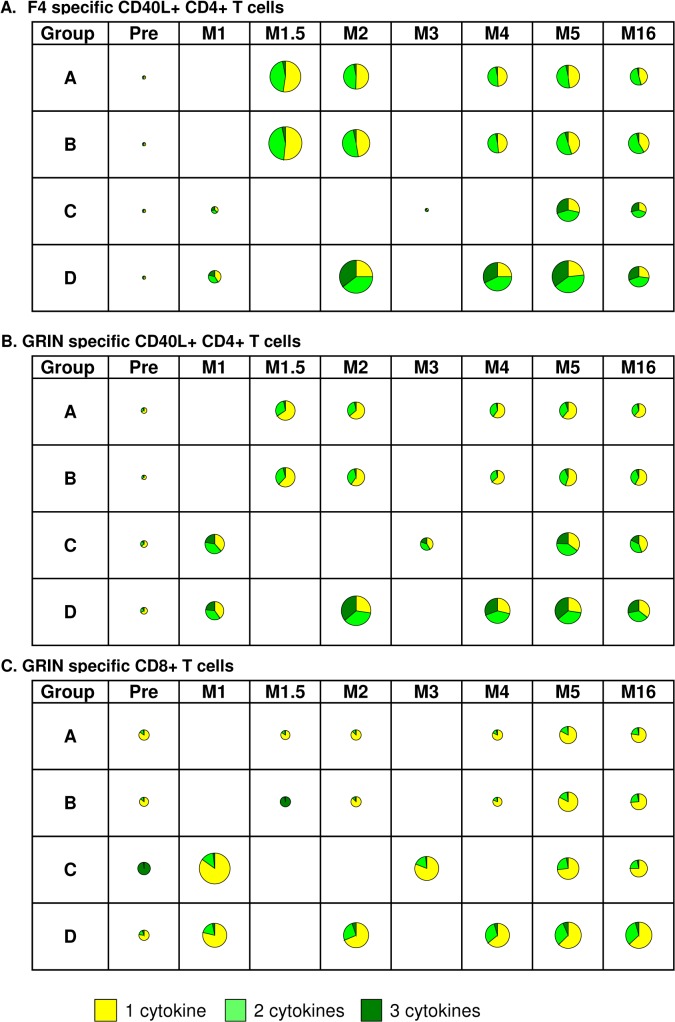
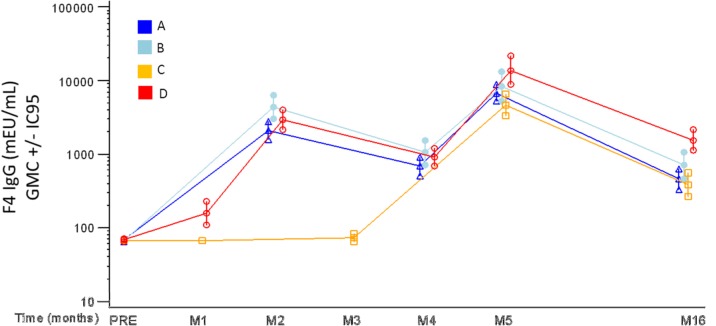
Results: The vaccines were generally well-tolerated, and did not cause serious adverse events. The response rate, by IFN-γ ELISPOT, was greater when Ad35-GRIN was the priming vaccine and in the co-administration groups. F4/AS01 induced CD4+ T-cells expressing primarily CD40L and IL2 +/- TNF-α, while Ad35-GRIN induced predominantly CD8+ T-cells expressing IFN-γ +/- IL2 or TNF-α. Viral inhibition was induced after Ad35-GRIN vaccination, regardless of the regimen. Strong F4-specific antibody responses were induced. Immune responses persisted at least a year after the last vaccination. The complementary response profiles, characteristic of each vaccine, were both expressed after co-administration.

Conclusion: Co-administration of an adjuvanted protein and an adenovirus vector showed an acceptable safety and reactogenicity profile and resulted in strong, multifunctional and complementary HIV-specific immune responses.

Trial registration: ClinicalTrials.gov NCT01264445.


Conflict of interest statement

Competing Interests: Dagna Laufer, Gwynn Stevens, Emmanuel Cormier, Kristen Syvertsen, Devika Zachariah, Kamaal Anas, Eddy Sayeed, Angela Lombardo, Jill Gilmour, Josephine Cox, Patricia Fast and Frances Priddy are or were employees of IAVI at the time of the study. IAVI has development rights for the Ad35-GRIN product. Patent name HIV-1 Clade A Consensus Sequences, Antigens and Transgenes. Patent umber US 8,119,144 B2. UPDATED PATENT INFO; François Roman, Patricia Bourguignon and Alix Collard are employees of GSK group of companies, which owns the rights to the F4 and AS01 products and whose company provided funding towards this study. Marguerite Koutsoukos and Gerald Voss are employees of the GSK group of companies. They both own shares in GSK and are listed as inventors on patents owned by GSK. Patent name for AS01: Compositions comprising QS21 and 3D-MPL. Patent numbers US W094/000153 (US5750110, US7147862). Patent name for F4: F4 constructs. Patent number WO06/013106 (US7612173). Jim Ackland is an employee of Global BioSolutions. There are no further patents, products in development or marketed products to declare. This does not alter the authors' adherence to all the PLOS ONE policies on sharing data and materials.

Figures

Fig 1
Fig 1. Study Schema.
Enrolled volunteers were randomized to one of the 4 regimens (groups A, B, C, or D), with approximately 28 vaccine and 7 placebo recipients per group, receiving 0.5 mL (F4/AS01E or F4/AS01B) and/or 1.0 mL (Ad35-GRIN) injections of vaccine or placebo. Vaccinations were given at baseline, month 1 (M1) or month 3 (M3), and month 4 (M4).
Fig 2
Fig 2. CONSORT Flow Diagram.
Number of individuals assessed for eligibility, enrolled and randomized to study vaccine(s) and respective placebo, followed-up and analyzed.
Fig 3
Fig 3. Time Course of Local and Systemic Reactions by group.
The Y-axis represents the percentage of volunteers experiencing reactogenicity events. Panel A for local reactions and panel B for systemic reactions post first, second and third vaccinations with upper, middle and lower rows respectively for each group. The X-axis represents the days of occurrence of the events, Day 0 being the day of vaccination. Volunteers did a self-assessment of reactogenicity with a memory card on Day 0 (evening of vaccination) and daily through Day 14. The figure shows the maximum severity assessment grade recorded as per the volunteer’s and clinic’s assessments combined. The severity grade of the reactogenicity events is indicated by color codes (mild: yellow; moderate: orange; severe: red).
Fig 4
Fig 4. IFN-γ ELISPOT Response Magnitude to Any F4 and GRIN Antigens by Time Post Vaccination and Dose Groups.
The y-axis shows the SFC/106 PBMC on a half-log scale and the x-axis shows the time points post vaccination in months (M). A. F4 (any of p24+RT+Nef+p17 peptide pools) and B. GRIN (any of Gag+RT+Int+Nef peptides pools). Gray dots: response below the cut-off to any of the 8 peptide pools; red circles: response above the cut-off to any of the 8 peptide pools. For the vaccine groups, the overlaid box plot summarizes the overall responses (i.e., the median, 1st and 3rd quartiles and Percentile 95th). All baseline and placebo (Pbo*) groups are combined in the far right box plot. The arrows indicate when the vaccines were given for each group (lower X-axis).
Fig 5
Fig 5. Kinetics of CD40L+CD4+ T-cell responses.
The magnitude of the CD4+ T cells expressing CD40L and at least one cytokine among IL-2, TNF-α and IFN-γ is shown for A. F4 (any of p24+RT+Nef+p17 peptide pools) and B. GRIN (any of Gag+RT+Int+Nef peptides pools). M: Months. Gray dots: response below the cut-off to any of the 8 peptide pools; red circles: response above the cut-off to any of the 8 peptide pools. All baseline and placebo (Pbo*) groups are combined in the far right box plot. The arrows indicate when the vaccines were given for each group (lower X-axis).
Fig 6
Fig 6. Kinetics of CD8+ T cell responses.
The magnitude of the CD8+ T cells expressing at least one cytokine among IL-2, TNF-α and IFN-γ is shown for A. F4 (any of p24+RT+Nef+p17 peptide pools) and B. GRIN (any of Gag+RT+Int+Nef peptides pools). M: Months. Gray dots: response below the cut-off to any of the 8 peptide pools; red circles: response above the cut-off to any of the 8 peptide pools. All baseline and placebo (Pbo*) groups are combined in the far right box plot. The arrows indicate when the vaccines were given for each group (lower X-axis).
Fig 7
Fig 7. CD4 and CD8 responses to individual peptide pools 4 weeks after last vaccine (M5).
The y-axis shows the magnitude of CD4+ and CD8+T-cells on a half-log scale across groups A-D for A. individual F4-specific CD40L+CD4+ T cell responses (clade B p24, RT, Nef and p17 peptide pools); B. individual GRIN-specific CD40L+CD4+ T cell responses (clade A Gag, RT, Int and Nef peptide pools) and C. individual GRIN-specific CD8+ T cell responses (clade A Gag, RT, Int and Nef peptide pools). The overlaid box-and-whisker plot summarizes the overall responses (i.e., the median, 1st and 3rd quartiles and 5th, 95th Percentiles). Pbo; placebo groups were combined across groups A-D.
Fig 8
Fig 8. Multifunctional CD4+ and CD8+ T-cell responses.
The diameter of each pie is scaled according to the magnitude (geometric mean). The pie charts represent A. CD40L+ CD4+ T cells expressing one, two or three cytokines to F4 (p24-RT-Nef- p17) peptide pools across groups A-D; B. CD40L+ CD4+ T cells expressing one, two or three cytokines to GRIN (Gag-RT-Int-Nef) peptide pools across groups A-D CD8+ T cells expressing one, two or three cytokines to GRIN (Gag-RT-Int-Nef) peptides pools across groups A-D and C. CD8+ T cells expressing one, two or three cytokines to GRIN (Gag-RT-Int-Nef) peptides pools across groups A-D. M: Months, Pre: pre-vaccination.
Fig 9
Fig 9. Kinetics of Humoral immune responses against the F4 fusion protein.
Anti-F4 IgG antibody concentrations measured by ELISA expressed as geometric mean concentration (GMC) in mEU/ml across groups A-D. Group A = 2xF4/AS01E / Ad35-GRIN, B = 2xF4/AS01B / Ad35-GRIN, C = Ad35-GRIN / 2xF4/AS01B and D = 3xCo-Ad. M = months.

References

    1. McDermott AB, Koup RA. CD8(+) T cells in preventing HIV infection and disease. AIDS. 2012;26(10):1281–92. Epub 2012/03/24. 10.1097/QAD.0b013e328353bcaf . - DOI - PubMed
    1. Koup RA, Safrit JT, Cao Y, Andrews CA, McLeod G, Borkowsky W, et al. Temporal association of cellular immune responses with the initial control of viremia in primary human immunodeficiency virus type 1 syndrome. J Virol. 1994;68(7):4650–5. - PMC - PubMed
    1. Saez-Cirion A, Lacabaratz C, Lambotte O, Versmisse P, Urrutia A, Boufassa F, et al. HIV controllers exhibit potent CD8 T cell capacity to suppress HIV infection ex vivo and peculiar cytotoxic T lymphocyte activation phenotype. Proceedings of the National Academy of Sciences of the United States of America. 2007;104(16):6776–81. 10.1073/pnas.0611244104 - DOI - PMC - PubMed
    1. Saez-Cirion A, Sinet M, Shin SY, Urrutia A, Versmisse P, Lacabaratz C, et al. Heterogeneity in HIV suppression by CD8 T cells from HIV controllers: association with Gag-specific CD8 T cell responses. J Immunol. 2009;182(12):7828–37. 10.4049/jimmunol.0803928 . - DOI - PubMed
    1. Schmitz JE, Kuroda MJ, Santra S, Sasseville VG, Simon MA, Lifton MA, et al. Control of viremia in simian immunodeficiency virus infection by CD8+ lymphocytes. Science. 1999;283(5403):857–60. . - PubMed

Publication types

MeSH terms

Associated data