

Molecular probes for fluorescence lifetime imaging
- PMID: 25961514
- PMCID: PMC4482119
- DOI: 10.1021/acs.bioconjchem.5b00167
Molecular probes for fluorescence lifetime imaging
Abstract
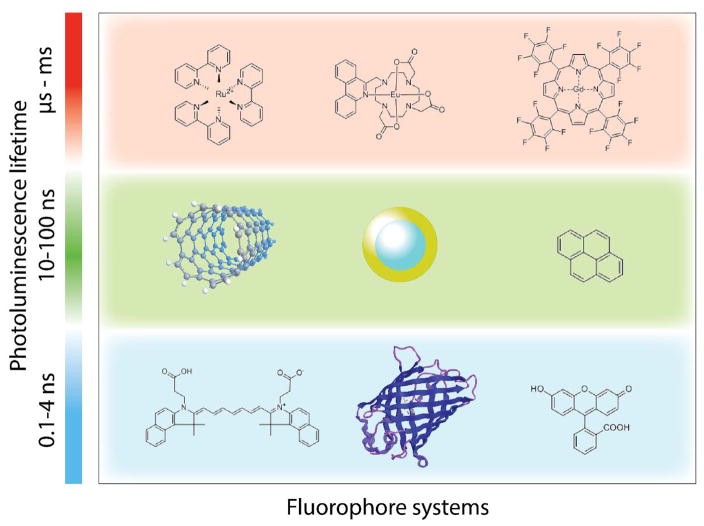
Visualization of biological processes and pathologic conditions at the cellular and tissue levels largely relies on the use of fluorescence intensity signals from fluorophores or their bioconjugates. To overcome the concentration dependency of intensity measurements, evaluate subtle molecular interactions, and determine biochemical status of intracellular or extracellular microenvironments, fluorescence lifetime (FLT) imaging has emerged as a reliable imaging method complementary to intensity measurements. Driven by a wide variety of dyes exhibiting stable or environment-responsive FLTs, information multiplexing can be readily accomplished without the need for ratiometric spectral imaging. With knowledge of the fluorescent states of the molecules, it is entirely possible to predict the functional status of biomolecules or microevironment of cells. Whereas the use of FLT spectroscopy and microscopy in biological studies is now well-established, in vivo imaging of biological processes based on FLT imaging techniques is still evolving. This review summarizes recent advances in the application of the FLT of molecular probes for imaging cells and small animal models of human diseases. It also highlights some challenges that continue to limit the full realization of the potential of using FLT molecular probes to address diverse biological problems and outlines areas of potential high impact in the future.
Conflict of interest statement
The authors declare no competing financial interest.
Figures
Similar articles
-
Fluorogenic label for biomolecular imaging.ACS Chem Biol. 2006 May 23;1(4):252-60. doi: 10.1021/cb600132m. ACS Chem Biol. 2006. PMID: 17163679 Free PMC article.
-
Optical Probes for Neurobiological Sensing and Imaging.Acc Chem Res. 2018 May 15;51(5):1023-1032. doi: 10.1021/acs.accounts.7b00564. Epub 2018 Apr 13. Acc Chem Res. 2018. PMID: 29652127 Free PMC article. Review.
-
A minireview of viscosity-sensitive fluorescent probes: design and biological applications.J Mater Chem B. 2020 Nov 4;8(42):9642-9651. doi: 10.1039/d0tb01146k. J Mater Chem B. 2020. PMID: 32986068 Review.
-
Fluorescence Lifetime-Based Tumor Contrast Enhancement Using an EGFR Antibody-Labeled Near-Infrared Fluorophore.Clin Cancer Res. 2019 Nov 15;25(22):6653-6661. doi: 10.1158/1078-0432.CCR-19-1686. Epub 2019 Sep 3. Clin Cancer Res. 2019. PMID: 31481509 Free PMC article.
-
Measuring Interactions between Fluorescent Probes and Lignin in Plant Sections by sFLIM Based on Native Autofluorescence.J Vis Exp. 2020 Jan 2;(155). doi: 10.3791/59925. J Vis Exp. 2020. PMID: 31957743
Cited by
-
A Perspective on Fluorescent Nanodiamond Bioimaging.Small. 2019 Nov;15(48):e1902151. doi: 10.1002/smll.201902151. Epub 2019 Jun 19. Small. 2019. PMID: 31215753 Free PMC article. Review.
-
Quantitative Imaging of Biochemistry in Situ and at the Nanoscale.ACS Cent Sci. 2020 Nov 25;6(11):1938-1954. doi: 10.1021/acscentsci.0c01076. Epub 2020 Oct 12. ACS Cent Sci. 2020. PMID: 33274271 Free PMC article. Review.
-
Towards clinically translatable in vivo nanodiagnostics.Nat Rev Mater. 2017 May;2(5):17014. doi: 10.1038/natrevmats.2017.14. Epub 2017 May 3. Nat Rev Mater. 2017. PMID: 29876137 Free PMC article.
-
Use of Fluorescence Lifetime Imaging Microscopy (FLIM) as a Timer of Cell Cycle S Phase.PLoS One. 2016 Dec 14;11(12):e0167385. doi: 10.1371/journal.pone.0167385. eCollection 2016. PLoS One. 2016. PMID: 27973570 Free PMC article.
-
Bioengineering tools for probing intracellular events in T lymphocytes.WIREs Mech Dis. 2021 Jul;13(4):e1510. doi: 10.1002/wsbm.1510. Epub 2020 Oct 19. WIREs Mech Dis. 2021. PMID: 33073545 Free PMC article. Review.
References
-
- Lakowicz JR. Principles of Fluorescence Spectroscopy. 2. Kluwer Academic/Plenum Publishers; New York: 1999.
-
- Guilbault GG. Practical Fluorescence. 2. CRC Press; 1990.
-
- Nothdurft RE, Patwardhan SV, Akers W, Ye YP, Achilefu S, Culver JP. In vivo fluorescence lifetime tomography. J Biomed Opt. 2009;14 - PubMed
-
- Monici M. Cell and tissue autofluorescence research and diagnostic applications. Biotechnol Ann Rev. 2005;11:227–56. - PubMed
Publication types
MeSH terms
Substances
Grants and funding
LinkOut - more resources
Full Text Sources
Other Literature Sources
