. 2015 May 11;10(5):e0126537.
doi: 10.1371/journal.pone.0126537. eCollection 2015.

High glucose induces bone marrow-derived mesenchymal stem cell senescence by upregulating autophagy

Affiliations

High glucose induces bone marrow-derived mesenchymal stem cell senescence by upregulating autophagy

Tzu-Ching Chang et al. PLoS One. .

Abstract

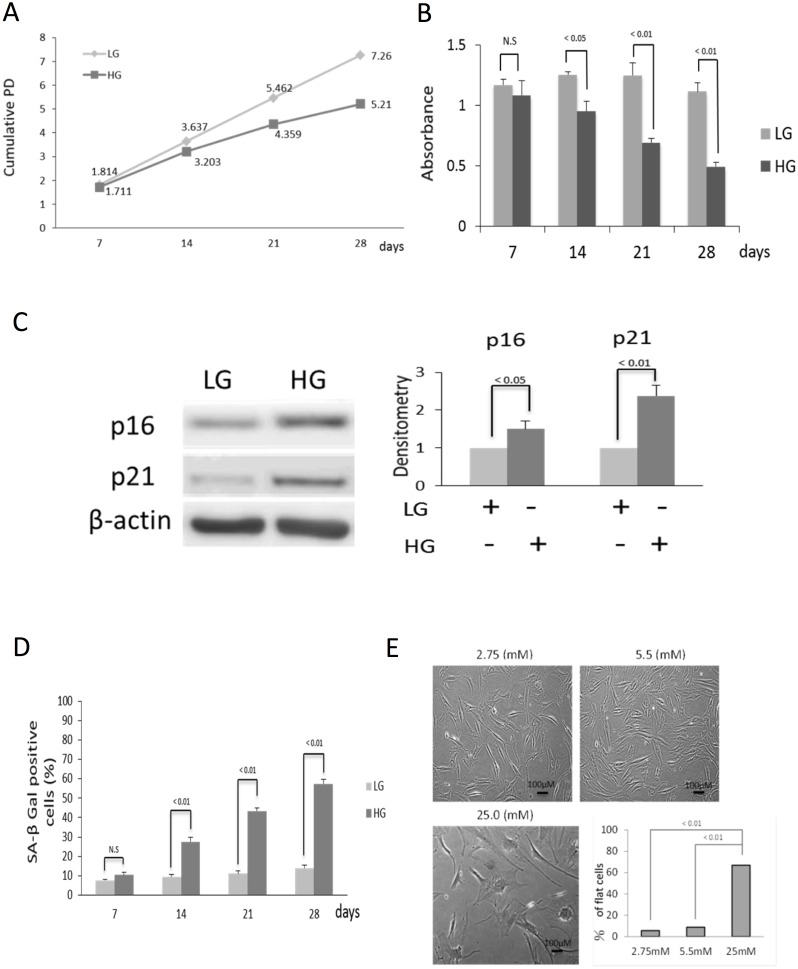
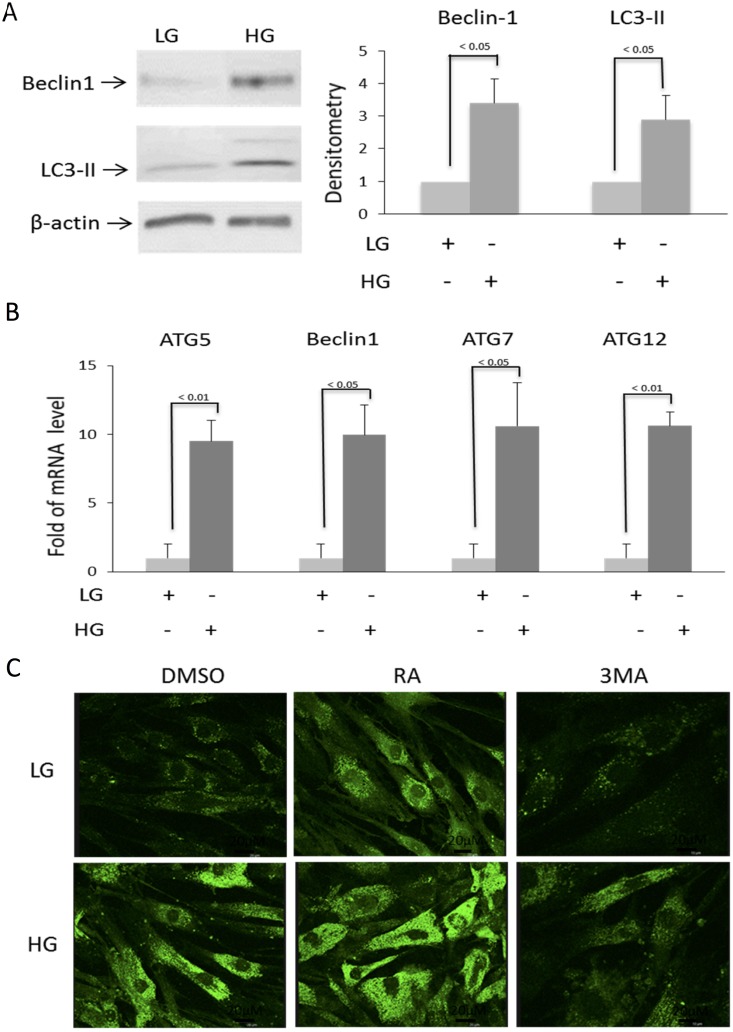
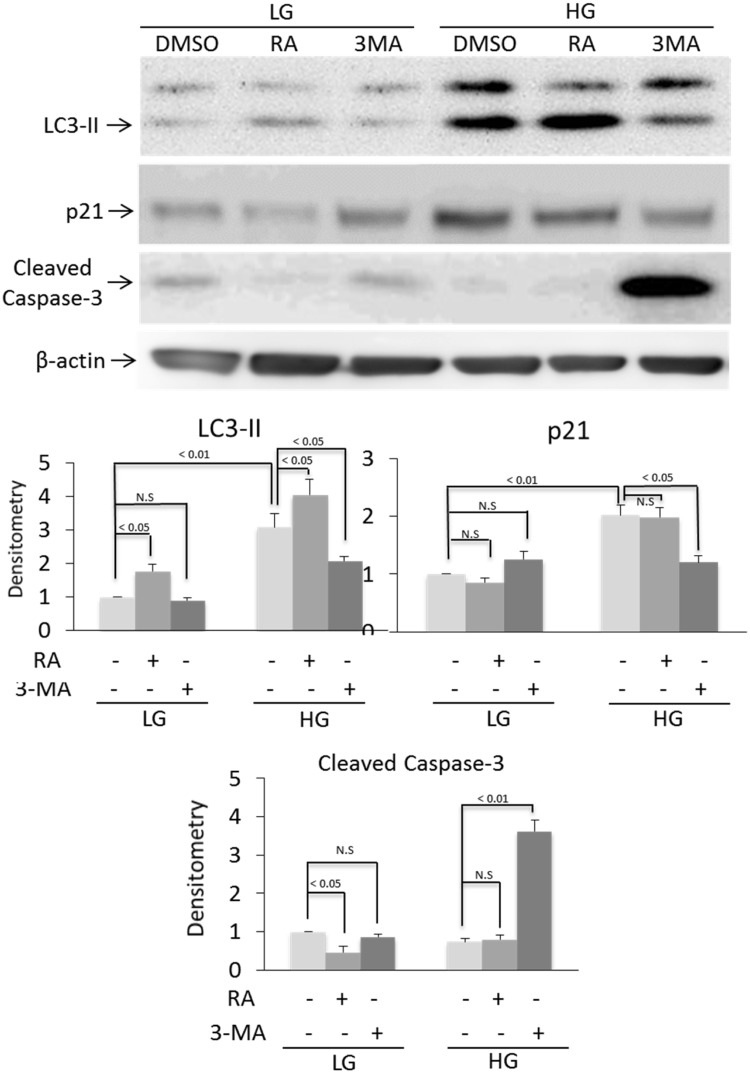
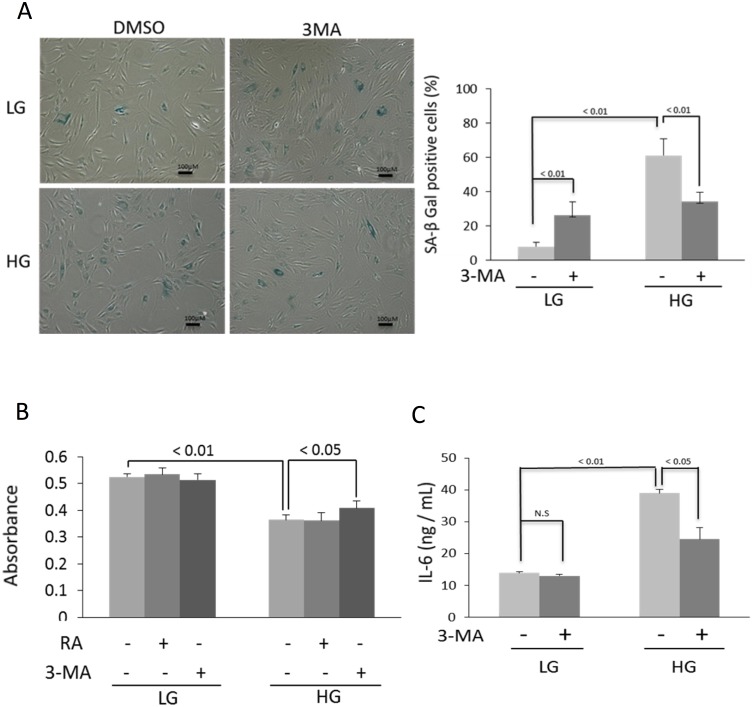
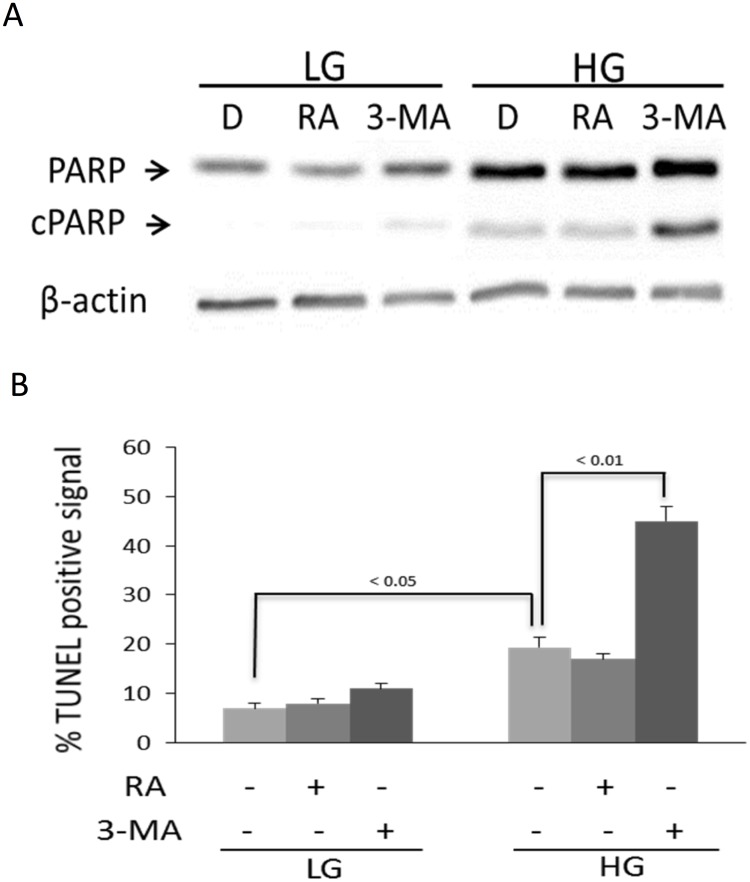
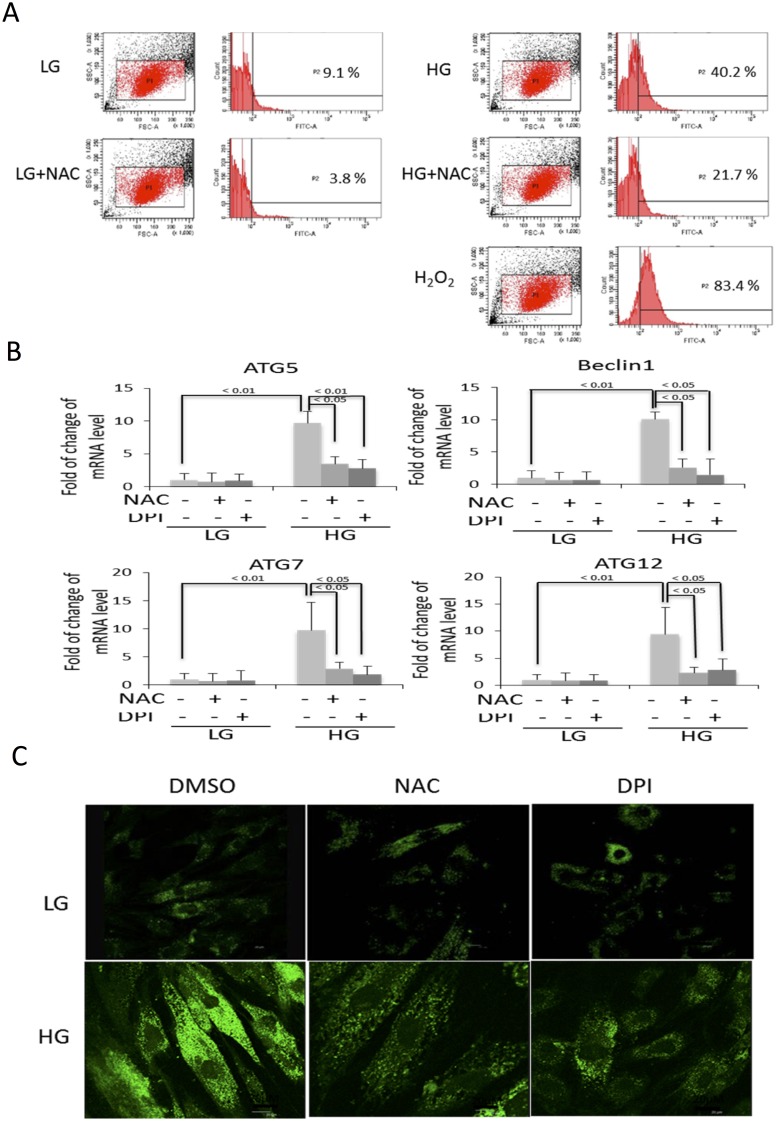
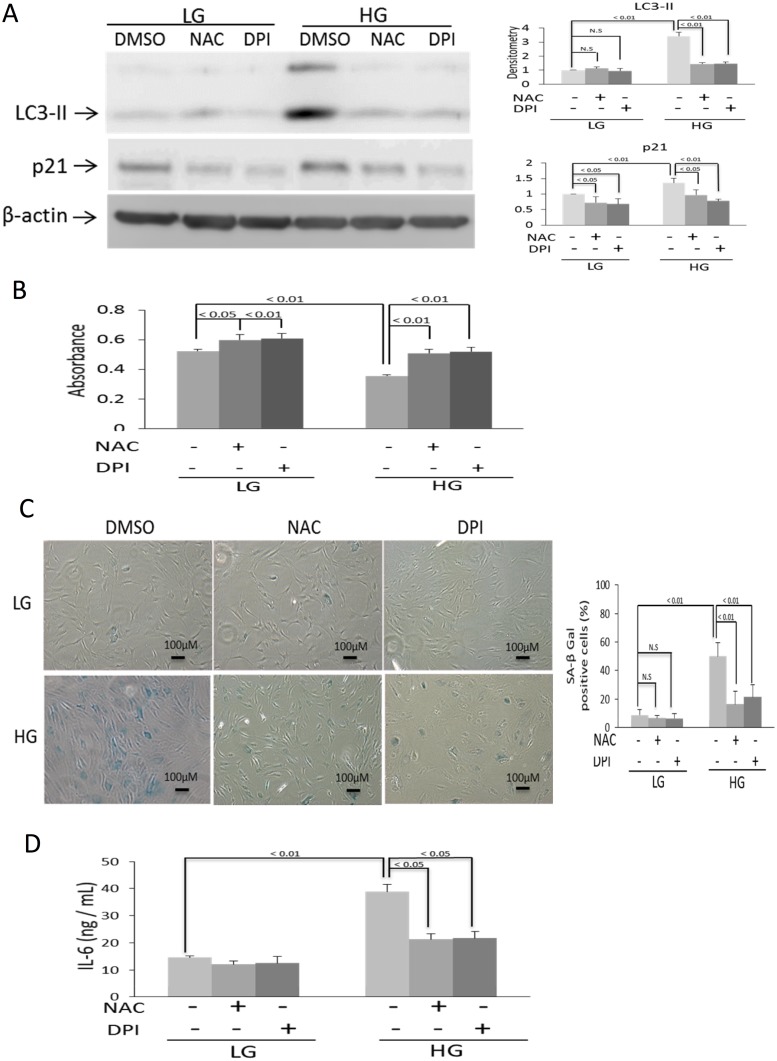
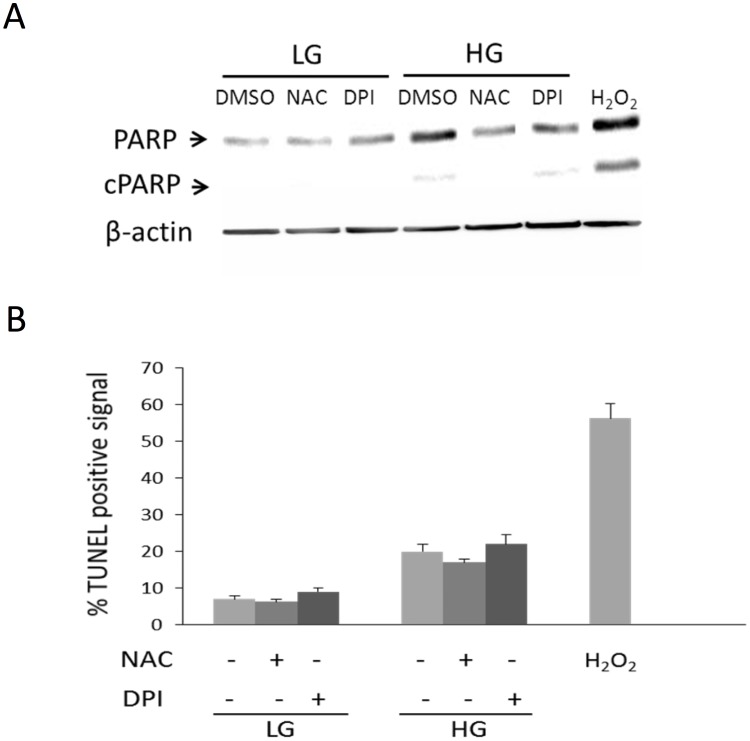
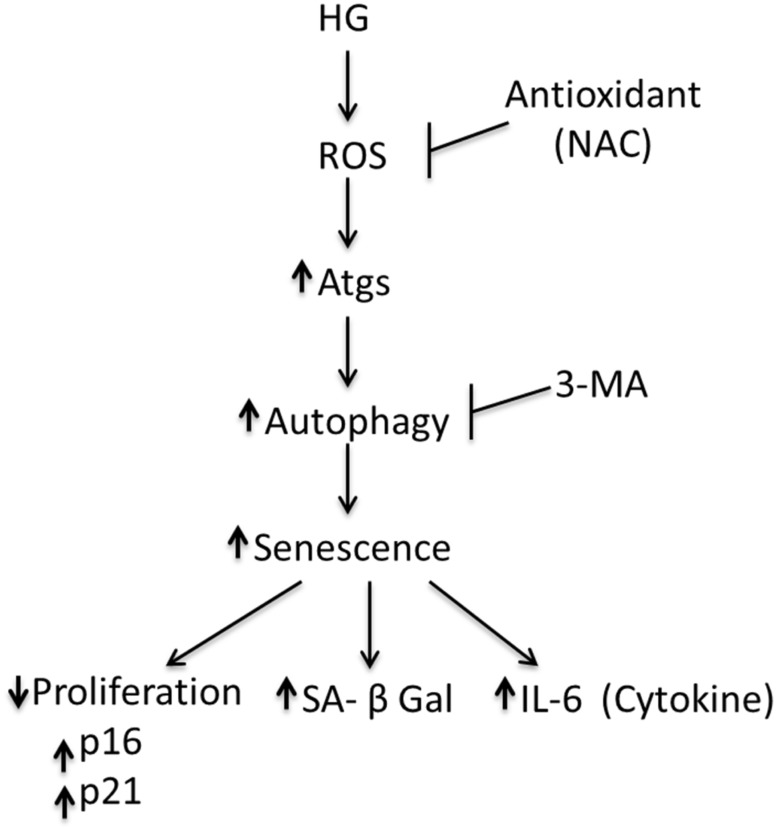
Hyperglycemia was reported to cause bone marrow hematopoietic niche dysfunction, and high glucose (HG) in the cultured medium induces MSC senescence. The underlying mechanism is unclear. Here, we investigated the role of HG-induced autophagy in bone-marrow-derived mesenchymal stem cell (BMSC) senescence. HG (25 mM) increased expression of Beclin-1, Atg 5, 7 and 12, generation of LC3-II and autophagosome formation which was correlated with development of cell senescence. Pretreatment of HG-MSC with 3-methyladenine (3-MA) prevented senescence but increased apoptosis. N-acetylcysteine (NAC) was effective in abrogating HG-induced autophagy accompanied by prevention of senescence. Diphenyleneiodonium (DPI), an inhibitor of NADPH oxidase, blocked autophagy and senescence in a manner comparable to NAC. 3-MA, NAC and DPI inhibited HG-induced interleukin-6 production in BMSCs. These results suggest that hyperglycemia induces MSC senescence and local inflammation via a novel oxidant-mediated autophagy which contributes to bone marrow niche dysfunction and hematopoietic impairment.


Conflict of interest statement

Competing Interests: The authors have declared that no competing interests exist.

Figures

Fig 1
Fig 1. HG induces BMSCs senescence.
(A) HG reduces cumulative PD. Cumulative PD was determined in BMSCs incubated in HG or LG for various time periods up to 28 days. HG-treated cells exhibit a time-dependent reduction of cumulative PD. (B) HG reduces BrdU incorporation. BrdU incorporation was measured in BMSCs incubated with HG or LG for various time periods. HG induced a progressive reduction of BrdU incorporation. (C) HG increases the expression of p16 and p21 proteins. BMSCs were incubated in medium containing HG or LG for 2 weeks and p16 and p21 proteins were analyzed by Western blotting. The left panel shows representative blots while the right panel, the densitometry of the blots. Error bars denote means ± SEM (n = 3). (D) HG induces SA-β-Gal. BMSCs cultured in HG or LG for 7 to 28 days were stained for SA-β-Gal and examined under light microscopy. Cells with positive SA-β-Gal staining were counted. HG increased SA-β-Gal in a time-dependent manner whereas LG did not have a significant effect on SA-β-Gal. (E) HG alters BMSC morphology. BMSCs were washed and incubated in medium containing various concentrations of glucose for 28 days: 2.75 and 5.5 mM are considered to be LG and 25 mM, HG. Cells became flat and rounded when cultured in HG. Error bars denote mean ± SEM (n = 3).
Fig 2
Fig 2. HG-induced autophagy related gene expression and autophagosome formation.
BMSCs were incubated in medium containing LG (5.5 mM) or HG (25 mM) and autophagy was analyzed at 2 weeks. (A) Beclin-1 and LC3 were analyzed by Western blotting. Left panel shows a representative Western blot and right panel, densitometry of Western blots. The error bars denote mean ± SEM (n = 3). (B) Beclin-1 and Atg 5, 7 and 12 transcripts were measured by real time qPCR. Error bars denote mean ± SEM (n = 3). (C) BMSCs in LG or HG were treated with MDC and examined under fluorescent microscopy. RA and 3MA denote rapamycin (5 μM) and 3-methlyadenine (10 μM), respectively. This figure is representative of figures from three experiments.
Fig 3
Fig 3. HG-induced autophagy promotes senescence.
BMSCs in LG or HG were treated with rapamycin, 3-MA or DMSO control for 48h. LC3-II, p21 and cleaved caspase 3 were analyzed by Western blotting. Upper panel shows representative blots and the low panel densitometry of Western blots. Error bars indicate mean ± SEM (n = 3). NS denotes statistically non-significant.
Fig 4
Fig 4. HG-induced autophagy promotes senescence and IL-6 released.
(A) Analysis of SA-β-Gal by immunochemistry staining. Left panel shows representative figures and right panel, quantitative analysis of SA-β-Gal positive BMSCs. Error bars indicate mean ± SEM (n = 3). (B) BrdU incorporation was measured in BMSCs incubated with HG or LG for 28 days with or without rapamycin or 3-MA. (C) Measurement of IL-6 released into the medium by ELISA. Error bars refer to mean ± SEM (n = 3).
Fig 5
Fig 5. Suppression of HG-induced autophagy increases BMSC apoptosis.
(A) Cell apoptosis was analyzed by cleaved PARP (cPARP) and (B) TUNEL positive signals. BMSCs in LG or HG were treated with rapamycin (RA), 3-MA or DMSO control for 48h. Error bars refer to mean ± SEM (n = 3).
Fig 6
Fig 6. Antioxidants abrogate HG-induced autophagy.
(A) The levels of ROS were measured by DCFH assay. H2O2 (750μM) was included as a positive control. (B) BMSCs in LG or HG were treated with NAC (5 mM) DPI (5 μM) or DMSO control for 48h. Beclin-1, Atg 5, 7 and 12 transcripts were analyzed by qPCR. The error bars indicate mean ± SEM (n = 3). (C) Analysis of autophagy by MDC staining.
Fig 7
Fig 7. Antioxidants suppress HG-induced senescence and IL-6 production.
(A) LC3 and p21 were analyzed by Western blotting. Upper panel shows representative blots and the lower panel, densitometric analysis of blots. Error bars denote mean ± SEM (n = 3). NS denotes statistically non-significant. (B) BrdU incorporation was measured in BMSCs incubated with HG or LG for 28 days with or without NAC or DPI. (C) Upper panel shows representative figures of SA-β-Gal staining. The low panel, SA-β-Gal positive cells. Error bars denote mean ± SEM (n = 3)). (D) Measurement of IL-6 in the medium by ELISA. Error bars indicate mean ± SEM (n = 3). NS denotes statistically non-significant.
Fig 8
Fig 8. Neither NAC nor DPI influences BMSC apoptosis.
(A) Cell apoptosis was analyzed by cleaved PARP and (B) TUNEL positive signals. BMSCs in LG or HG were treated with NAC, DPI or DMSO control for 48h. H2O2 (750μM) was included as a positive control. Error bars refer to mean ± SEM (n = 3).
Fig 9
Fig 9. Schematic illustration of the pathway via which HG induces autophagy and senescence.
Antioxidants such as NAC blocks reactive oxygen species (ROS) thereby preventing autophagy and senescence. 3-MA prevents senescence by inhibiting autophagy.

References

    1. Kojima H, Kim J, Chan L (2014) Emerging roles of hematopoietic cells in the pathobiology of diabetic complications. Trends Endocrinol Metab 25(4): 178–187. 10.1016/j.tem.2014.01.002 - DOI - PMC - PubMed
    1. Ferraro F1, Lymperi S, Méndez-Ferrer S, Saez B, Spencer JA, Yeap BY, et al. (2011) Diabetes impairs hematopoietic stem cell mobilization by altering niche function. Sci Transl Med 3(104): 104ra101 10.1126/scitranslmed.3002191 - DOI - PMC - PubMed
    1. Stolzing A, Coleman N, Scutt A (2006) Glucose-induced replicative senescence in mesenchymal stem cells. Rejuvenation Res 9(1): 31–35. - PubMed
    1. Parsch D, Fellenberg J, Brümmendorf TH, Eschlbeck AM, Richter W (2004) Telomere length and telomerase activity during expansion and differentiation of human mesenchymal stem cells and chondrocytes. J Mol Med 82(1): 49–55. - PubMed
    1. Estrada JC, Torres Y, Benguría A, Dopazo A, Roche E, Carrera-Quintanar L, et al. (2013) Human mesenchymal stem cell-replicative senescence and oxidative stress are closely linked to aneuploidy. Cell Death Dis 4: e691 10.1038/cddis.2013.211 - DOI - PMC - PubMed

Publication types

MeSH terms

LinkOut - more resources