. 2015 Jun;47(6):615-24.
doi: 10.1038/ng.3293. Epub 2015 May 11.

A Sleeping Beauty forward genetic screen identifies new genes and pathways driving osteosarcoma development and metastasis

Affiliations

A Sleeping Beauty forward genetic screen identifies new genes and pathways driving osteosarcoma development and metastasis

Branden S Moriarity et al. Nat Genet. 2015 Jun.

Abstract

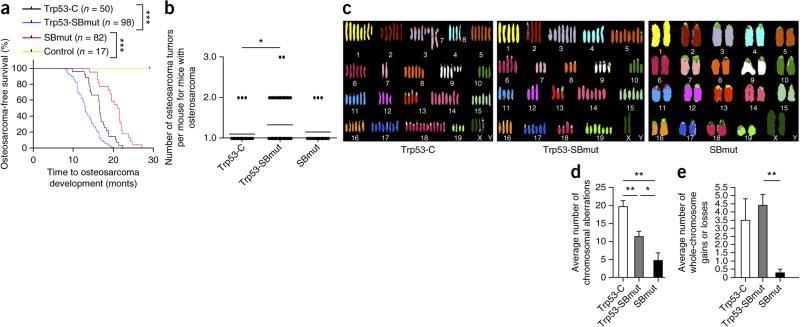
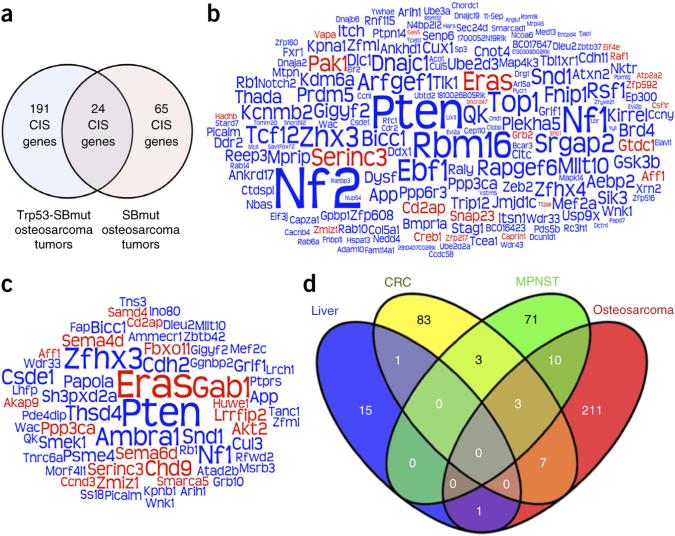
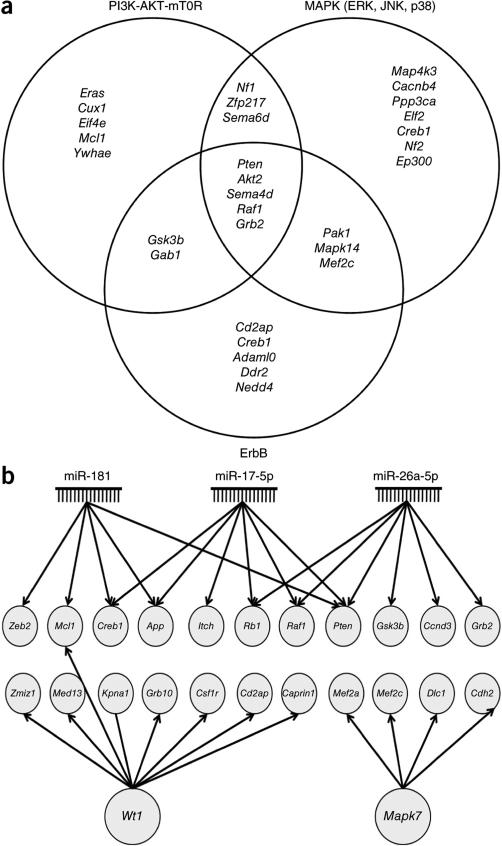
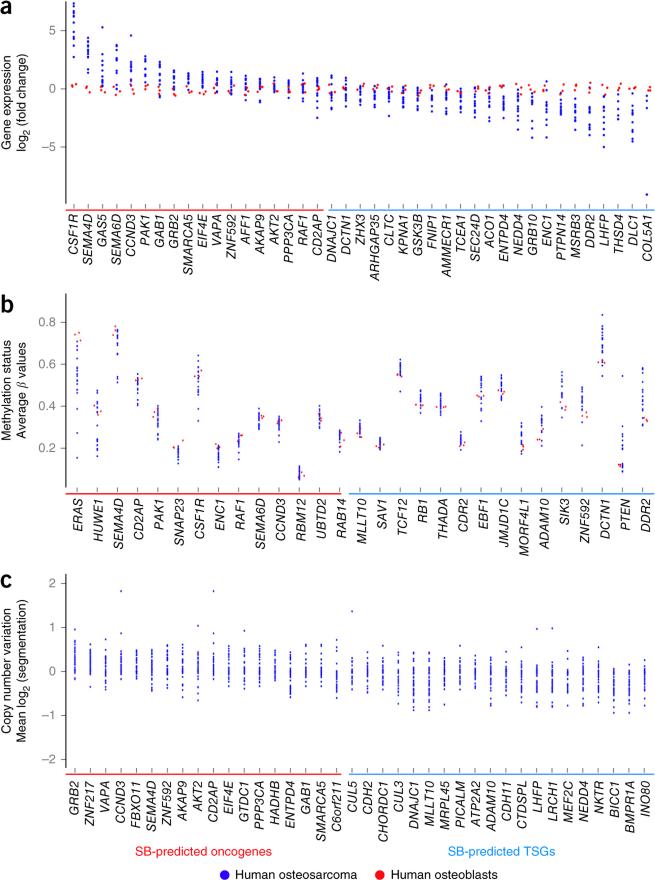
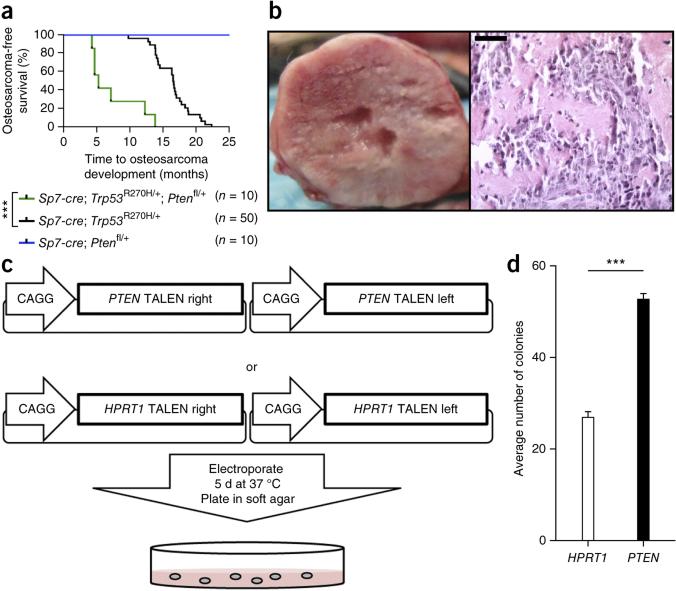
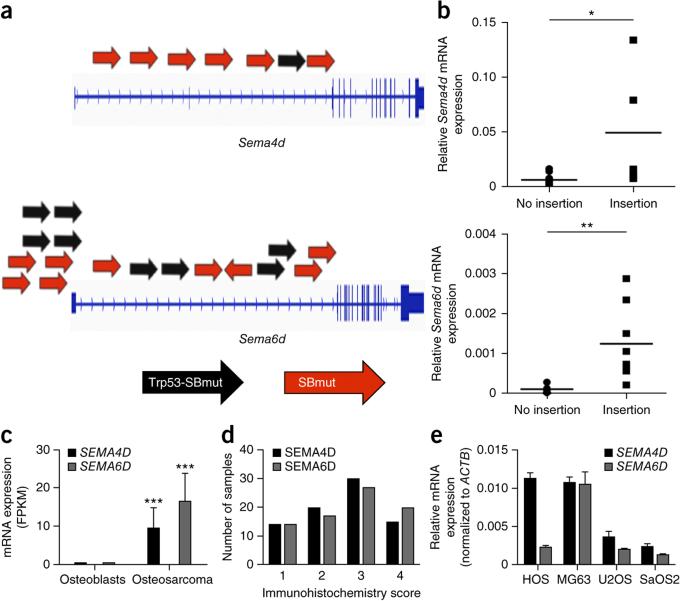
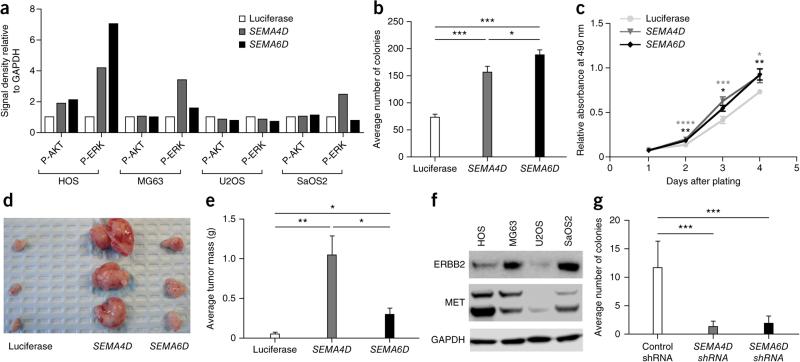
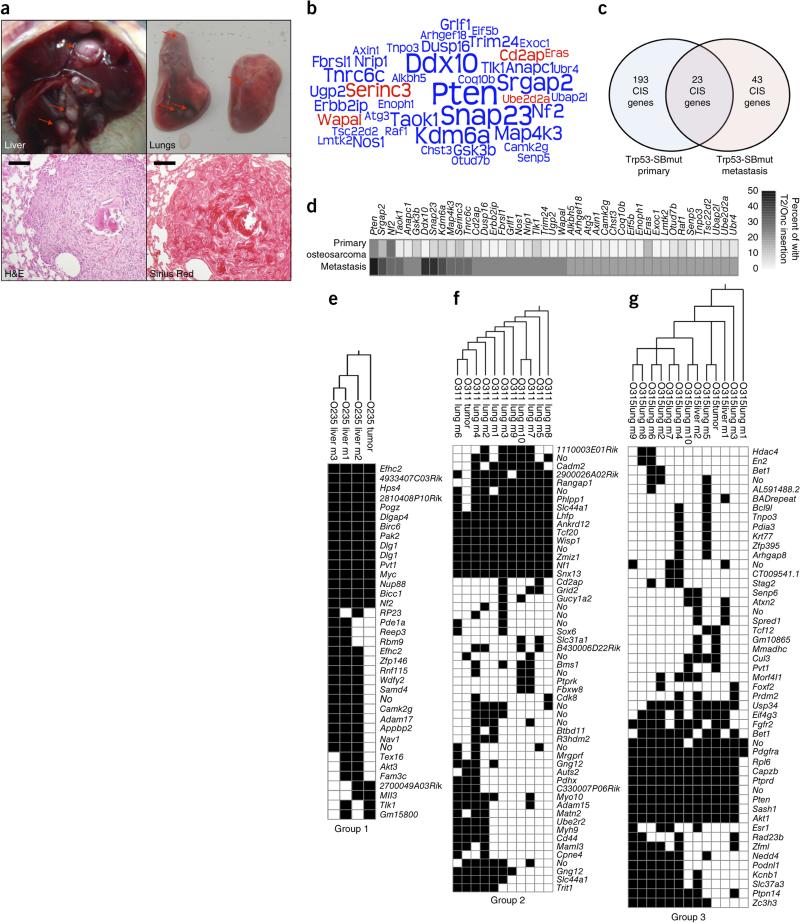
Osteosarcomas are sarcomas of the bone, derived from osteoblasts or their precursors, with a high propensity to metastasize. Osteosarcoma is associated with massive genomic instability, making it problematic to identify driver genes using human tumors or prototypical mouse models, many of which involve loss of Trp53 function. To identify the genes driving osteosarcoma development and metastasis, we performed a Sleeping Beauty (SB) transposon-based forward genetic screen in mice with and without somatic loss of Trp53. Common insertion site (CIS) analysis of 119 primary tumors and 134 metastatic nodules identified 232 sites associated with osteosarcoma development and 43 sites associated with metastasis, respectively. Analysis of CIS-associated genes identified numerous known and new osteosarcoma-associated genes enriched in the ErbB, PI3K-AKT-mTOR and MAPK signaling pathways. Lastly, we identified several oncogenes involved in axon guidance, including Sema4d and Sema6d, which we functionally validated as oncogenes in human osteosarcoma.


Figures

Figure 1
Figure 1
SB mutagenesis can accelerate or induce osteosarcoma development in cells with Sp7-cre expression. (a) Osteosarcoma-free survival curve depicting time to osteosarcoma development and survival endpoints in all cohorts. Control mice contained Sp7-cre with either SB11 or T2/Onc. ***P < 0.0001, log-rank test. (b) Histogram displaying the number of osteosarcomas per mouse. *P = 0.0159, Student's t test. (c) Representative SKY results from analysis of osteosarcoma tumor cells that developed in Trp53-C, Trp53-SBmut and SBmut mice. (d,e) Histograms demonstrating the number of chromosomal aberrations (d) and whole-chromosome gains and/or losses (e) identified by aCGH performed on Trp53-C (n = 4), Trp53-SBmut (n = 5) and SBmut (n = 4) osteosarcoma tumor DNA with matched normal tail DNA. *P < 0.05, **P < 0.001, Student's t test. Error bars, s.d.
Figure 2
Figure 2
CIS analysis identifies osteosarcoma driver genes. (a) Venn diagram depicting the number of CIS-associated genes from Trp53-SBmut and SBmut tumors and the number of genes identified in both groups. (b,c) Word cloud diagrams depicting Trp53-SBmut (b) and SBmut (c) CIS-associated genes. The size of each gene name is representative of the percentage of tumors with insertions in the CIS-associated gene identified by TAPDANCE or gene-centric analysis; if CISs in the gene were identified by both analyses, the larger percentage was used. Predicted proto-oncogenes are depicted in red, and candidate TSGs are depicted in blue. (d) Venn diagram depicting the overlap of the identified osteosarcoma-associated CIS genes with the CIS genes identified in previous SB screens for colorectal (CRC), liver and malignant peripheral nerve sheath (MPNST) tumors.
Figure 3
Figure 3
Analysis of CIS-associated genes identifies cooperating mutations, genetic pathways and upstream regulators in osteosarcoma development. (a) Venn diagram depicting the overlapping CIS genes found in three well-known cancer-associated signaling pathways. CIS genes were categorized into specific pathways on the basis of IPA, DAVID, GeneCards and a literature review. (b) Gene module depicting upstream regulators found to be regulating a significant number of CIS-associated genes by IPA (Supplementary Table 4).
Figure 4
Figure 4
Comparative genomics analysis of CIS-associated genes in osteosarcoma. (a–c) RNA sequencing, whole-methylome and CNV data from human osteosarcoma samples were queried for alterations in CIS genes (Supplementary Tables 7–9). Only gene alterations that substantiate SB prediction of candidate oncogenes or TSGs were considered and appear in the presented scatterplots. (a) Scatterplot depicting CIS genes with significant (P < 0.05) differences in gene expression in human osteosarcomas (n = 12) in comparison to normal human osteoblasts. Genes are ordered on the basis of decreasing fold change in expression for oncogenes followed by TSGs. (b) Scatterplot depicting CIS genes with significant (P < 0.05) differences in methylation, including hypomethylation (negative values) or hypermethylation (positive values), in human osteosarcomas (n = 21) in comparison to normal human osteoblasts. Genes are ordered by increasing differential methylation. (c) Scatterplot depicting CIS genes in regions with tendencies for copy number gains or losses observed in human osteosarcoma (n = 56). Genes are ordered by decreasing number of amplifications from oncogenes to TSGs.
Figure 5
Figure 5
Pten loss accelerates osteosarcoma development in mice and PTEN loss enhances the anchorage-independent growth of immortalized human osteoblast cells. (a) Osteosarcoma-free survival curve depicting time to osteosarcoma development and survival endpoints for Trp53-C, Trp53-Pten and Pten mice. ***P < 0.0001, log-rank test. (b) Representative gross necropsy image of a primary osteosarcoma demonstrating typical gross morphology (left) and a section stained with hematoxylin and eosin (right) demonstrating a histological appearance consistent with osteosarcoma. Scale bar, 200 μm. (c) Diagram of the experimental procedure used to knock out PTEN with TALENs in immortalized human osteoblast cells. (d) Average number of colonies formed in soft agar by immortalized osteoblast cells treated with PTEN or HPRT1 TALENs. Data are the means ± s.e.m. of five independent experiments; ***P < 0.0001, Student's t test. Error bars, s.d.
Figure 6
Figure 6
Axon guidance–related genes are implicated in osteosarcoma. (a) Diagram depicting T2/Onc insertion sites driving overexpression of Sema4d and Sema6d. Black and red arrows represent T2/Onc insertions identified in tumors from Trp53-SBmut and SBmut mice, respectively. (b) Relative mRNA levels of Sema4d and Sema6d in tumors with or without T2/Onc insertions in the respective genes. *P = 0.05, **P = 0.001, Student's t test. (c) Relative mRNA levels of SEMA4D and SEMA6D in normal human osteoblasts and human osteosarcoma tumors analyzed by RNA sequencing (n = 12 human osteosarcoma and 3 normal osteoblast samples). ***P < 0.0001, Student's t test. Error bars, s.d. (d) Immunohistochemistry scores for SEMA4D and SEMA6D in 80 osteosarcoma tumor samples. (e) Relative mRNA expression of SEMA4D and SEMA6D in the HOS, MG63, U2OS and SaOS2 human osteosarcoma cell lines normalized to ACTB expression. Data are means ± s.e.m.; n ≥ 3. Error bars, s.d.
Figure 7
Figure 7
SEMA4D and SEMA6D overexpression increases the levels of phosphorylated AKT and/or ERK. (a) Densitometry of immunoblot analysis (Supplementary Fig. 7) for cell lines overexpressing the luciferase gene, SEMA4D or SEMA6D. P-AKT, phosphorylated AKT; P-ERK, phosphorylated ERK. (b) Average number of colonies formed in soft agar by HOS cells overexpressing luciferase control, SEMA4D or SEMA6D cDNA. Data are the means ± s.e.m. of three independent experiments; *P < 0.05, ***P < 0.0001, Student's t test. (c) MTS proliferation assay of HOS cells overexpressing luciferase control, SEMA4D or SEMA6D cDNA. Data are the means ± s.e.m. of three independent experiments; *P < 0.05, **P < 0.001, ***P < 0.0001, ****P < 0.00001, Student's t test. (d) Representative image of the xenografts developing from subcutaneous injection of HOS cells overexpressing luciferase control, SEMA4D or SEMA6D cDNA into nude mice 3 weeks after injection. (e) Average tumor mass of the xenograft tumors in c. Data are means ± s.e.m.; n ≥ 6; *P < 0.05, **P < 0.001, Student's t test. (f) Immunoblot analysis for the indicated proteins in lysates from HOS cells overexpressing luciferase control, SEMA4D or SEMA6D cDNA. (g) Average number of colonies formed in soft agar by HOS cells treated with non-silencing, control, SEMA4D or SEMA6D shRNA pools. Data are the means ± s.e.m. of three independent experiments; ***P < 0.0001, t test.
Figure 8
Figure 8
Osteosarcoma metastases are clonal in nature and identify CIS-associated metastasis genes. (a) Top, representative gross necropsy images of osteosarcoma metastases in liver (left) and lung (right) demonstrating typical gross morphology. Red arrows indicate independent macroscopic metastases. Bottom left, section stained with hematoxylin and eosin (H&E) showing representative metastasis morphology with surrounding normal lung tissue. Scale bar, 100 μm. Bottom right, section stained with Sirius Red validating the presence of collagen deposits in osteosarcoma metastases. Scale bar, 100 μm. (b) Word cloud diagram depicting Trp53-SBmut metastasis CIS-associated genes. The size of each gene name is representative of the percentage of metastasis sets with insertions in the CIS-associated gene identified by TAPDANCE or gene-centric analysis; if a gene was identified by both analyses, the larger percentage was used. Predicted proto-oncogenes are depicted in red, and candidate TSGs are depicted in blue. (c) Venn diagram depicting the overlap in CIS-associated genes identified in primary osteosarcomas and metastases. (d) Heat map comparing the percentages of primary tumors and sets of metastases harboring T2/Onc insertions in metastasis CIS-associated genes. (e–g) Representative phylogeny analysis generated from parsimony and hierarchical clustering of the T2/Onc insertion sites identified in primary osteosarcoma tumors (tumor) and matched metastases (m). Group 1 demonstrates low overlap of T2/Onc insertions for primary tumors and metastases (e), group 2 shows many shared insertions (f) and group 3 appears to have an intermediate number of shared insertions (g). Phylogenetic trees and hierarchical clustering for all mice that developed metastases and had more than two macroscopic metastases can be found in Supplementary Figures 8 and 9.

References

    1. Kansara M, Thomas DM. Molecular pathogenesis of osteosarcoma. DNA Cell Biol. 2007;26:1–18. - PubMed
    1. Allison DC, et al. A meta-analysis of osteosarcoma outcomes in the modern medical era. Sarcoma. 2012;2012:704872. - PMC - PubMed
    1. Jaffe N, Puri A, Gelderblom H. Osteosarcoma: evolution of treatment paradigms. Sarcoma. 2013;2013:203531. - PMC - PubMed
    1. Tsuchiya H, et al. Effect of timing of pulmonary metastases identification on prognosis of patients with osteosarcoma: the Japanese Musculoskeletal Oncology Group study. J. Clin. Oncol. 2002;20:3470–3477. - PubMed
    1. Kager L, et al. Primary metastatic osteosarcoma: presentation and outcome of patients treated on neoadjuvant Cooperative Osteosarcoma Study Group protocols. J. Clin. Oncol. 2003;21:2011–2018. - PubMed

Publication types