. 2015 Jun;47(6):589-97.
doi: 10.1038/ng.3300. Epub 2015 May 11.

The impact of low-frequency and rare variants on lipid levels

Ida Surakka  1 Momoko Horikoshi  2 Reedik Mägi  3 Antti-Pekka Sarin  1 Anubha Mahajan  4 Vasiliki Lagou  2 Letizia Marullo  5 Teresa Ferreira  4 Benjamin Miraglio  6 Sanna Timonen  6 Johannes Kettunen  1 Matti Pirinen  6 Juha Karjalainen  7 Gudmar Thorleifsson  8 Sara Hägg  9 Jouke-Jan Hottenga  10 Aaron Isaacs  11 Claes Ladenvall  12 Marian Beekman  13 Tõnu Esko  14 Janina S Ried  15 Christopher P Nelson  16 Christina Willenborg  17 Stefan Gustafsson  9 Harm-Jan Westra  7 Matthew Blades  18 Anton J M de Craen  19 Eco J de Geus  10 Joris Deelen  13 Harald Grallert  20 Anders Hamsten  21 Aki S Havulinna  22 Christian Hengstenberg  23 Jeanine J Houwing-Duistermaat  24 Elina Hyppönen  25 Lennart C Karssen  26 Terho Lehtimäki  27 Valeriya Lyssenko  28 Patrik K E Magnusson  29 Evelin Mihailov  3 Martina Müller-Nurasyid  30 John-Patrick Mpindi  6 Nancy L Pedersen  29 Brenda W J H Penninx  31 Markus Perola  32 Tune H Pers  33 Annette Peters  34 Johan Rung  35 Johannes H Smit  31 Valgerdur Steinthorsdottir  8 Martin D Tobin  36 Natalia Tsernikova  3 Elisabeth M van Leeuwen  26 Jorma S Viikari  37 Sara M Willems  26 Gonneke Willemsen  10 Heribert Schunkert  23 Jeanette Erdmann  17 Nilesh J Samani  16 Jaakko Kaprio  38 Lars Lind  39 Christian Gieger  40 Andres Metspalu  41 P Eline Slagboom  13 Leif Groop  42 Cornelia M van Duijn  11 Johan G Eriksson  43 Antti Jula  22 Veikko Salomaa  22 Dorret I Boomsma  10 Christine Power  44 Olli T Raitakari  45 Erik Ingelsson  46 Marjo-Riitta Järvelin  47 Unnur Thorsteinsdottir  48 Lude Franke  7 Elina Ikonen  49 Olli Kallioniemi  6 Vilja Pietiäinen  6 Cecilia M Lindgren  50 Kari Stefansson  48 Aarno Palotie  51 Mark I McCarthy  52 Andrew P Morris  53 Inga Prokopenko  54 Samuli Ripatti  55 ENGAGE Consortium
Affiliations

The impact of low-frequency and rare variants on lipid levels

Ida Surakka et al. Nat Genet. 2015 Jun.

Abstract

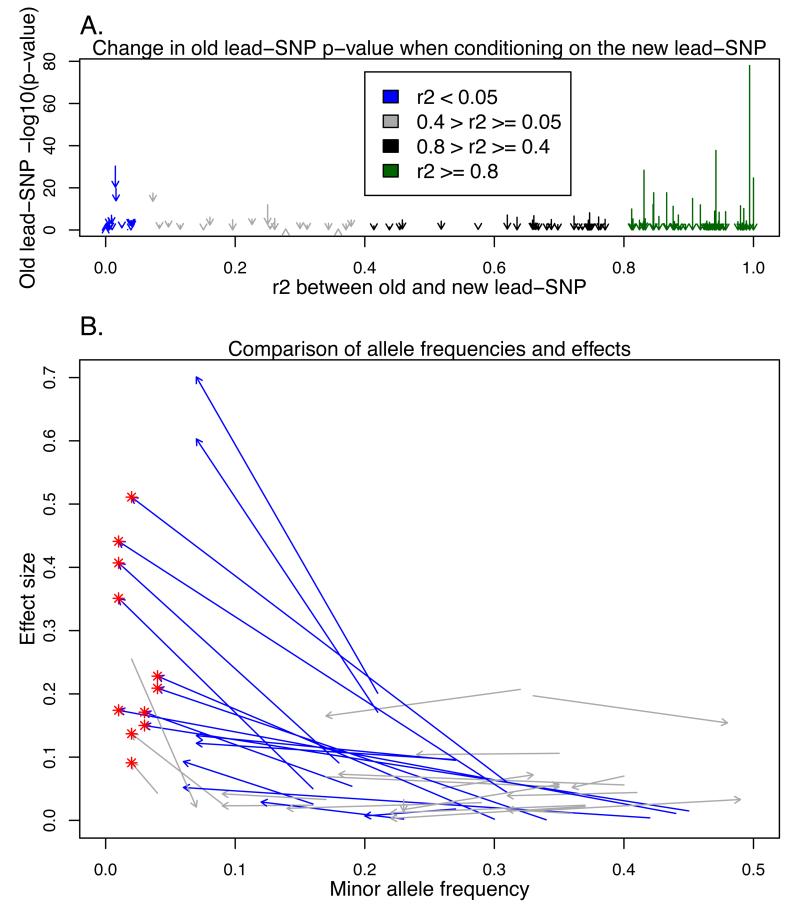
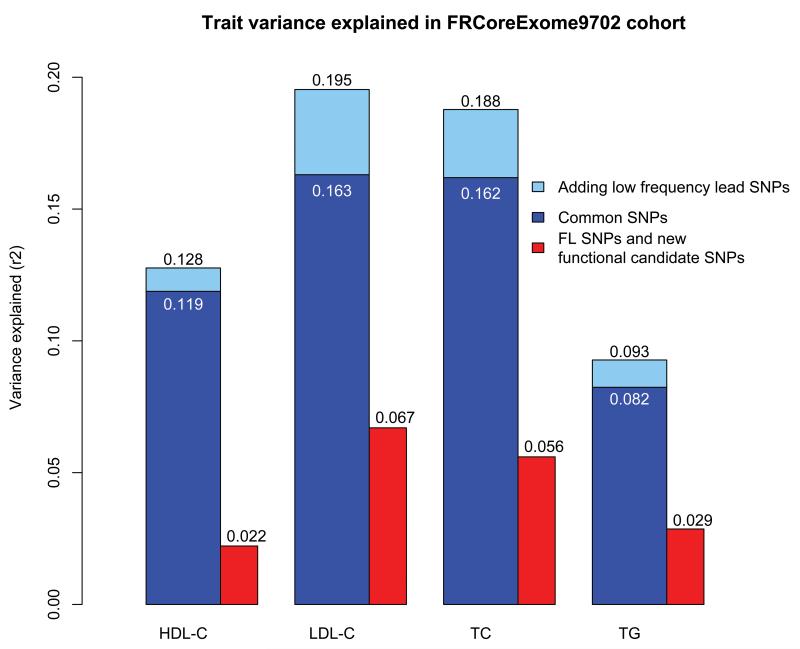
Using a genome-wide screen of 9.6 million genetic variants achieved through 1000 Genomes Project imputation in 62,166 samples, we identify association to lipid traits in 93 loci, including 79 previously identified loci with new lead SNPs and 10 new loci, 15 loci with a low-frequency lead SNP and 10 loci with a missense lead SNP, and 2 loci with an accumulation of rare variants. In six loci, SNPs with established function in lipid genetics (CELSR2, GCKR, LIPC and APOE) or candidate missense mutations with predicted damaging function (CD300LG and TM6SF2) explained the locus associations. The low-frequency variants increased the proportion of variance explained, particularly for low-density lipoprotein cholesterol and total cholesterol. Altogether, our results highlight the impact of low-frequency variants in complex traits and show that imputation offers a cost-effective alternative to resequencing.


Figures

Figures 1A-B
Figures 1A-B
Change in p-value after analysis conditional on the new lead-SNP and comparison of new and previously reported lead-SNP effect sizes and allele frequencies per locus. In both figures, each of the arrows represent one locus and trait, where significant association was found in our screening and in one of the previously published large-scale screening studies, and the colouring is based on the linkage disequilibrium (LD) between the old and new lead-SNP. The red ‘*’ represents for the new low-frequency lead-SNPs. In the Figure 1A, on the Y-axis are the −log10 p-values, arrows starting from the p-value seen in the unconditional analysis in Finnish subset (N = 12,834) and pointing to the p-value in analysis conditional on the new lead-SNP. In Figure 1B, each arrow starts from established lead-SNP effect and minor allele frequency (MAF) and points to the corresponding values for the new lead-SNP. The effects have been estimated in the FRCoreExome9702 sample set (N = 5,119), independent of the discovery set. Only results for loci with r2<0.4 have been presented for clarity.
Figures 2A-B
Figures 2A-B
Regional association plots of the conditional analysis in loci where the new functional candidate SNPs explain the genome-wide association. Figure 2A illustrates the results in SOST-DUSP3 locus for TG and Figure 2B results in CILP2 locus for TC in Finnish subset (N = 12,834). In these figures, the first panel shows the −log10 p-value of each variant as a dot whose size reflects the effect size. The second panel shows the recombination rate in the area and the third panel shows the positions of genes. X-axis is the physical position in the genome. In grey are the association results from the unconditional analysis with green dots representing the new functional candidate SNPs. Black dots are the results from the conditional analysis.
Figures 2A-B
Figures 2A-B
Regional association plots of the conditional analysis in loci where the new functional candidate SNPs explain the genome-wide association. Figure 2A illustrates the results in SOST-DUSP3 locus for TG and Figure 2B results in CILP2 locus for TC in Finnish subset (N = 12,834). In these figures, the first panel shows the −log10 p-value of each variant as a dot whose size reflects the effect size. The second panel shows the recombination rate in the area and the third panel shows the positions of genes. X-axis is the physical position in the genome. In grey are the association results from the unconditional analysis with green dots representing the new functional candidate SNPs. Black dots are the results from the conditional analysis.
Figure 3
Figure 3
Proportion of total trait variance explained by the lead-SNPs and functional SNPs. The proportion of the trait variance explained by different SNP-sets has been estimated in independent FRCoreExome9702 sample set (N = 5,119). All lead-SNPs from the three association screens (Teslovich et al., Willer et al. and our screen) together with the known functional lipid SNPs (FL SNPs) and new functional candidate SNPs were grouped based on their allele frequency in the FRCoreExome9702 dataset to common SNPs (allele frequency > 5%) and to low-frequency SNPs (allele frequency ≤ 5%). The variance explained by these two groups is presented with blue bars. The proportion of variance explained by the FL SNPs and functional candidates is presented with the red bar.

References

    1. Gibson G. Rare and common variants: twenty arguments. Nat Rev Genet. 2012;13:135–145. - PMC - PubMed
    1. Teslovich T, et al. Biological, clinical and population relevance of 95 loci for blood lipids. Nature. 2010;466:707–713. - PMC - PubMed
    1. Willer C, et al. Discovery and Refinement of Loci Associated with Lipid Levels. Nat. Genet. 2013 doi: 10.1038/ng.2797. - DOI - PMC - PubMed
    1. 1000 Genomes Project Consortium et al. An integrated map of genetic variation from 1,092 human genomes. Nature. 2012;491:56–65. - PMC - PubMed
    1. Marchini J, Howie B, Myers S, McVean G, Donnelly P. A new multipoint method for genome-wide association studies by imputation of genotypes. Nat. Genet. 2007;38:906–913. - PubMed

Publication types