. 2015 May 7;16(5):10426-42.
doi: 10.3390/ijms160510426.

Humic Acid Increases Amyloid β-Induced Cytotoxicity by Induction of ER Stress in Human SK-N-MC Neuronal Cells

Affiliations

Humic Acid Increases Amyloid β-Induced Cytotoxicity by Induction of ER Stress in Human SK-N-MC Neuronal Cells

Hsin-Hua Li et al. Int J Mol Sci. .

Abstract

Humic acid (HA) is a possible etiological factor associated with for several vascular diseases. It is known that vascular risk factors can directly increase the susceptibility to Alzheimer's disease (AD), which is a neurodegenerative disorder due to accumulation of amyloid β (Aβ) peptide in the brain. However, the role that HA contributes to Aβ-induced cytotoxicity has not been demonstrated. In the present study, we demonstrate that HA exhibits a synergistic effect enhancing Aβ-induced cytotoxicity in cultured human SK-N-MC neuronal cells. Furthermore, this deterioration was mediated through the activation of endoplasmic reticulum (ER) stress by stimulating PERK and eIF2α phosphorylation. We also observed HA and Aβ-induced cytotoxicity is associated with mitochondrial dysfunction caused by down-regulation of the Sirt1/PGC1α pathway, while in contrast, treating the cells with the ER stress inhibitor Salubrinal, or over-expression of Sirt1 significantly reduced loss of cell viability by HA and Aβ. Our findings suggest a new mechanism by which HA can deteriorate Aβ-induced cytotoxicity through modulation of ER stress, which may provide significant insights into the pathogenesis of AD co-occurring with vascular injury.


Figures

Figure 1
Figure 1
Humic acid (HA) enhances exogenous Aβ-induced apoptosis in human SK-N-MC cells. (A) Cells were treated with either 0, 10, 50, 100 or 200 μg/mL HA, and co-treated with or without 2.5 μM Aβ for 24 h followed by 3-(4,5-dimethylthiazol-2-yl)-2,5-diphenyltetrazolium bromide (MTT) assays; (B) Cells were treated with either 0, 1.25, 2.5 or 5 μM Aβ with or without 100 μg/mL HA for 24 h followed by MTT assays. Co-treatment of the cells with HA further increased Aβ-induced cell death compared to the Aβ alone groups; (C) HA markedly increased Aβ-induced nucleus fragmentation. Apoptosis was determined by fragmented morphology in nuclei for DAPI fluorescence; (D) Aβ-induced cell death was determined by western blotting of cleaved caspase 3 and PARP levels, showing a synergistically enhanced apoptosis after HA concomitant treatments. HA, humic acid. FA, fulvic acid. All results are shown from three independent experiments, and values are presented as mean ± SEM. Significant differences was determined by using the multiple comparisons of Dunnett’s post-hoc test for ** p < 0.01. Scale bar represents 50 μm.
Figure 2
Figure 2
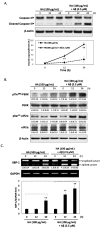
HA increases Aβ-induced ER stress. SK-N-MC cells were treated with 100 μg/mL HA with or without 2.5 μM Aβ for 0 to 24 h. (A) Immunoblotting of caspase 4 showed HA causes cleavage of caspase 4, and that co-treatment with Aβ increases this cleavage in a time-dependent manner. The lower panel displays quantitative analyses showing cleaved caspase 4/β-actin ratios; (B) Western blots showed the activation of the ER stress by monitoring the phosphorylation of PERK and eIF2α in cells treated with HA alone, or in combination with Aβ for 0 to 24 h; (C) RT-PCR analysis showed the splicing of XBP-1 mRNA for the indicated time in cells treated with HA alone, or in combination with Aβ for 0, 12 or 24 h; (D) Salubrinal, an ER stress inhibitor blocked HA and Aβ-mediated ER stress-induced PERK and eIF2α phosphorylation at 24 h; (E) Cell viabilities were significantly increased in Salubrinal-treated cells compared to HA and Aβ co-treated cells for 24 h. All results are shown from three independent experiments, and values are presented as mean ± SEM. Significant differences was determined by using the multiple comparisons of Dunnett’s post-hoc test for ** p < 0.01.
Figure 2
Figure 2
HA increases Aβ-induced ER stress. SK-N-MC cells were treated with 100 μg/mL HA with or without 2.5 μM Aβ for 0 to 24 h. (A) Immunoblotting of caspase 4 showed HA causes cleavage of caspase 4, and that co-treatment with Aβ increases this cleavage in a time-dependent manner. The lower panel displays quantitative analyses showing cleaved caspase 4/β-actin ratios; (B) Western blots showed the activation of the ER stress by monitoring the phosphorylation of PERK and eIF2α in cells treated with HA alone, or in combination with Aβ for 0 to 24 h; (C) RT-PCR analysis showed the splicing of XBP-1 mRNA for the indicated time in cells treated with HA alone, or in combination with Aβ for 0, 12 or 24 h; (D) Salubrinal, an ER stress inhibitor blocked HA and Aβ-mediated ER stress-induced PERK and eIF2α phosphorylation at 24 h; (E) Cell viabilities were significantly increased in Salubrinal-treated cells compared to HA and Aβ co-treated cells for 24 h. All results are shown from three independent experiments, and values are presented as mean ± SEM. Significant differences was determined by using the multiple comparisons of Dunnett’s post-hoc test for ** p < 0.01.
Figure 3
Figure 3
HA increases Aβ-induced mitochondria dysfunction and H2O2 production. (A) The mitochondrial membrane potential stained with JC-1 dye was observed by fluorescent microscopy. After co-treatment of HA and Aβ, SK-N-MC cells showed more intense green fluorescence than non-treated and Salubrinal-treated cells; (B) Intracellular oxidative bursts were determined by dichlorofluorescin diacetate (DCFH-DA) staining. Cells were treated with the indicated compounds for 24 h. After treatment, cells were stained by DCFH-DA and visualized by using fluorescence microscopy; (C) Measurements of H2O2 production from SK-N-MC cells by Amplex red fluorometric method. Co-treatment of HA and Aβ significantly induced H2O2 production parallel to decreased mitochondrial membrane potential; (D) Western blotting assays showed that co-treatment of HA and Aβ inhibits PGC1α expression, whereas the addition of Salubrinal significantly returns this inhibition; (E) The mRNA levels of SOD1, SOD2 and catalase were detected by real time PCR, showing that HA and Aβ-treated SK-N-MC cells express significantly less mRNA than non-treated and Salubrinal-treated cells. All results are shown from three independent experiments, and values are presented as mean ± SEM. Significant differences were determined by using the multiple comparisons of Dunnett’s post-hoc test for * p < 0.05 and ** p < 0.01. Scale bar represents 50 μm.
Figure 3
Figure 3
HA increases Aβ-induced mitochondria dysfunction and H2O2 production. (A) The mitochondrial membrane potential stained with JC-1 dye was observed by fluorescent microscopy. After co-treatment of HA and Aβ, SK-N-MC cells showed more intense green fluorescence than non-treated and Salubrinal-treated cells; (B) Intracellular oxidative bursts were determined by dichlorofluorescin diacetate (DCFH-DA) staining. Cells were treated with the indicated compounds for 24 h. After treatment, cells were stained by DCFH-DA and visualized by using fluorescence microscopy; (C) Measurements of H2O2 production from SK-N-MC cells by Amplex red fluorometric method. Co-treatment of HA and Aβ significantly induced H2O2 production parallel to decreased mitochondrial membrane potential; (D) Western blotting assays showed that co-treatment of HA and Aβ inhibits PGC1α expression, whereas the addition of Salubrinal significantly returns this inhibition; (E) The mRNA levels of SOD1, SOD2 and catalase were detected by real time PCR, showing that HA and Aβ-treated SK-N-MC cells express significantly less mRNA than non-treated and Salubrinal-treated cells. All results are shown from three independent experiments, and values are presented as mean ± SEM. Significant differences were determined by using the multiple comparisons of Dunnett’s post-hoc test for * p < 0.05 and ** p < 0.01. Scale bar represents 50 μm.
Figure 4
Figure 4
Sirt1 protects neuronal cells from HA and Aβ-induced PGC1α suppression and cytotoxicity. (A) Western blotting assays showed the co-treatment of HA and Aβ inhibits expressions of Sirt1 and PGC1α. However, the addition of Salubrinal (50 μM) significantly blocked these inhibitions; (B) Sirt1 over-expression significantly restores HA and Aβ-inhibited PGC1α levels, (C) and contributes to a better survival rate in HA and Aβ co-treated cells; (D) Sirt1 over-expression failed to inhibit the levels of p-Thr980 PERK and p-Ser51 eIF2α in HA and Aβ co-treated cells, indicating that ER stress occurs upstream of Sirt1 down-regulation. All results are shown from three independent experiments, and values are presented as mean ± SEM. Significant differences were determined by using multiple comparisons of Dunnett’s post-hoc test for ** p < 0.01.
Figure 4
Figure 4
Sirt1 protects neuronal cells from HA and Aβ-induced PGC1α suppression and cytotoxicity. (A) Western blotting assays showed the co-treatment of HA and Aβ inhibits expressions of Sirt1 and PGC1α. However, the addition of Salubrinal (50 μM) significantly blocked these inhibitions; (B) Sirt1 over-expression significantly restores HA and Aβ-inhibited PGC1α levels, (C) and contributes to a better survival rate in HA and Aβ co-treated cells; (D) Sirt1 over-expression failed to inhibit the levels of p-Thr980 PERK and p-Ser51 eIF2α in HA and Aβ co-treated cells, indicating that ER stress occurs upstream of Sirt1 down-regulation. All results are shown from three independent experiments, and values are presented as mean ± SEM. Significant differences were determined by using multiple comparisons of Dunnett’s post-hoc test for ** p < 0.01.

References

    1. Schulten H.R., Schnitzer M. A state of the art structural concept for humic substances. Naturwissenschaften. 1993;80:29–30. doi: 10.1007/BF01139754. - DOI
    1. Schmidt G., Pesch R., Schröder W., Conrad A., Kolossa-Gehring M., Feigenspan S., Dobler L., Wiesmüller G.A., Birke M., Utermann J. The potential of spatial information in human biomonitoring by example of two German environmental epidemiology studies. Environ. Geochem. Health. 2011;33:399–408. doi: 10.1007/s10653-011-9383-5. - DOI - PubMed
    1. Lu F.J. Blackfoot disease: Arsenic or humic acid? Lancet. 1990;336:115–116. doi: 10.1016/0140-6736(90)91629-O. - DOI - PubMed
    1. Gau R.J., Yang H.L., Suen J.L., Lu F.J. Induction of oxidative stress by humic acid through increasing intracellular iron: A possible mechanism leading to atherothrombotic vascular disorder in blackfoot disease. Biochem. Biophys. Res. Commun. 2001;283:743–749. doi: 10.1006/bbrc.2001.4832. - DOI - PubMed
    1. Tousoulis D., Briasoulis A., Papageorgiou N., Tsioufis C., Tsiamis E., Toutouzas K., Stefanadis C. Oxidative stress and endothelial function: Therapeutic interventions. Recent Pat. Cardiovasc. Drug Discov. 2011;6:103–114. doi: 10.2174/157489011795933819. - DOI - PubMed

Publication types

MeSH terms