. 2015 May 11;10(5):e0126229.
doi: 10.1371/journal.pone.0126229. eCollection 2015.

Small Heat Shock Protein Beta-1 (HSPB1) Is Upregulated and Regulates Autophagy and Apoptosis of Renal Tubular Cells in Acute Kidney Injury

Affiliations

Small Heat Shock Protein Beta-1 (HSPB1) Is Upregulated and Regulates Autophagy and Apoptosis of Renal Tubular Cells in Acute Kidney Injury

Tatsuki Matsumoto et al. PLoS One. .

Abstract

Background: Heat shock protein beta-1 (HSPB1, also known as HSP27) is a small heat shock protein involved in many cellular processes and reportedly protects cells against oxidative stress. Autophagy protects cells from many types of stress and is thought to play a key role in preventing stress in acute kidney injury (AKI). However, little is known about the role of HSPB1 in autophagy and apoptosis in the pathogenesis of AKI.

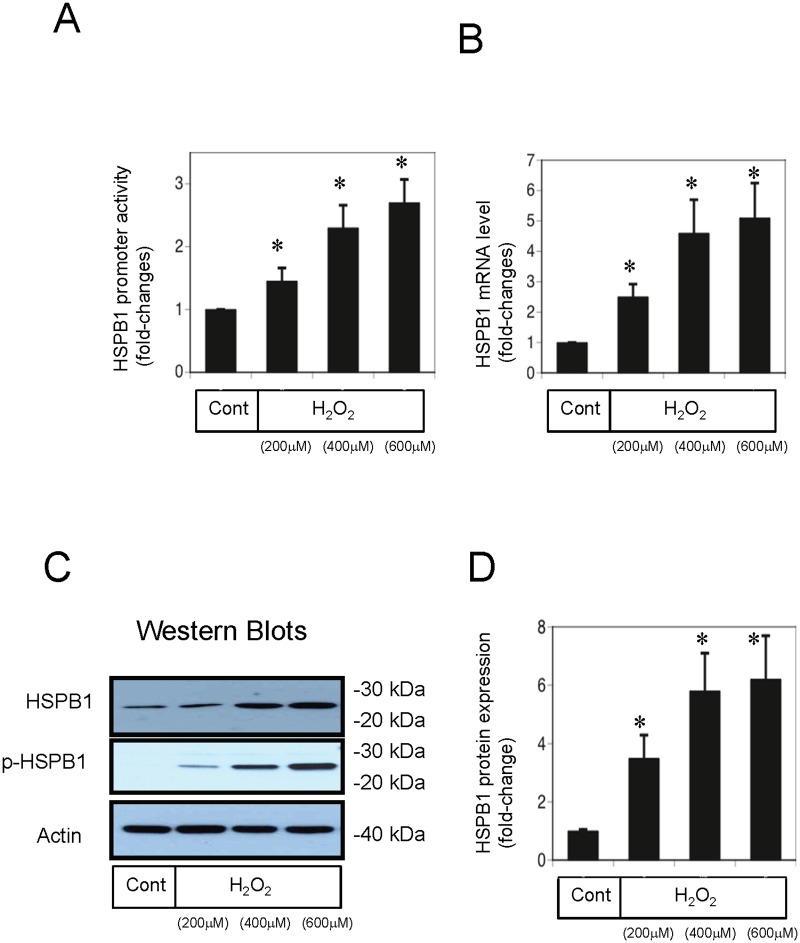
Methods: We used a rat ischemia/reperfusion AKI model and cultured renal tubular cells as an in vitro model. To elucidate the regulation of HSPB1, we evaluated the promoter activity and expression of HSPB1 in normal rat kidney (NRK)-52E cells in the presence of H2O2. To examine the regulation of autophagy by HSPB1, we established NRK-light chain 3 (NRK-LC3) cells that were stably transfected with a fusion protein of green fluorescent protein and LC3.

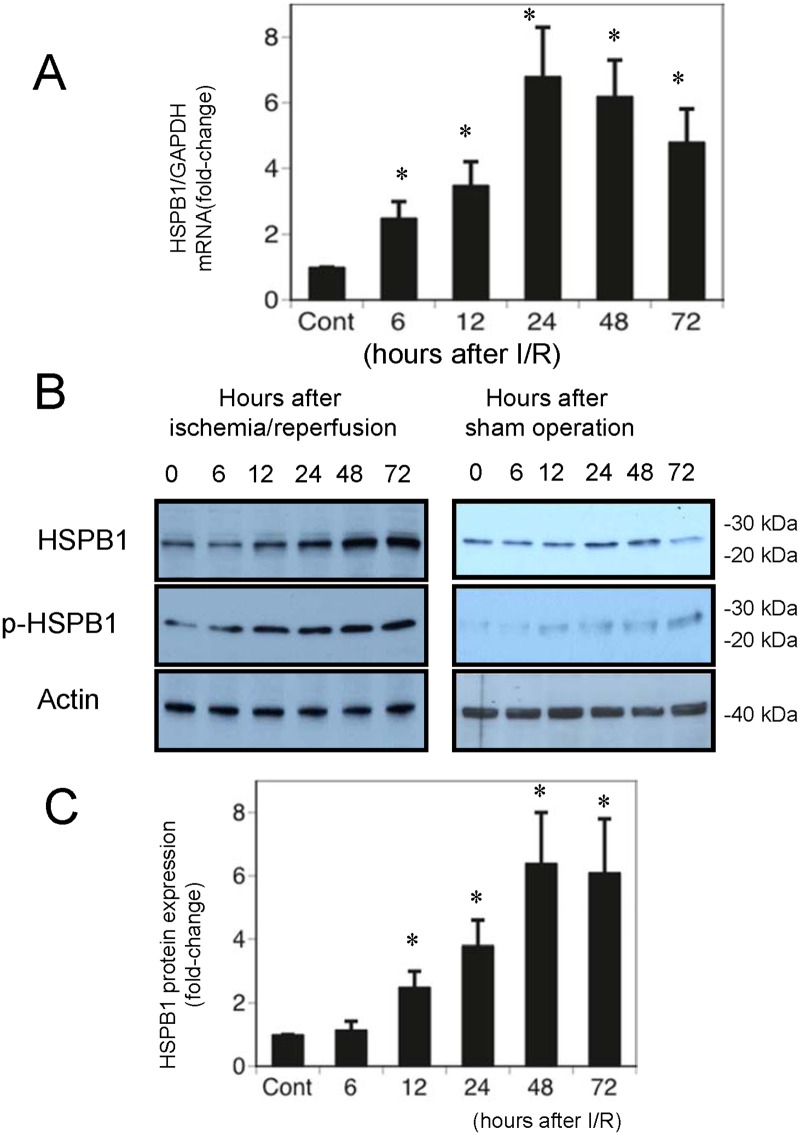
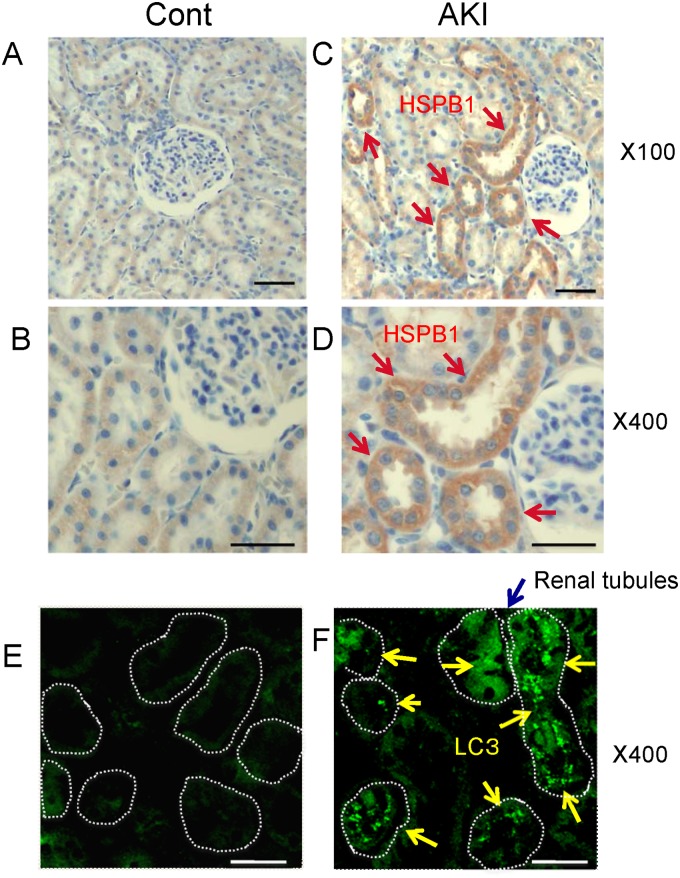
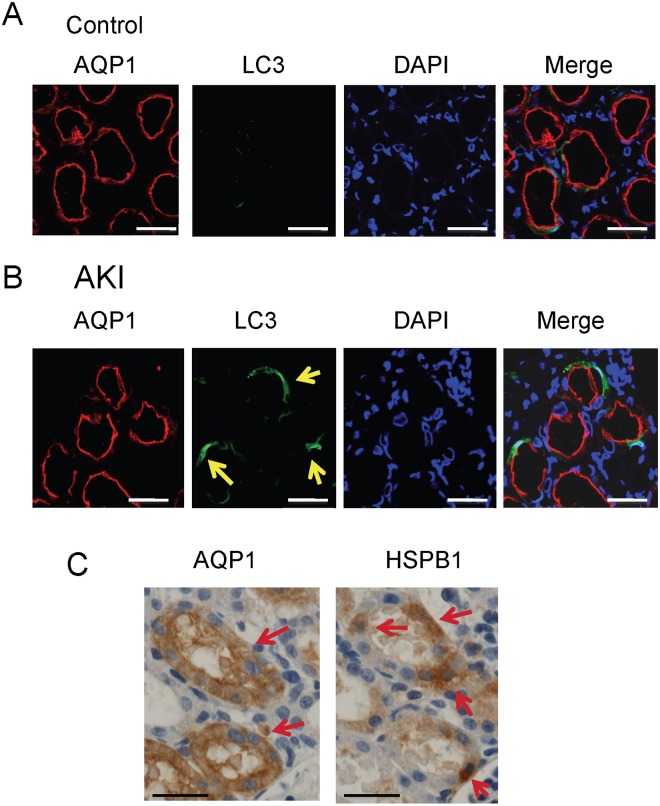
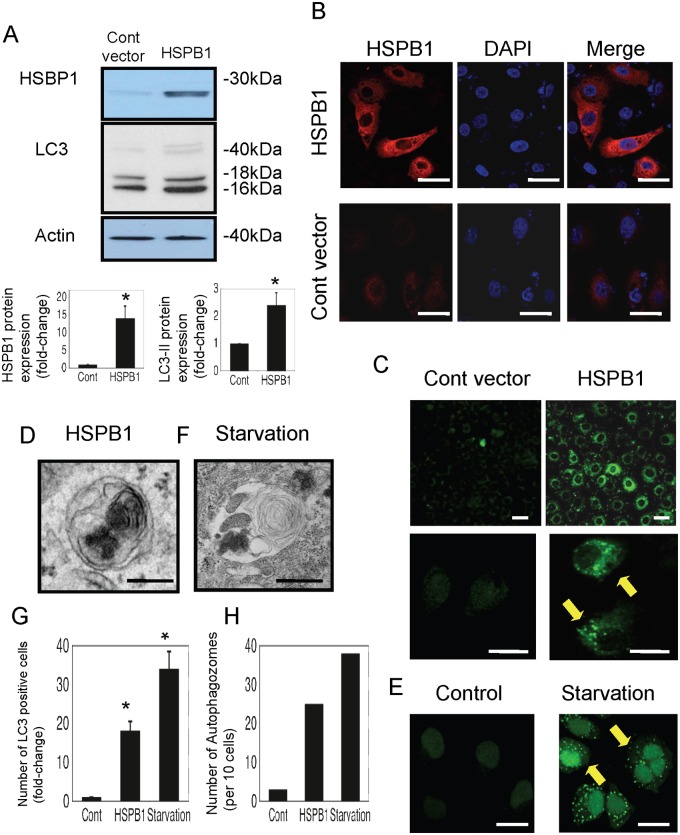
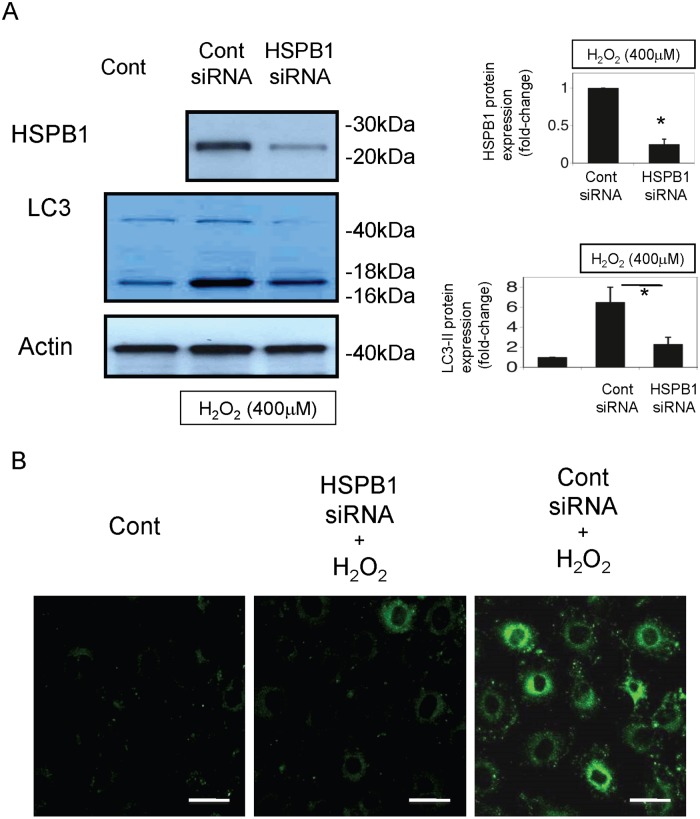
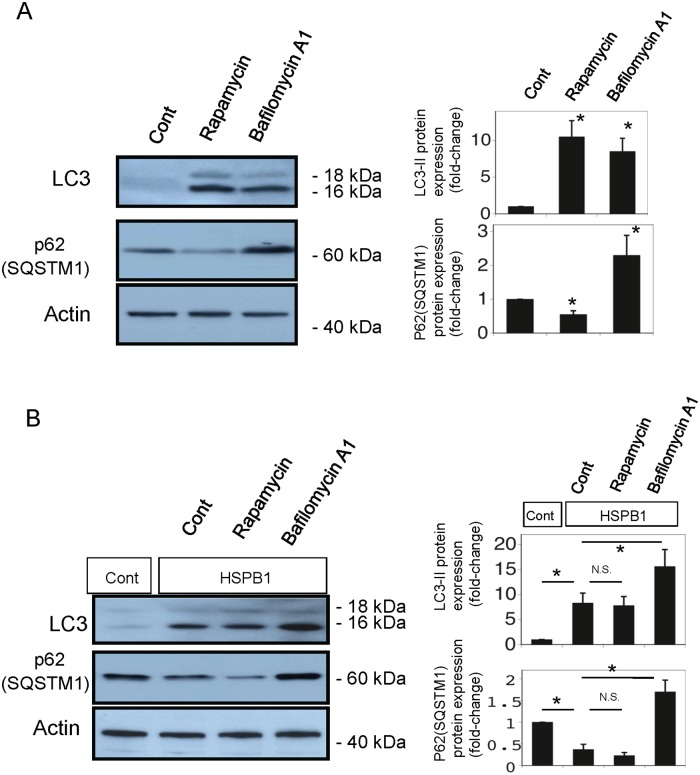
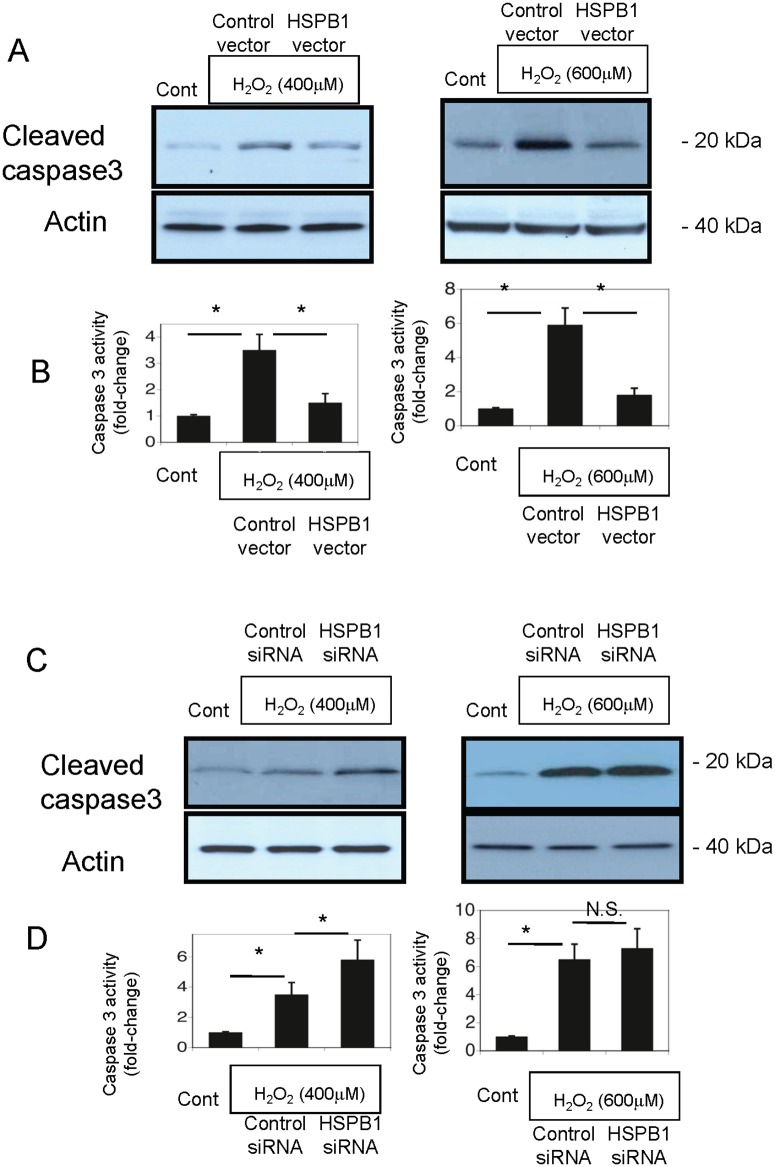
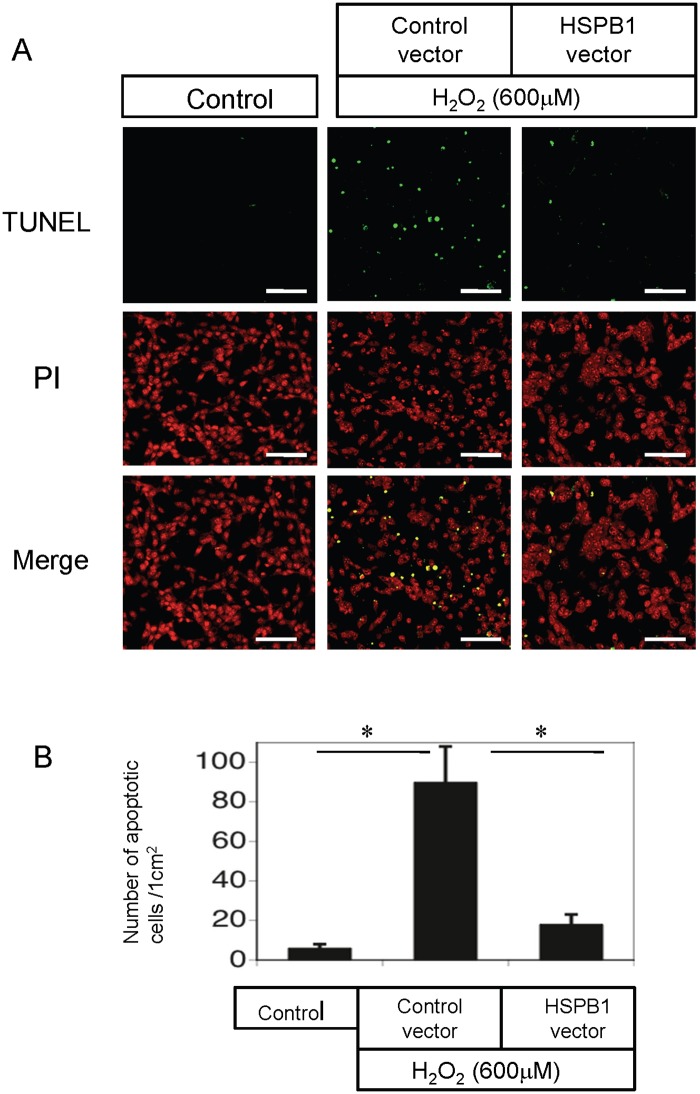
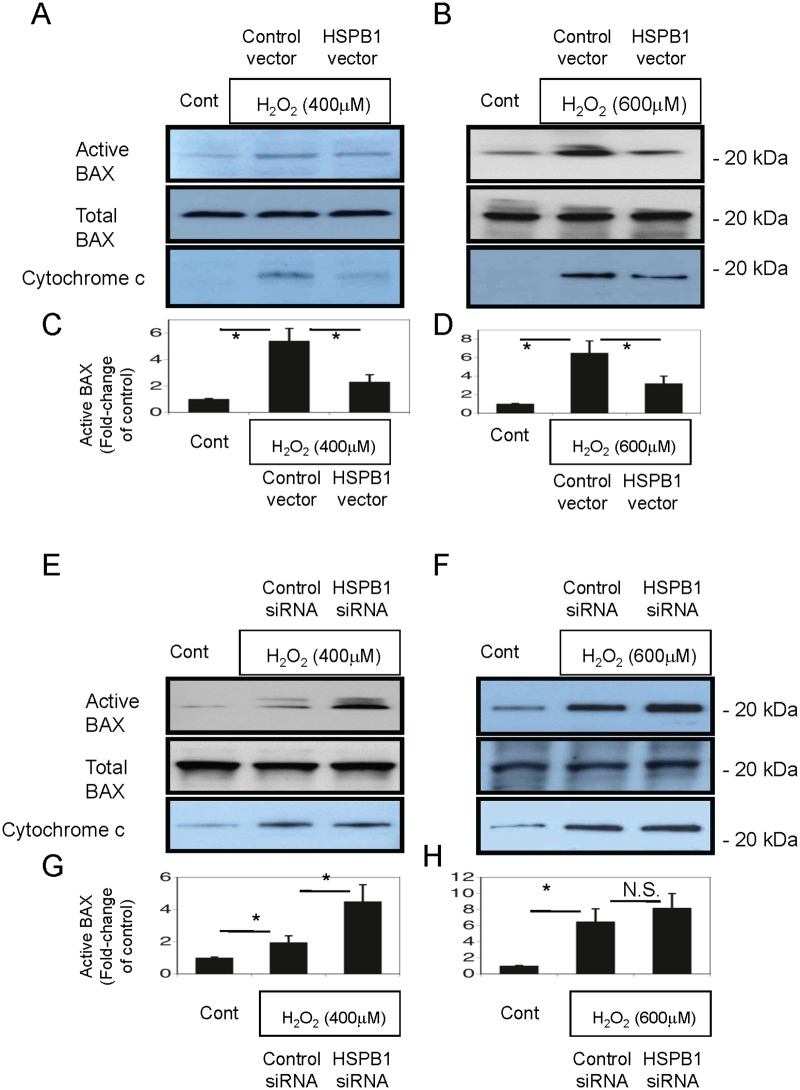
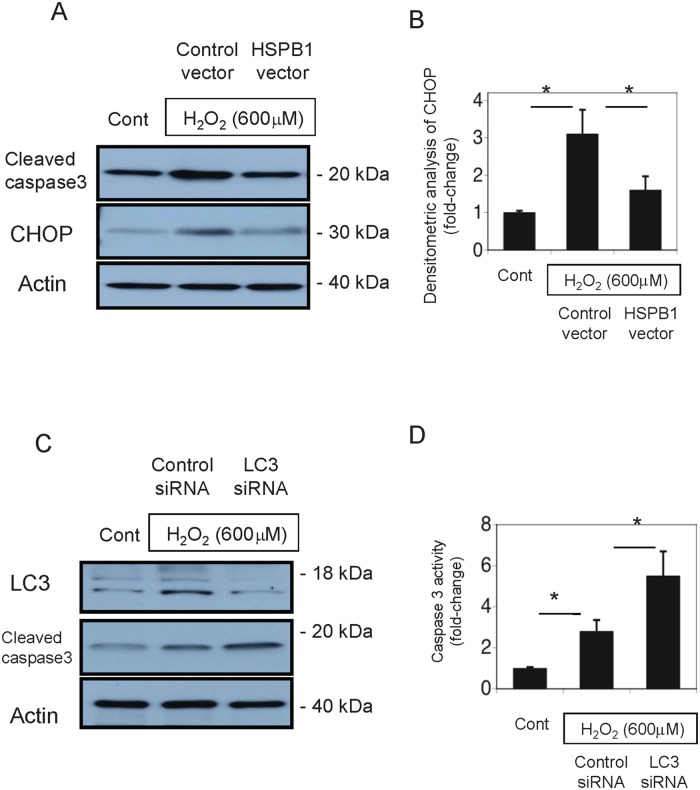
Results: The results of immunohistological examination showed that HSPB1 was expressed in proximal tubule cells after AKI. Real-time quantitative reverse transcription-polymerase chain reaction and western blot analysis showed that HSPB1 messenger RNA and protein expression were upregulated 6-72 h and 12-72 h, respectively, after ischemia/reperfusion injury. HSPB1 promoter activity as well as messenger RNA and protein expression indicated dose-dependent induction by H2O2. HSPB1 overexpression-induced autophagy in NRK-LC3 cells under normoxic conditions was confirmed with confocal microscopy, which revealed the presence of LC3-positive granules. Furthermore, H2O2-induced autophagy was inhibited by the transfection of small interfering RNAs for HSPB1. Overexpression of HSPB1 reduced BAX activation and H2O2-induced apoptosis, as measured by caspase 3 activity and terminal deoxynucleotidyl transferase deoxyuridine triphosphate nick end labeling assay.

Conclusions: We showed that HSPB1 expression increased during oxidative stress in AKI. Incremental HSPB1 expression increased autophagic flux and inhibited apoptosis in renal tubular cells. These results indicate that HSPB1 upregulation plays a role in the pathophysiology of AKI.


Conflict of interest statement

Competing Interests: The authors have declared that no competing interests exist.

Figures

Fig 1
Fig 1. Ischemic/reperfusion (I/R) acute kidney injury (AKI) upregulates messenger RNA (mRNA) and protein expression of heat shock protein beta-1 (HSPB1).
The left renal artery was clamped for 60 min, and the kidneys were excised 6, 12, 24, 48, and 72 h after reperfusion. Sham-operated rats killed at 0 h served as controls. (A) HSPB1 mRNA expression was measured with real-time quantitative polymerase chain reaction and normalized to levels of glyceraldehyde-3-phosphate dehydrogenase mRNA. (B) Protein (50 μg) from renal tissue extracts was separated on sodium dodecyl sulfate-polyacrylamide gel electrophoresis (SDS-PAGE) gels. HSPB1 and phospho-HSPB1 were detected with western blot analysis. Actin served as the loading control. (C) Quantitative densitometry was performed for HSPB1. Data are presented as means ± standard error of the mean (SEM); n = 5; *P < 0.05 vs. control rats.
Fig 2
Fig 2. Immunohistochemical analysis showed that HSPB1 and light chain 3 (LC3) expression increased in proximal tubules after I/R AKI.
Immunohistochemical analysis of HSPB1 expression in (A, B) the renal cortex of a control kidney (magnification, 100× and 400×) and (C) the renal cortex of a kidney 24 h after I/R injury (magnification, 100×). (D) High-power view of the renal cortex of a kidney 24 h after I/R injury (stained with anti-HSPB1 antibody; magnification, 400×). (E) Immunohistochemical analysis of LC3 expression in the renal cortex of a control kidney (magnification, 400×). (F) Immunohistochemical analysis of LC3 expression in the renal cortex 24 h after I/R injury (magnification, 400×). All scale bars represent 50 μm.
Fig 3
Fig 3. HSPB1 and LC3 are expressed in the same proximal tubules after I/R AKI.
Immunohistochemical analysis of aquaporin-1 (AQP1) and LC3 expression in the renal cortex of (A) a control kidney and (B) a kidney 24 h after I/R injury. Confocal microscopy examination showed that AQP1 and LC3 are present in the same renal tubules 24 h after I/R injury. (C) Immunohistochemical analysis of AQP1 and HSPB1 expression in continuous sections in the renal cortex 24 h after I/R injury (magnification, 400×). All scale bars represent 50 μm.
Fig 4
Fig 4. HSPB1 promoter activity, mRNA levels, and protein expression are increased in normal rat kidney (NRK)-52E cells under oxidative stress.
NRK-52E cells were exposed to H2O2 (200, 400, or 600 μM) for 4 h, and (A) HSPB1 promoter activity was measured with luciferase assays, (B) HSPB1 mRNA levels were measured with polymerase chain reaction, and (C) HSPB1 protein and phospho-HSPB1 protein expression was measured with western blot analysis. (D) Densitometric analysis of HSPB1 protein expression after H2O2 exposure (200, 400, or 600 μM). Data are presented as means ± SEM, n = 5; *P < 0.05 vs. control cells.
Fig 5
Fig 5. LC3 expression is increased by the overexpression of HSPB1 in NRK-LC3 cells.
(A) Western blotting of HSPB1 and LC3 in control or HSPB1-overexpressing NRK-52E cells. Densitometric analysis of HSPB1 protein and LC3-II protein expression after transfection. Data are presented as means ± SEM, n = 5; *P < 0.05 vs. control vector. (B) Immunofluorescence examination of HSPB1 expression in control vector-transfected and HSPB1 expression vector-transfected NRK-52E cells. All scale bars represent 20 μm. (C) Confocal microscopy examination of green fluorescent protein-positive autophagosomes in NRK-LC3 cells transfected with control or HSPB1 expression vectors. All scale bars represent 20 μm. (D) Electron micrograph of autophagosomes in cells that overexpressed HSPB1. Scale bar represents 200 nm. (E) Confocal micrograph of green fluorescent protein-positive autophagosomes in NRK-LC3 cells incubated under starvation conditions. All scale bars represent 20 μm. (F) Electron micrograph of autophagosomes in cells under starvation conditions. Scale bar represents 200 nm. (G) The number of LC3-positive cells that overexpressed HSPB1 or the control vector under starvation conditions, determined with confocal microscopy. Data are presented as means ± SEM, n = 5; *P < 0.05 vs. control cells. (H) The number of autophagosomes in 10 cells that overexpressed HSPB1 and the control vector, determined with electron microscopy.
Fig 6
Fig 6. LC3 expression is reduced by HSPB1 small interfering RNA (siRNA) in NRK-LC3 cells.
(A) Western blotting of HSPB1 and LC3 in control or HSPB1 siRNA-transfected NRK-52E cells incubated with 400 μM H2O2 for 4 h. Densitometric analysis of HSPB1 protein and LC3-II protein expression after H2O2 exposure (400 μM). Data are presented as means ± SEM, n = 5; *P < 0.05 vs. control siRNA. (B) Confocal micrograph of green fluorescent protein-positive autophagosomes in HSPB1 siRNA-transfected NRK-LC3 cells incubated with 400 μM H2O2. All scale bars represent 20 μm.
Fig 7
Fig 7. Autophagic flux is induced by overexpression of HSPB1 in NRK-52E cells.
NRK-52E cells were exposed to rapamycin or bafilomycin A1. (A) Aliquots of 50 μg protein from NRK-52E cell extracts were separated with SDS-PAGE and transferred to membranes. LC3 and p62(SQSTM1) were detected with western blot analysis. Actin served as a loading control. Densitometric analysis of LC3-II protein and p62(SQSTM1) protein expression after exposure to rapamycin or bafilomycin A1. Data are presented as means ± SEM, n = 5; *P < 0.05 vs. control. NRK-52E cells transfected with HSPB1 expression vector were exposed to rapamycin or bafilomycin A1. (B) Aliquots of 50 μg protein from HSPB1-overexpressing NRK-52E cell extracts were separated with SDS-PAGE and transferred to membranes. LC3 and p62(SQSTM1) were detected with western blot analysis. Actin served as a loading control. Densitometric analysis of LC3-II protein and p62(SQSTM1) protein expression after exposure to rapamycin or bafilomycin A1. Data are presented as means ± SEM, n = 5; *P < 0.05 vs. control.
Fig 8
Fig 8. Apoptosis is reduced by HSPB1 overexpression and increased by siRNA for HSPB1 in NRK-52E cells.
(A, B) Western blot analysis of cleaved caspase 3 (CASP3) expression and caspase 3 activity in control or HSPB1-overexpressing NRK-52E cells after incubation with 400 and 600 μM H2O2. (C, D) Western blot analysis of cleaved CASP3 expression and caspase 3 activity in NRK-52E cells transfected with siRNA for HSPB1 or control scrambled siRNA after incubation with 400 and 600 μM H2O2. Data are presented as means ± SEM, n = 6; *P < 0.05.
Fig 9
Fig 9. Terminal deoxynucleotidyl transferase deoxyuridine triphosphate nick end labeling (TUNEL)-positive cells are increased by oxidative stress in NRK-52E cells.
(A) TUNEL assay to evaluate apoptosis in NRK-52E cells exposed to 600 μM H2O2. Nuclei were stained with propidium iodide (red). The number of apoptotic cells (green) was reduced by transfection with the HSPB1 expression vector. All scale bars represent 100 μm. (B) Quantitative analysis demonstrated that under oxidative stress induced by 600 μM H2O2, the number of apoptotic cells per square centimeter was significantly reduced by transfection with the HSPB1 expression vector. Data are presented as means ± SEM, n = 6; *P < 0.05 vs. pcDNA-transfected cells or control.
Fig 10
Fig 10. BAX activation and cytochrome c release in NRK-52E cells are reduced by overexpression of HSPB1 after H2O2 treatment.
(A, B) Determination of active BAX content assessed with a conformation-specific antibody directed against the 6A7 epitope, total BAX content, and cytochrome c of cytosol fractions in control NRK-52E cells and NRK-52E cells transfected with pcDNA or the HSPB1 overexpression vector and treated with 400 and 600 μM H2O2 for 4 h. (C, D) Quantitative analysis with a densitometer showed a marked reduction in BAX activation when cells were transfected with the HSPB1 expression vector. Data are presented as means ± SEM, n = 6; *P < 0.05. (E, F) NRK-52E cells were transfected with control scrambled siRNA or HSPB1 siRNA, and the active BAX, total BAX, and cytochrome c of cytosol fractions were examined in control cells and cells exposed to 400 and 600 μM H2O2 for 4 h. (G, H) Quantitative analysis with a densitometer demonstrated that HSPB1 regulated BAX activation in NRK-52E cells. Data are presented as means ± SEM, n = 6; *P < 0.05 vs. control.
Fig 11
Fig 11. HSPB1 reduced an endoplasmic reticulum (ER) stress marker in H2O2-treated NRK-52E cells, and inhibition of LC3 increased cleaved CASP3.
(A) NRK-52E cells were transfected with a control vector or HSPB1 expression vector, and the expressions of cleaved CASP3 and CHOP were examined after exposure to 600 μM H2O2 for 4 h. (B) Quantitative analysis with a densitometer demonstrated that HSPB1 reduced CHOP expression in NRK-52E cells. (C) NRK-52E cells were transfected with control siRNA or siRNA for LC3. The expressions of LC3 and cleaved CASP3 were examined in cells exposed to 600 μM H2O2 for 4 h. (D) Caspase 3 activity in NRK-52E cells transfected with siRNA for LC3 or control scrambled siRNA after incubation with 600 μM H2O2 for 4 h. Data are presented as means ± SEM, n = 6; *P < 0.05.

Similar articles

Cited by

References

    1. Devarajan P (2006) Update on mechanisms of ischemic acute kidney injury. J Am Soc Nephrol 17:1503–1520. - PubMed
    1. Bonventre J V (2003) Dedifferentiation and proliferation of surviving epithelial cells in acute renal failure. J Am Soc Nephrol 14:S55–61. - PubMed
    1. Wallin A, Zhang G, Jones TW, Jaken S, Stevens J. (1992) Mechanism of the nephrogenic repair response. Studies on proliferation and vimentin expression after 35S-1, 2-dichlorovinyl-L-cysteine nephrotoxicity in vivo and in cultured proximal tubule epithelial cells. Lab Invest 66:474–484. - PubMed
    1. Inoue K, Kuwana H, Shimamura Y, Ogata K, Taniguchi Y, Kagawa T, et al. (2010) Cisplatin-induced macroautophagy occurs prior to apoptosis in proximal tubules in vivo. Clin Exp Nephrol 14:112–122. 10.1007/s10157-009-0254-7 - DOI - PubMed
    1. Huber TB, Edelstein CL, Hartleben B, Inoki K, Jiang M, Koya D, et al. (2012) Emerging role of autophagy in kidney function, diseases and aging. Autophagy 8:1–12. 10.4161/auto.8.1.16618 - DOI - PMC - PubMed

Publication types

LinkOut - more resources