. 2015 Jun;21(6):591-600.
doi: 10.1038/nm.3856. Epub 2015 May 11.

Metabolic regulation of hepatitis B immunopathology by myeloid-derived suppressor cells

Affiliations

Metabolic regulation of hepatitis B immunopathology by myeloid-derived suppressor cells

Laura J Pallett et al. Nat Med. 2015 Jun.

Abstract

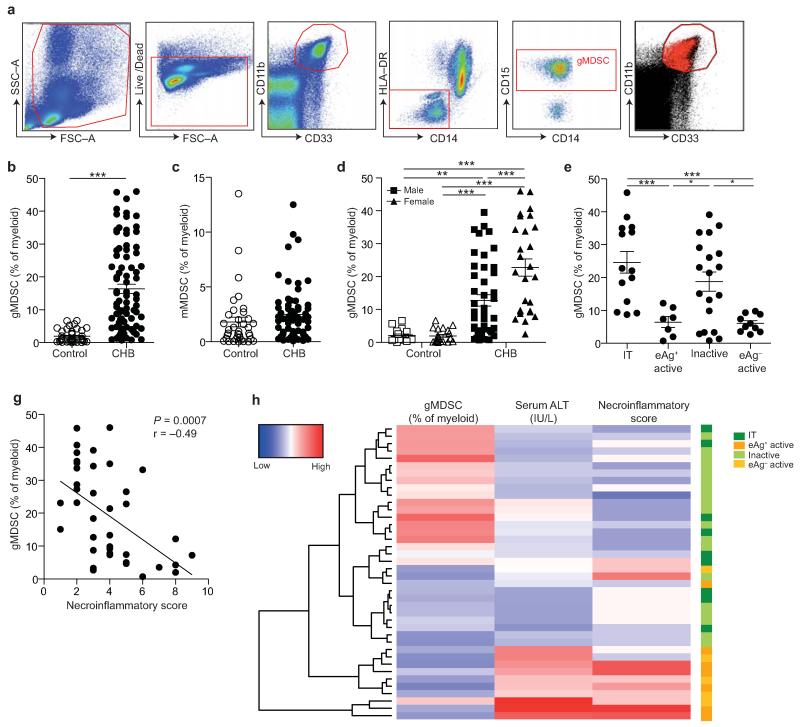
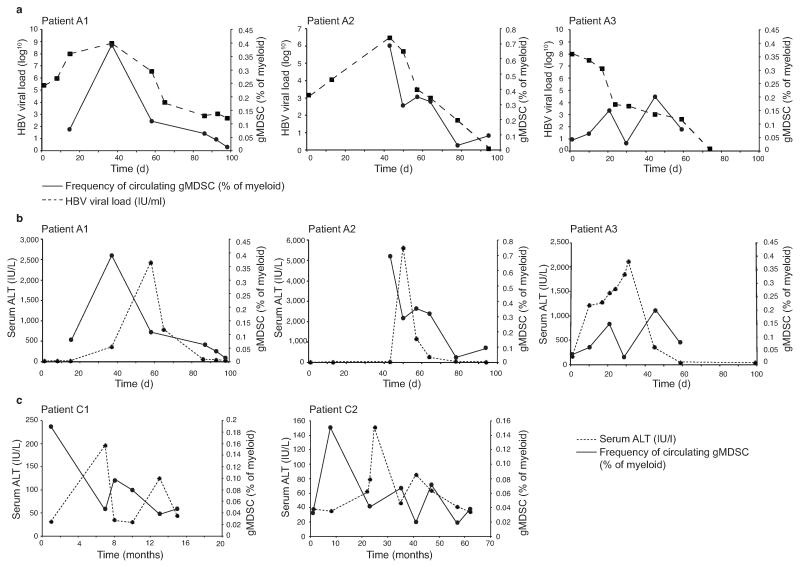
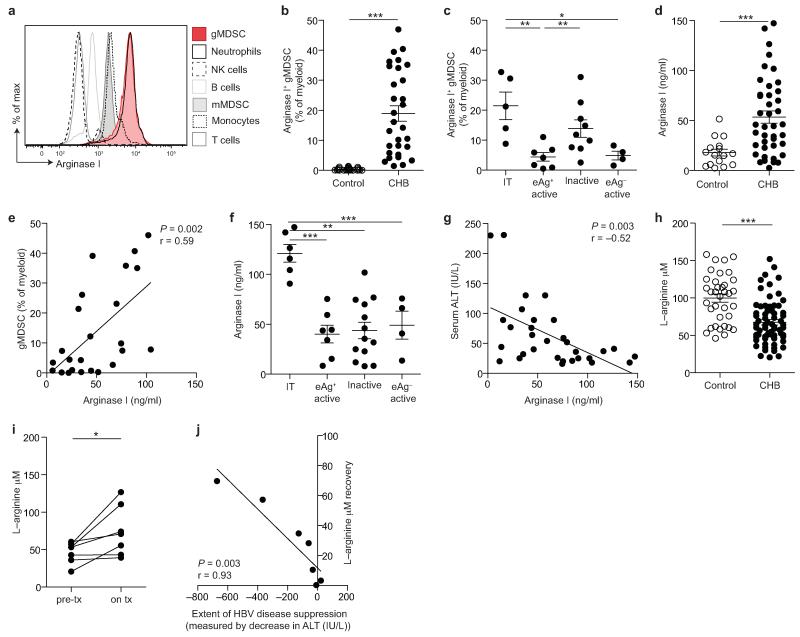
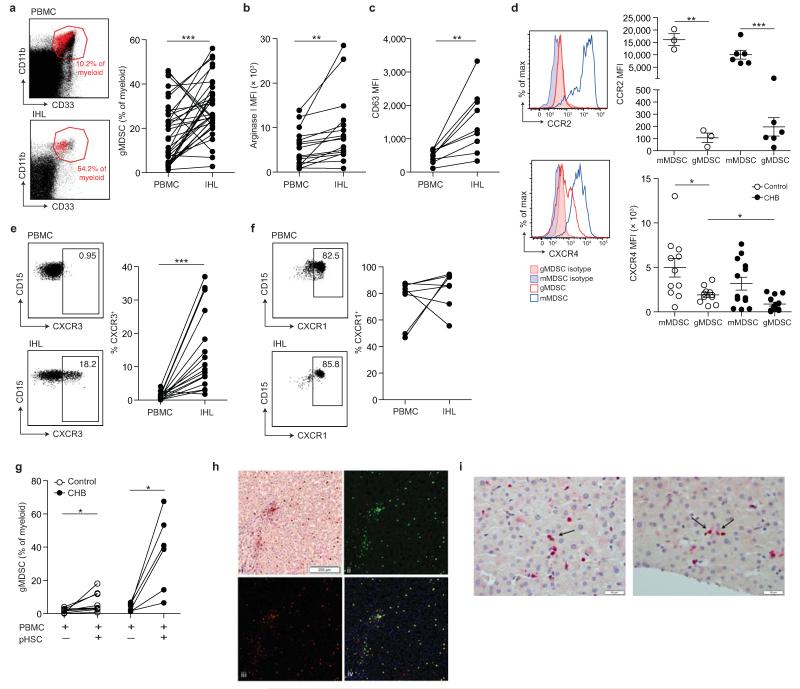
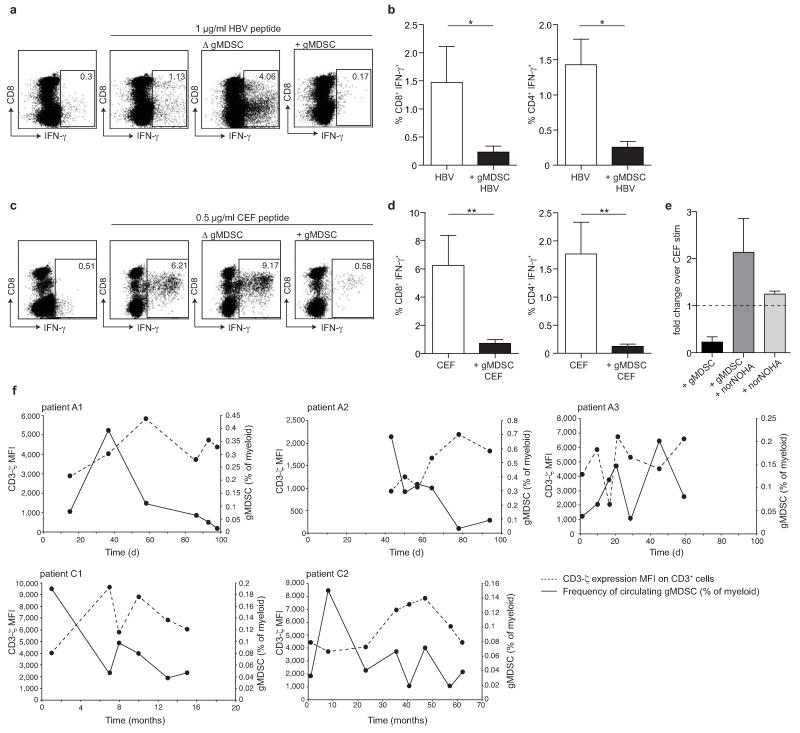
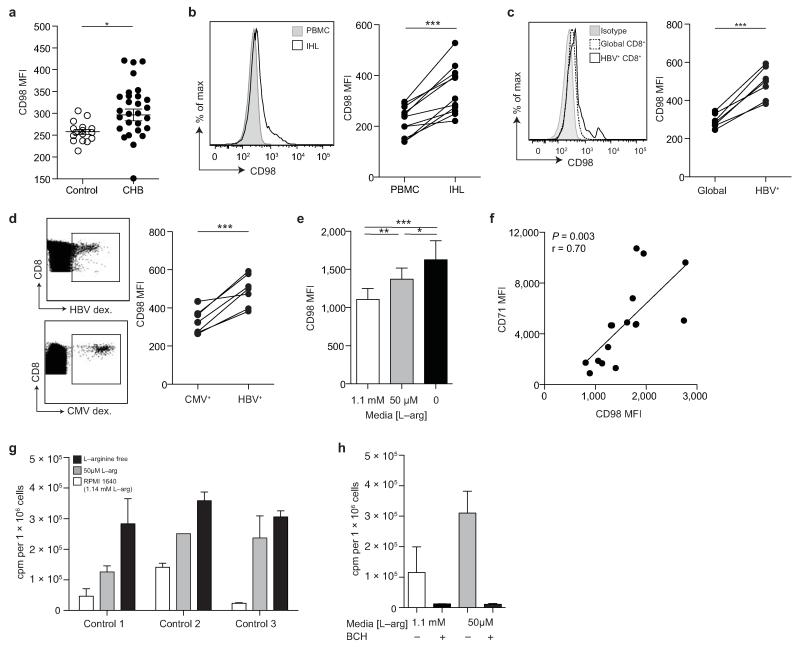
Infection with hepatitis B virus (HBV) results in disparate degrees of tissue injury: the virus can either replicate without pathological consequences or trigger immune-mediated necroinflammatory liver damage. We investigated the potential for myeloid-derived suppressor cells (MDSCs) to suppress T cell-mediated immunopathology in this setting. Granulocytic MDSCs (gMDSCs) expanded transiently in acute resolving HBV, decreasing in frequency prior to peak hepatic injury. In persistent infection, arginase-expressing gMDSCs (and circulating arginase) increased most in disease phases characterized by HBV replication without immunopathology, whilst L-arginine decreased. gMDSCs expressed liver-homing chemokine receptors and accumulated in the liver, their expansion supported by hepatic stellate cells. We provide in vitro and ex vivo evidence that gMDSCs potently inhibited T cells in a partially arginase-dependent manner. L-arginine-deprived T cells upregulated system L amino acid transporters to increase uptake of essential nutrients and attempt metabolic reprogramming. These data demonstrate the capacity of expanded arginase-expressing gMDSCs to regulate liver immunopathology in HBV infection.


Figures

Figure 1
Figure 1. gMDSC expand in subjects replicating HBV in the absence of immunopathology
a) Sequential gating strategy for gMDSC identification (CD11bhighCD33+HLA-DRCD14CD15+) using 11-color flow cytometry from freshly isolated PBMC (doublet discrimination not shown). gMDSC population (superimposed in red) was calculated as a percentage of myeloid cells (CD11bhighCD33+). Cumulative dot plots showing circulating b) gMDSC and c) mMDSC frequencies (n=44, healthy controls; n=84, CHB). d) gMDSC frequencies analyzed by gender. e) Summary plot of frequencies classified by disease phase using a subset of the cohort with clearly defined disease phases: 14 “immunotolerants” (HBeAg+, HBV DNA >107 IU/ml, ALT <40 IU/L), 9 “eAg+ active disease” (HBV DNA >5×10⁵ IU/ml, ALT >60 IU/L), 21 “inactive disease” (HBeAg, HBV DNA <2000 IU/ml, ALT <40 IU/L), 11 “eAg active disease” (HBeAg, HBV DNA >5×10⁵ IU/ml, ALT >60 IU/L). f) gMDSC frequencies according to hepatic necroinflammatory score (n=42, CHB). g) Unsupervised hierarchical clustering using Euclidean distance; dendrogram displaying similarity between clusters. Clinically assigned disease phase, shown adjacent to plot; immunotolerant: dark green, eAg+ active disease: dark yellow, inactive disease: pale green, eAg active disease: pale yellow (not used for analysis). Increasing color intensity (blue–red) corresponds to increasing gMDSC frequency, ALT (IU/L) or necroinflammatory score (n=42, CHB; maximum Knodell score in this cohort = 9/18). Error bars represent the mean ± SEM for the cohorts indicated; * p<0.05, ** p<0.01; *** p<0.001; b-c unpaired t test; d-e one way ANOVA (Tukey’s multiple comparisons test); f Pearson product-moment correlation coefficient.
Figure 2
Figure 2. gMDSC are transiently induced in acute HBV infection and decline before acute and chronic hepatic flares
gMDSC were quantitated as a percentage of total myeloid cells (CD11bhighCD33+) from PBMC cryopreserved from multiple time points from the onset of viraemia and subsequent hepatic flare. a) gMDSC frequencies in relation to viral load in three subjects with acute HBV infection sampled from the pre-clinical phase through to HBV disease resolution. b) gMDSC frequencies plotted with the temporal course of liver inflammation (serum ALT, IU/L) in the same three patients with acute HBV and c) in two subjects experiencing spontaneous flares of chronic HBeAg disease (days or months from initial presentation in clinic).
Figure 3
Figure 3. Arginase+ gMDSC and circulating arginase I increase in patients with HBV replication without immunopathology, whilst L-arginine levels decline
a) Analysis of PBMC subpopulations for expression (MFI) of intracellular arginase I. Cellular fractions identified as: CD3CD19+ B cells, CD14 CD16+CD15+ low density neutrophils, CD3+ T cells, CD3CD56+ NK cells, HLA-DR+CD14+ monocytes, CD11bhighCD33+HLA-DRlowCD14+CD15 mMDSC. b) Cumulative data for percentage of arginase-I-expressing gMDSC as a proportion of total myeloid cells (CD11bhighCD33+; n=25, healthy controls; n=31, CHB). c) Arginase+ gMDSC as a percentage of total myeloid cells categorised by disease phase (defined in the legend to Figure 1). d) Serum arginase I (ng/ml) concentration, determined by ELISA (n=16, healthy controls; n=41, CHB). e) Correlation of serum arginase I with circulating gMDSC frequencies (n=24, CHB). Further cumulative analysis of the CHB cohort by: f) disease phase, g) serum ALT (IU/L). h) Tandem high-performance liquid chromatography mass spectrometry analysis of the L-arginine concentration (μM) in sera (n=38, healthy controls; n=71, CHB). i) L-arginine concentration (μM) in sera from 7 CHB pre– and on antiviral therapy (for >1 year) and j) correlation between decline in liver inflammation on therapy (ALT, IU/L) and recovery of L-arginine levels. Error bars represent the mean ± SEM for the cohorts indicated; * p<0.05, ** p<0.01; *** p<0.001; b, d, h unpaired t test, i paired t test, e, g, j Pearson product-moment correlation coefficient; c, f one way ANOVA (Tukey’s multiple comparisons test).
Figure 4
Figure 4. Accumulation of arginase+ gMDSC in the liver
a) Representative FACS plots showing gMDSC (red) superimposed on the immature myeloid cell population from paired PBMC and intrahepatic leukocyte (IHL) samples, and the cumulative data depicting circulating compared to intrahepatic gMDSC frequencies (n=36, CHB). b) Cumulative data depicting expression (MFI) of arginase I in circulating and intrahepatic gMDSC (n=16, CHB). c) Surface CD63 expression (MFI) on peripheral and intrahepatic gMDSC (n=9, CHB). d) Representative and cumulative chemokine receptor expression on mMDSC and gMDSC of CCR2 and CXCR4. Representative and cumulative expression (%) on paired peripheral and intrahepatic gMDSC of e) CXCR3 (n=16, CHB) and f) CXCR1 (n=8, CHB). g) PBMC co-cultured with or without pHSC and analysed for gMDSC frequencies on day 6 (n=9, healthy controls, n=8, CHB). h) Representative double epitope immunostaining of liver sections from subjects with CHB for CD15 (brown, DAB) and CD66b (red, APAAP) at 100× magnification (top left); multispectral analysis (Nuance) with CD15 (green, top right) and CD66b (red, bottom left) as pseudo-fluorescent images. Co-localization of CD15 and CD66b, represented in yellow; composite image (bottom right). i) Two representative examples of double epitope immunohistochemistry with CD3 in red (APAAP) and CD66b in brown (DAB) at 400× magnification: arrows indicate CD3+ and CD66b+ cells in close association. Error bars represent the mean ± SEM for the cohorts indicated; * p<0.05; ** p<0.01; *** p<0.001; a-c, e-g paired t test; d unpaired t test.
Figure 5
Figure 5. gMDSC suppress functional T cells in an arginase-1 dependent manner
gMDSC were enriched or depleted using sequential magnetic bead isolation (CD14CD15+) from PBMC for direct co-culture with autologous PBMC. gMDSC–enriched (+ gMDSC), depleted (Δ gMDSC), or undepleted PBMC were cultured with 20 IU/ml recombinant IL-2 for 5 days and stimulated to test T cell responses by intracellular cytokine production following peptide stimulation. a) Representative FACS plots showing the IFN-γ T cell response with or without stimulation with 1 μg/ml overlapping peptides spanning the core region of HBV genotype D, after gMDSC depletion or enrichment at day 0. b) Cumulative data depicting HBV-specific CD8+ and CD4+ T cell responses (subtraction of background in the absence of stimulation) in PBMC ± gMDSC (n=7, CHB). c) Representative FACS plots and d) cumulative data for IFN-γ+ CD8+ and CD4+ T cell responses to 0.5 μg/ml CEF-specific peptide stimulation (minus background as before) in PBMC ± gMDSC (n=18, CHB). Error bars represent the mean ± SEM for the cohorts indicated; * p<0.05, ** p<0.01; b, d paired t test. e) Fold change CD8+ IFN-γ response to CEF peptide in PBMC or gMDSC enriched cultures in the presence or absence of arginase I specific inhibitor nor-NOHA (n=3, CHB). Dotted line indicates response of CD8+ T cells without gMDSC enrichment or nor-NOHA. f) MFI of CD3-ζ on CD3ε+ T cells (dashed line) in relation to circulating gMDSC frequencies as a percentage of myeloid cells (solid line) at multiple time points throughout acute HBV infection (n=3, upper panel) and spontaneous hepatic flares of HBeAg CHB (n=2, lower panel).
Figure 6
Figure 6. Differential CD98 expression on T cells in CHB
a) Cumulative data depicting expression (MFI) of CD98 on CD3+ T cells (n=15, healthy controls; n=27, CHB). b) Representative histogram showing CD98 MFI on peripheral CD3+ (PBMC) and intrahepatic CD3+ (IHL) from a subject with CHB, and the cumulative paired data (n=11, CHB). c) Representative histogram showing CD98 MFI on global and HBV-specific CD8+ T cells (identified by ex vivo staining with a panel of HLA-A2/HBV peptide dextramers) and the cumulative data (n=7, CHB). d) Representative example of identification of paired HBV– and CMV-specific CD8+ T cells using the relevant HLA-A2 dextramers and comparison of their CD98 MFI ex vivo (n=7, CHB). e) Cumulative data showing CD98 MFI on CD3+ T cells post TCR stimulation (anti-CD3, anti-CD28) for 3 days in cRPMI with a further 24 hr in the presence of 1.14 mM L-arginine (concentration in RPMI1640), 50 μM L-arginine, or in the absence of L-arginine (L-arginine free) (n=20, healthy controls). f) Co-expression of CD71 and CD98 on CD3+ T cells in the absence of L-arginine for 24 hr post TCR stimulation (n=15, healthy controls). g) Uptake of radiolabelled amino acid (phenylalanine) in T cells post TCR stimulation, before culture varying concentrations of L-arginine for 24 hr. h) Radiolabelled phenylalanine uptake in the presence or absence of the system-L inhibitor BCH (10 mM) ± L-arginine deprivation (n=3, healthy controls). Error bars represent the mean ± SEM for the cohorts indicated; * p<0.05; ** p<0.01; *** p<0.001; a, e unpaired t test, b-d paired t test, f Pearson product-moment correlation coefficient.

Comment in

References

    1. Guidotti LG, Chisari FV. Immunobiology and pathogenesis of viral hepatitis. Annu Rev Pathol. 2006;1:23–61. - PubMed
    1. Maini MK, et al. The role of virus-specific CD8(+) cells in liver damage and viral control during persistent hepatitis B virus infection. J Exp Med. 2000;191:1269–1280. - PMC - PubMed
    1. Bertoletti A, Maini MK. Protection or damage: a dual role for the virus-specific cytotoxic T lymphocyte response in hepatitis B and C infection? Curr Opin Immunol. 2000;12:403–408. - PubMed
    1. Kakimi K, et al. Blocking chemokine responsive to gamma-2/interferon (IFN)-gamma inducible protein and monokine induced by IFN-gamma activity in vivo reduces the pathogenetic but not the antiviral potential of hepatitis B virus-specific cytotoxic T lymphocytes. J Exp Med. 2001;194:1755–1766. - PMC - PubMed
    1. Sitia G, et al. MMPs are required for recruitment of antigen-nonspecific mononuclear cells into the liver by CTLs. J Clin Invest. 2004;113:1158–1167. - PMC - PubMed

Publication types

MeSH terms