. 2015 May 12:6:7147.
doi: 10.1038/ncomms8147.

Single-molecule super-resolution imaging of chromosomes and in situ haplotype visualization using Oligopaint FISH probes

Affiliations

Single-molecule super-resolution imaging of chromosomes and in situ haplotype visualization using Oligopaint FISH probes

Brian J Beliveau et al. Nat Commun. .

Abstract

Fluorescence in situ hybridization (FISH) is a powerful single-cell technique for studying nuclear structure and organization. Here we report two advances in FISH-based imaging. We first describe the in situ visualization of single-copy regions of the genome using two single-molecule super-resolution methodologies. We then introduce a robust and reliable system that harnesses single-nucleotide polymorphisms (SNPs) to visually distinguish the maternal and paternal homologous chromosomes in mammalian and insect systems. Both of these new technologies are enabled by renewable, bioinformatically designed, oligonucleotide-based Oligopaint probes, which we augment with a strategy that uses secondary oligonucleotides (oligos) to produce and enhance fluorescent signals. These advances should substantially expand the capability to query parent-of-origin-specific chromosome positioning and gene expression on a cell-by-cell basis.


Figures
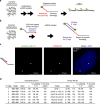
Figure 1
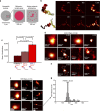
Figure 1. Secondary oligos are specific and efficient.
(a) One synthesis strategy for Oligopaints, in which complex ssDNA libraries consisting of a stretch of genomic sequence (black lines) on the order of tens of bases flanked by non-genomic regions (coloured lines) containing primer sequences are amplified, labelled and then processed in any of a variety of ways to produce ssDNA probes that carry non-genomic sequences at one (shown) or both (not shown) ends (adapted from ref. ; also see Supplementary Figs 2 and 3 for more details on MainStreet incorporation and placement strategies). The primer sequence can constitute the entirety, or just a portion, of the non-genomic region, called MainStreet, which will remain single-stranded when Oligopaint probes are hybridized to their target. (b) A binding site for a secondary (2°) oligo probe can be introduced to MainStreet by PCR amplification with a primer that carries the binding site. Here, the secondary oligo carries a single, 5′ fluorophore that matches the fluorophore present on the Oligopaint (primary) probe, but in practice the number, identity and placement of fluorophores on the secondary oligo can vary. Also see Supplementary Figs 2 and 3. (c) Grayscale and multicolour images from a two-colour co-localization experiment in diploid human WI-38 cells. DNA is stained with 4′,6-diamidino-2-phenylindole (DAPI; blue). Images are maximum Z projections from a laser scanning confocal microscope. (d) Two-colour co-localization experiments in diploid Drosophila clone 8 cells and WI-38 cells. The genomic target, span of the target, number of nuclei examined (n), per cent of nuclei (% Labelling) that had at least one signal from the primary (1°, Oligopaint) probe and at least one signal from the secondary oligo and per cent primary signals that have an overlapping secondary signal (% Co-localization) are given for each experiment.
Figure 2
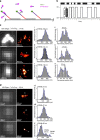
Figure 2. Super-resolution imaging with Oligopaints and STORM.
(a) Schematic illustrating how a diffraction-limited FISH signal presents as many smaller fluorescence localizations via STORM. (b) Simulated STORM images of two polymer models (left) illustrating the importance of localization density in resolving structure (total localizations in upper right corners). The colour code on the polymer models traces along the length of the polymer (black to red to white). (c) Average number of localizations (mean±s.e.m.; n=434 for unlabeled/Cy5, n=133 for Cy5/Cy5, n=353 A405/Cy5) per BX-C locus in Drosophila clone 8 cells when the unlabelled primary probe is paired with a secondary oligo carrying Cy5 (left), when both the primary probe and secondary oligo carry Cy5 (middle), and when the primary probe carrying an AlexaFluor 405 activator is paired with a secondary oligo carrying Cy5. (d) Conventional (left) and STORM (right) images of the BX-C locus from three cells, with cell shown in bottom row exhibiting two loop-like protrusions. The conventional and STORM images depict the same field of view at the same magnification. Right two panels: zoomed-in views of the boxed regions. (e) Simulation in which two-thirds of the localizations shown in image (d) have been removed at random to illustrate the loss of connectivity and structure in regions represented by a low density of localizations. (f) Conventional (left) and STORM (middle and right) images of a 5-kb region at 89B from three cells. Right panel: zoomed-in views of the centre panels. (g) A graph of the normalized number of photons detected (Normalized counts) per position (nm) in the x axis (dashed line) of the field shown in the bottom-right panel of f. The FWHM of the brightest feature is presented above the graph. Super-resolution images are presented as heat maps of single-mole localization density: black (fewest) -> red -> yellow -> white (most).
Figure 3
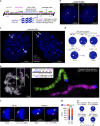
Figure 3. Super-resolution imaging with Oligopaints and DNA-PAINT.
(a) Labelling scheme using Oligopaint probes carrying an ATTO 488 dye and a 9-base docking site that is complementary to imager strands labelled with ATTO 655. (b) Trace of Intensity versus time showing the transient binding of imager strands and docking strands or ‘blinks'. (c,d) Diffraction-limited images obtained with ATTO 488 (left) and DNA-PAINT super-resolution images obtained with ATTO 655-labelled imager strands at 5 nM (right) of Oligopaint probe sets labelled with ATTO 488 and targeting 174 kb (c) and 5 kb (d) of the mouse hoxB locus in MEFs. To the right of the images are cross-sectional (dotted lines in DNA-PAINT images i–ix) histograms displaying the normalized number of photons detected (normalized counts) versus transverse position for each region. Structural features are inferred from these transverses with one-dimensional Gaussian fits, with FWHMs indicated above each graph. Imaging: 15,000 frames at 10 Hz rate. Super-resolution images are presented as heat maps of single-mole localization density: black (fewest) -> red -> yellow -> white (most).
Figure 4
Figure 4. HOPs.
(a) Schematic of HOPs targeting the mouse XIC (not to scale). 129 (green) and CAST (magenta) HOPs are targeted to SNPs and carry variants specific for the 129S1/SvImJ (129) or CAST/EiJ (CAST) genomes, respectively, while interstitial (white) probes target sequences common to both genomes. None of these three probe sets target the Xist transcript, which is targeted by a fourth Oligopaint probe set (blue) (b) Hybrid EY.T4 129xCAST-transformed MEF cells visualized with 129 (green) and Cast (magenta) HOPs and the interstitial probe set (white). The interstitial probe set binds 129 and CAST chromosomes equally well (left), while the 129 and CAST HOPs reveal the parent-of-origin of the interstitial signals (right). (c) RNA/DNA FISH with 129 (green) and CAST (magenta) HOPs and Xist RNA FISH (white) demonstrating co-localization of Xist signal with that of the 129 HOP. Arrows point to Xist signals. (d) Percentage of nuclei falling into each of five Xist staining patterns. (e) Polytene chromosomes of a Drosophila salivary gland nucleus (left) and enlarged image of boxed region (right) from DGRP 057 × DGRP 461 hybrid larvae visualized with Oligopaints targeting the BX-C (blue) and 057-specific (green) and 461-specific (magenta) HOPs targeting the flanking 89E–93C region. DNA is stained with 4′,6-diamidino-2-phenylindole (DAPI; grey), which is removed from right image. Images are single Z slices from a laser scanning confocal microscope. (f) Drosophila 6–8 h embryo nuclei visualized with the BX-C probe set (white) and the 057 (green) and 461 (magenta) HOPs showing the paired (left) and unpaired (right) at both BX-C and the adjacent 89E–93C region. (g) % Pairing observed at BX-C and 89E–93C, where loci were considered paired if edge-to-edge distance between their signals was ≤0.8 μm. (NS, not significant, two-tailed Fisher's exact P=0.88, n=101). (h) The paired status of BX-C is statistically associated with that of 89E–93C (two-tailed Fisher's exact P=6.4 × 10⁻¹⁷, n=101). For b, c, and f: DNA is stained with DAPI (blue). Images are maximum Z projections from a laser scanning confocal microscope.

References

    1. Pardue M. L. & Gall J. G. Formation and detection of RNA-DNA hybrid molecules in cytological preparations. Proc. Natl Acad. Sci. USA 63, 378–383 (1969). - PMC - PubMed
    1. van der Ploeg M. Cytochemical nucleic acid research during the twentieth century. Eur. J. Histochem. 44, 7–42 (2000). - PubMed
    1. Levsky J. M. & Singer R. H. Fluorescence in situ hybridization: past, present and future. J. Cell Sci. 116, 2833–2888 (2003). - PubMed
    1. Bolzer A. et al. Three-dimensional maps of all chromosomes in human male fibroblast nuclei and prometaphase rosettes. PLoS Biol. 3, e157 (2005). - PMC - PubMed
    1. Yamada N. A. et al. Visualization of fine-scale genomic structure by oligonucleotide-based high-resolution FISH. Cytogenet. Genome Res. 132, 248–254 (2011). - PubMed

Publication types

Substances

LinkOut - more resources