

Negative regulatory roles of DE-ETIOLATED1 in flowering time in Arabidopsis
- PMID: 25962685
- PMCID: PMC4428065
- DOI: 10.1038/srep09728
Negative regulatory roles of DE-ETIOLATED1 in flowering time in Arabidopsis
Abstract
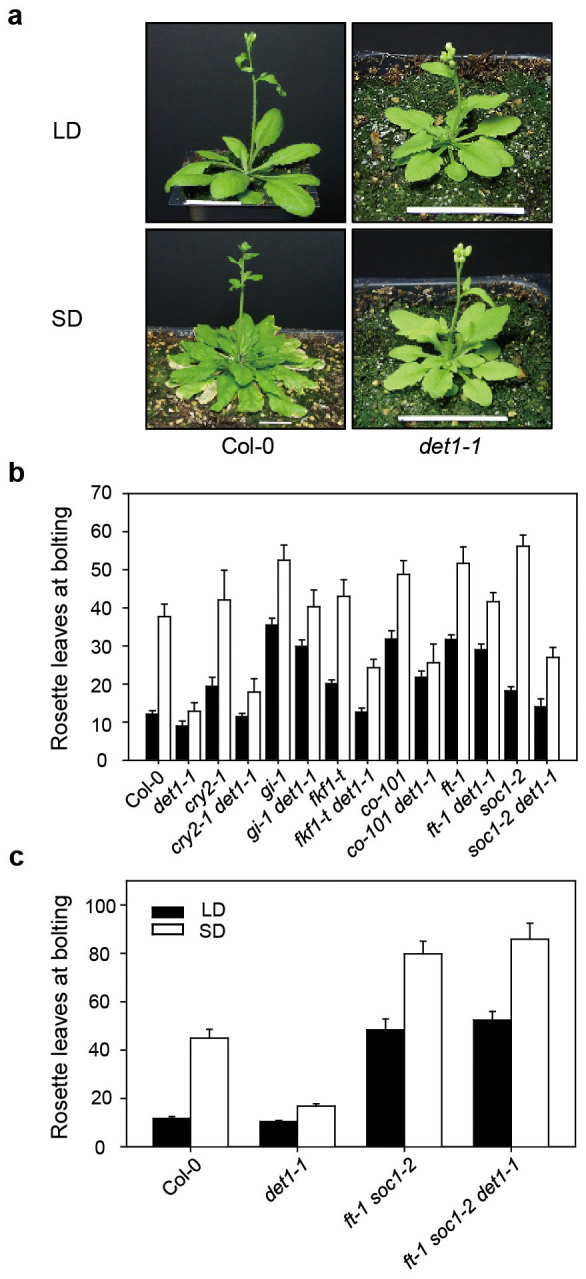
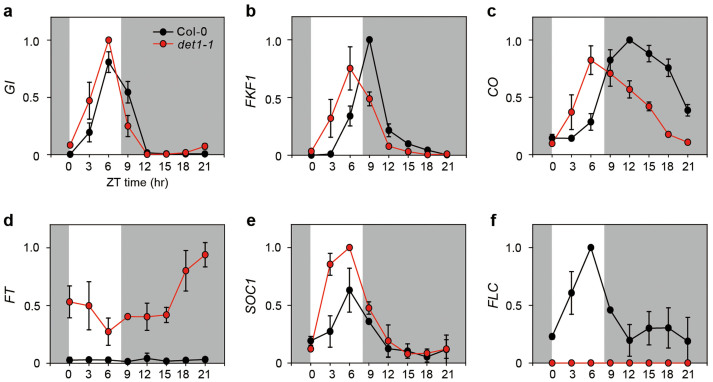
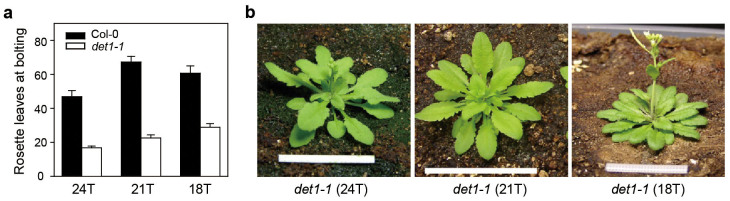
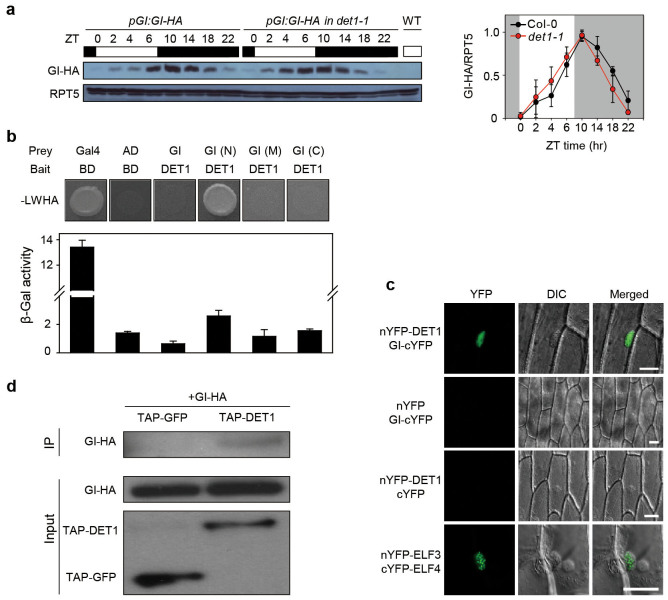
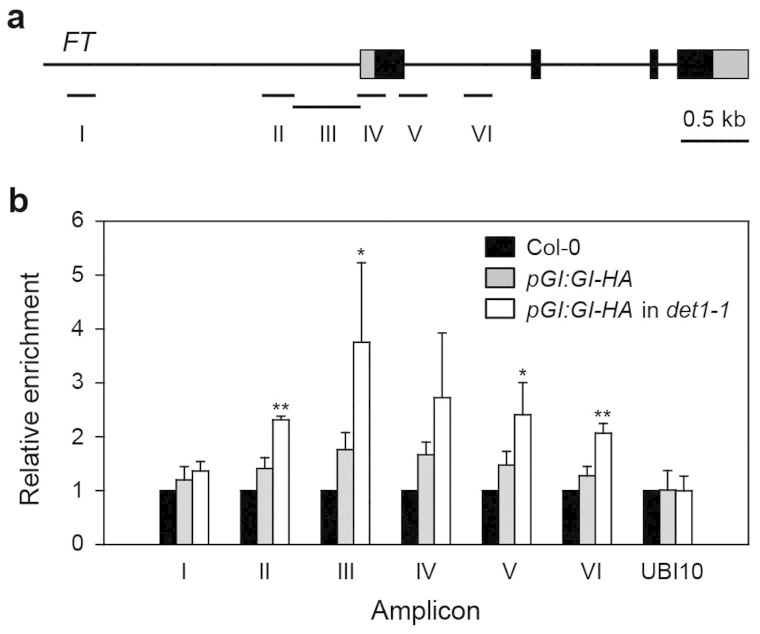
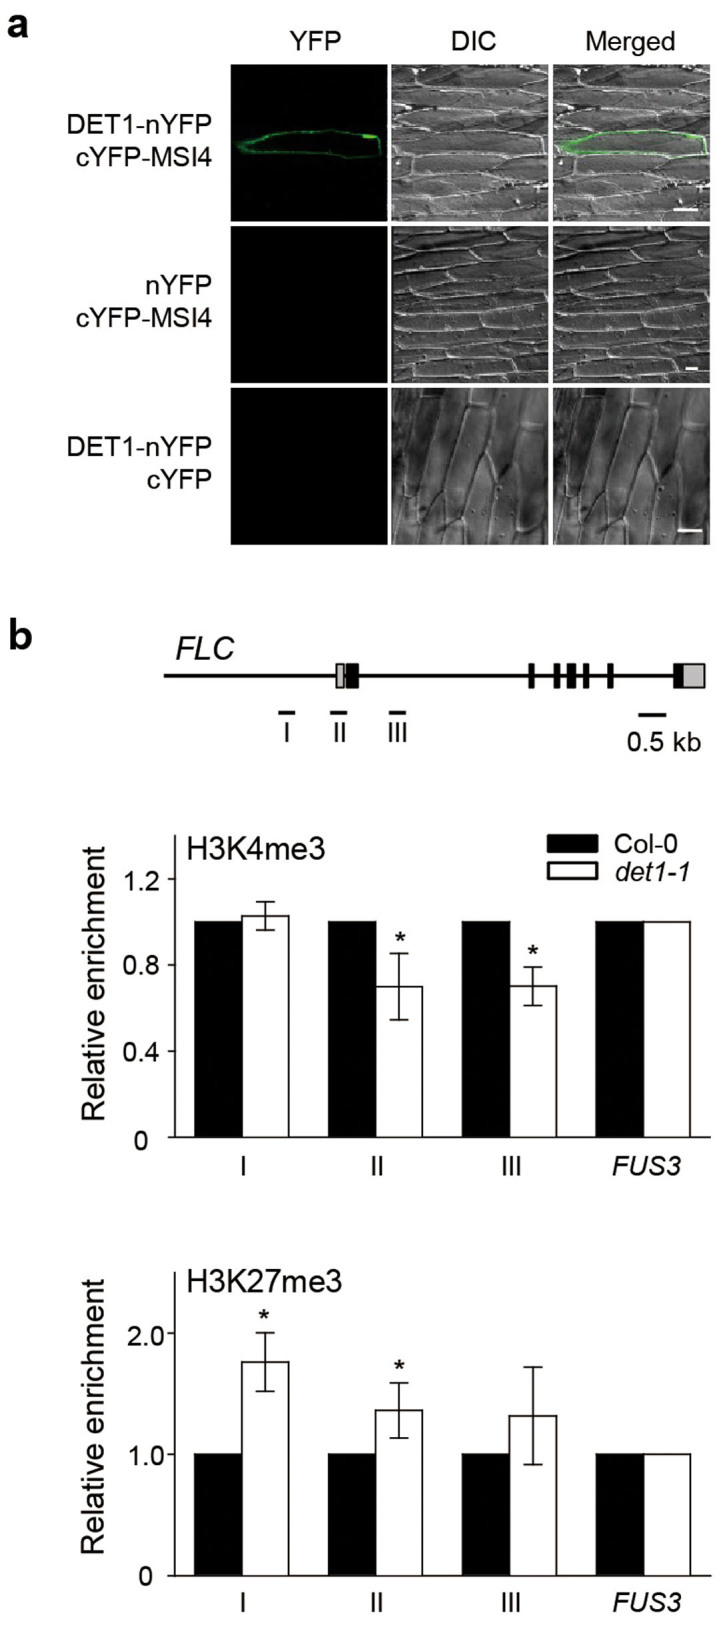
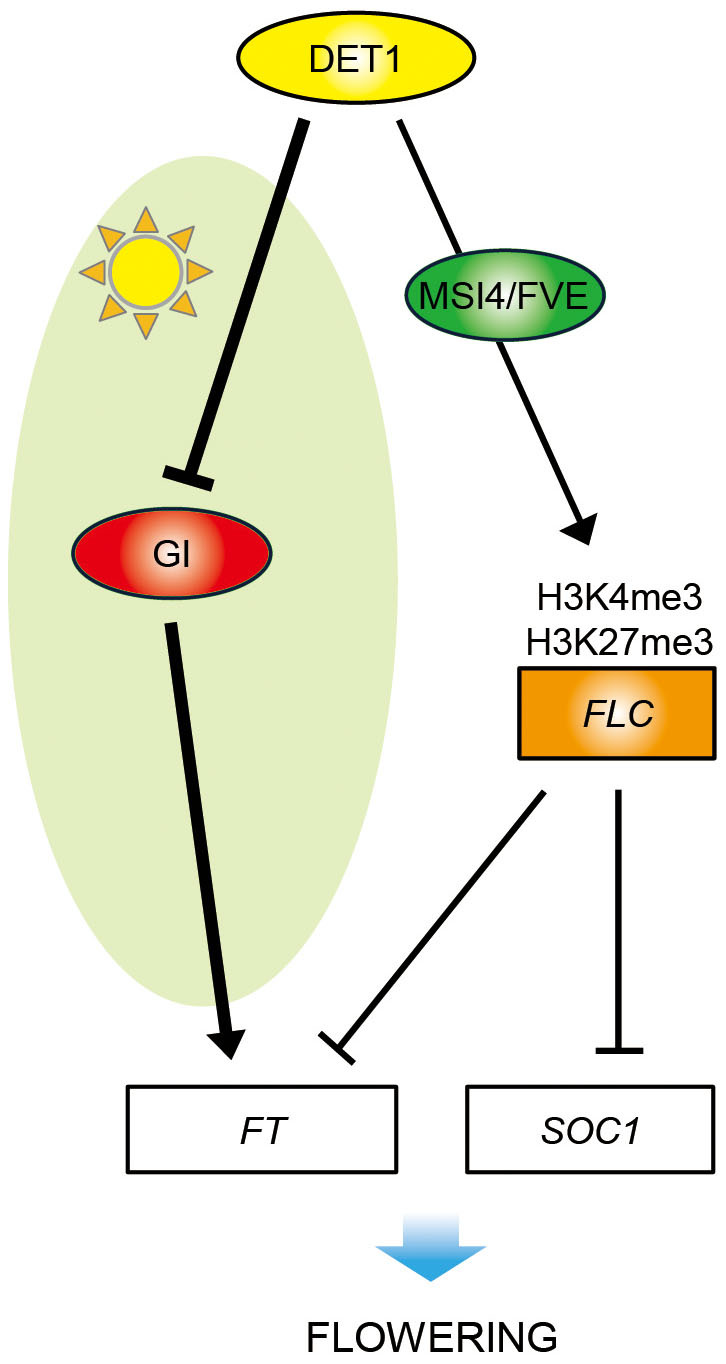
Arabidopsis flowers early under long days (LD) and late under short days (SD). The repressor of photomorphogenesis DE-ETIOLATED1 (DET1) delays flowering; det1-1 mutants flower early, especially under SD, but the molecular mechanism of DET1 regulation remains unknown. Here we examine the regulatory function of DET1 in repression of flowering. Under SD, the det1-1 mutation causes daytime expression of FKF1 and CO; however, their altered expression has only a small effect on early flowering in det1-1 mutants. Notably, DET1 interacts with GI and binding of GI to the FT promoter increases in det1-1 mutants, suggesting that DET1 mainly restricts GI function, directly promoting FT expression independent of CO expression. Moreover, DET1 interacts with MSI4/FVE, which epigenetically inhibits FLC expression, indicating that the lack of FLC expression in det1-1 mutants likely involves altered histone modifications at the FLC locus. These data demonstrate that DET1 acts in both photoperiod and autonomous pathways to inhibit expression of FT and SOC1. Consistent with this, the early flowering of det1-1 mutants disappears completely in the ft-1 soc1-2 double mutant background. Thus, we propose that DET1 is a strong repressor of flowering and has a pivotal role in maintaining photoperiod sensitivity in the regulation of flowering time.
Figures
Similar articles
-
CONSTITUTIVE PHOTOMORPHOGENIC 10 (COP10) Contributes to Floral Repression under Non-Inductive Short Days in Arabidopsis.Int J Mol Sci. 2015 Nov 5;16(11):26493-505. doi: 10.3390/ijms161125969. Int J Mol Sci. 2015. PMID: 26556345 Free PMC article.
-
Analysis of flowering pathway integrators in Arabidopsis.Plant Cell Physiol. 2005 Feb;46(2):292-9. doi: 10.1093/pcp/pci024. Epub 2005 Feb 2. Plant Cell Physiol. 2005. PMID: 15695467
-
AGAMOUS-LIKE 6 is a floral promoter that negatively regulates the FLC/MAF clade genes and positively regulates FT in Arabidopsis.Plant J. 2011 Jan;65(1):62-76. doi: 10.1111/j.1365-313X.2010.04402.x. Epub 2010 Nov 10. Plant J. 2011. PMID: 21175890
-
The autonomous pathway: epigenetic and post-transcriptional gene regulation in the control of Arabidopsis flowering time.Curr Opin Plant Biol. 2004 Oct;7(5):570-4. doi: 10.1016/j.pbi.2004.07.002. Curr Opin Plant Biol. 2004. PMID: 15337100 Review.
-
Understanding the genetic and epigenetic architecture in complex network of rice flowering pathways.Protein Cell. 2014 Dec;5(12):889-98. doi: 10.1007/s13238-014-0068-6. Epub 2014 Aug 8. Protein Cell. 2014. PMID: 25103896 Free PMC article. Review.
Cited by
-
The De-Etiolated 1 Homolog of Arabidopsis Modulates the ABA Signaling Pathway and ABA Biosynthesis in Rice.Plant Physiol. 2016 Jun;171(2):1259-76. doi: 10.1104/pp.16.00059. Epub 2016 May 2. Plant Physiol. 2016. PMID: 27208292 Free PMC article.
-
A Novel Loop: Mutual Regulation Between Epigenetic Modification and the Circadian Clock.Front Plant Sci. 2019 Jan 29;10:22. doi: 10.3389/fpls.2019.00022. eCollection 2019. Front Plant Sci. 2019. PMID: 30761168 Free PMC article. Review.
-
Mutations in OsDET1, OsCOP10, and OsDDB1 confer embryonic lethality and alter flavonoid accumulation in Rice (Oryza sativa L.) seed.Front Plant Sci. 2022 Jul 25;13:952856. doi: 10.3389/fpls.2022.952856. eCollection 2022. Front Plant Sci. 2022. PMID: 35958215 Free PMC article.
-
Identification of genetic and environmental factors influencing aerial root traits that support biological nitrogen fixation in sorghum.G3 (Bethesda). 2024 Mar 6;14(3):jkad285. doi: 10.1093/g3journal/jkad285. G3 (Bethesda). 2024. PMID: 38096484 Free PMC article.
-
Light and Abscisic Acid Coordinately Regulate Greening of Seedlings.Plant Physiol. 2020 Jul;183(3):1281-1294. doi: 10.1104/pp.20.00503. Epub 2020 May 15. Plant Physiol. 2020. PMID: 32414897 Free PMC article.
References
-
- de Montaigu A., Toth R. & Coupland G. Plant development goes like clockwork. Trends Genet. 26, 296–306 (2010). - PubMed
-
- Kardailsky I. et al. Activation tagging of the floral inducer FT. Science 286, 1962–1965 (1999). - PubMed
-
- Park D. H. et al. Control of circadian rhythms and photoperiodic flowering by the Arabidopsis GIGANTEA gene. Science 285, 1579–1582 (1999). - PubMed
-
- Suárez-López P. et al. CONSTANS mediates between the circadian clock and the control of flowering in Arabidopsis. Nature 410, 1116–1120 (2001). - PubMed
-
- Corbesier L. et al. FT protein movement contributes to long-distance signaling in floral induction of Arabidopsis. Science 316, 1030–1033 (2007). - PubMed
Publication types
MeSH terms
Substances
LinkOut - more resources
Full Text Sources
Other Literature Sources
Molecular Biology Databases
Research Materials
