. 2015 May 12:6:7037.
doi: 10.1038/ncomms8037.

External stimulation-controllable heat-storage ceramics

Affiliations

External stimulation-controllable heat-storage ceramics

Hiroko Tokoro et al. Nat Commun. .

Abstract

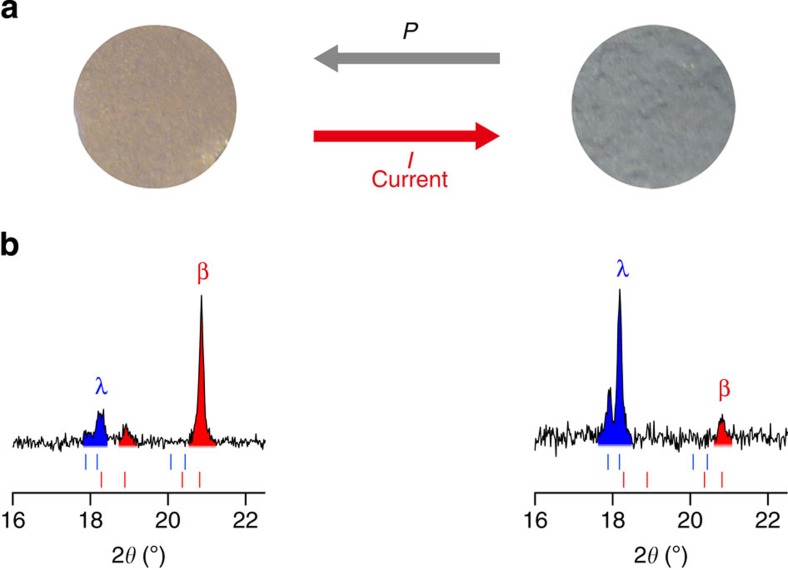
Commonly available heat-storage materials cannot usually store the energy for a prolonged period. If a solid material could conserve the accumulated thermal energy, then its heat-storage application potential is considerably widened. Here we report a phase transition material that can conserve the latent heat energy in a wide temperature range, T<530 K and release the heat energy on the application of pressure. This material is stripe-type lambda-trititanium pentoxide, λ-Ti3O5, which exhibits a solid-solid phase transition to beta-trititanium pentoxide, β-Ti3O5. The pressure for conversion is extremely small, only 600 bar (60 MPa) at ambient temperature, and the accumulated heat energy is surprisingly large (230 kJ L(-1)). Conversely, the pressure-produced beta-trititanium pentoxide transforms to lambda-trititanium pentoxide by heat, light or electric current. That is, the present system exhibits pressure-and-heat, pressure-and-light and pressure-and-current reversible phase transitions. The material may be useful for heat storage, as well as in sensor and switching memory device applications.


Figures

Figure 1
Figure 1. Morphology of stripe-type-λ-Ti3O5 and pressure-and-heat-induced phase transition between λ-Ti3O5 and β-Ti3O5.
(a) TEM image of stripe-type-λ-Ti3O5. The scale bar below the TEM image indicates 50 nm. (b) HRTEM image of the surface of stripe-type-λ-Ti3O5 showing the atomic arrangement on the bc plane. The scale bar below the TEM image indicates 1 nm. (c) Visualized electron density maps on the bc plane of stripe-type-λ-Ti3O5 obtained by the MEM (isosurface 0.8e Å−3). The scale bar below the electron density map (left) indicates 1 nm. (d) Pressure (P) and temperature (T) dependence of the XRPD patterns (λ=1.5418 Å). The ambient-temperature XRPD pattern of the as-prepared sample at atmospheric pressure (P=0.1 MPa) is shown in the front, followed by XRPD patterns of the pellet samples pressurized by P=15−530 MPa, measured after pressure release. These are followed by the XRPD patterns of pressure-produced β-Ti3O5 with increasing temperature from 300 K to 510 K. (e) Pressure evolution of the phase fractions of λ-Ti3O5 (blue) and β-Ti3O5 (red). The pressure where the fraction of λ-Ti3O5 becomes 50% (P1/2) is an extremely small value of ∼60 MPa. (f) Temperature evolution of the phase fractions of λ-Ti3O5 (blue) and β-Ti3O5 (red) in the heating process.
Figure 2
Figure 2. Electron density maps and the phonon modes of λ-Ti3O5 and β-Ti3O5.
(a) Visualized electron density maps (isosurface 0.45e Å−3) of λ-Ti3O5 (upper) and β-Ti3O5 (lower) obtained using MEM from the XRPD patterns. (b) Phonon density of state (DOS) for λ-Ti3O5 (upper) and β-Ti3O5 (lower). Blue, light blue and grey areas indicate the contributions from phonons due to Ti, O, and the total phonon DOS, respectively for λ-Ti3O5 (upper). Red, orange and grey areas indicate the contributions from phonons due to Ti, O and the total phonon DOS, respectively, for β-Ti3O5 (lower). (c) Schematic illustration of the Bu phonon mode at 445.8 cm−1 for λ-Ti3O5 (upper) and the Bu phonon mode at 226.7 cm−1 for β-Ti3O5 (lower). Arrows and their lengths indicate the direction of the movement of the atoms and the relative amplitude of oscillation, respectively (see Supplementary Movies 1 and 2).
Figure 3
Figure 3. Thermodynamic properties of stripe-type-λ-Ti3O5 and pressure-produced β-Ti3O5.
(a) Molar heat capacity of λ-Ti3O5 (blue) and β-Ti3O5 (red) as a function of temperature. Experimental data were fitted with a Debye model (see Methods). (b) DSC charts of the pressure-produced β-Ti3O5 with increasing temperature and λ-Ti3O5 with decreasing temperature. A peak due to the latent heat of the first-order phase transition from β-Ti3O5 to λ-Ti3O5 (230 kJ L−1) was observed in the heating process, whereas no peak was observed in the cooling process. (c) Temperature dependence of the enthalpy (H) for λ-Ti3O5 (blue) and β-Ti3O5 (red). When pressure is applied to λ-Ti3O5, the accumulated heat energy is released as shown in the lower enlarged figure (see Supplementary Movie 3). (d) Pressure-released heat energy accompanying the pressure-induced phase transition from stripe-type-λ-Ti3O5 to β-Ti3O5. Pressure was applied at t=0.
Figure 4
Figure 4. Current-induced phase transition from β-Ti3O5 to λ-Ti3O5.
An electric current of 0.4 A mm−2 flowed through the pressure-produced β-Ti3O5 at 298 K. (a) Photographs of the pressure-produced β-Ti3O5 before (left) and after the application of an electric current of 0.4 A mm−2 (right). (b) XRPD pattern in the 2θ range of 16.0–22.5° of the pressure-produced β-Ti3O5 (left) and after the application of the electric current (right). Blue and red areas mark the peaks of λ-Ti3O5 and β-Ti3O5, respectively.
Figure 5
Figure 5. Mechanism of the pressure-induced phase transition based on a thermodynamic model.
(a) Gibbs free energy (G) versus λ-Ti3O5 fraction (x) for every 10 K between 250 K to 500 K calculated using the Slichter–Drickamer mean-field model at P=0.1 MPa (i) and 60 MPa (ii). Blue and red circles indicate λ-Ti3O5 and β-Ti3O5, respectively. λ-Ti3O5 undergoes a pressure-induced phase transition to β-Ti3O5 because the energy barrier (shown by brown shadows) disappears by the application of external pressure above ∼60 MPa as shown in the insets (see Supplementary Movie 6). (b) Calculated x versus temperature curves at P=0.1 MPa (blue) and 60 MPa (red). (c) Calculated x versus pressure curve at 300 K indicating a threshold pressure of ∼60 MPa.

References

    1. Nayak A. P. et al.. Pressure-induced semiconducting to metallic transition in multilayered molybdenum disulphide. Nat. Commun. 5, 3731 (2014). - PubMed
    1. Takabayashi Y. et al.. The disorder-free non-BCS superconductor Cs3C60 emerges from an antiferromagnetic insulator parent state. Science 323, 1585–1590 (2009). - PubMed
    1. Avdeev M. et al.. Pressure-induced ferroelectric to antiferroelectric phase transition in Pb0.99(Zr0.95Ti0.05)0.98Nb0.02O3. Phys. Rev. B 73, 064105/1–14 (2006).
    1. Kolobov A. V. et al.. Understanding the phase-change mechanism of rewritable optical media. Nat. Mater. 3, 703–708 (2004). - PubMed
    1. Wuttig M. & Yamada N. Phase-change materials for rewriteable data storage. Nat. Mater. 6, 824–832 (2007). - PubMed

Publication types