. 2015 May 12:6:7078.
doi: 10.1038/ncomms8078.

Hepatic insulin signalling is dispensable for suppression of glucose output by insulin in vivo

Affiliations

Hepatic insulin signalling is dispensable for suppression of glucose output by insulin in vivo

Paul M Titchenell et al. Nat Commun. .

Abstract

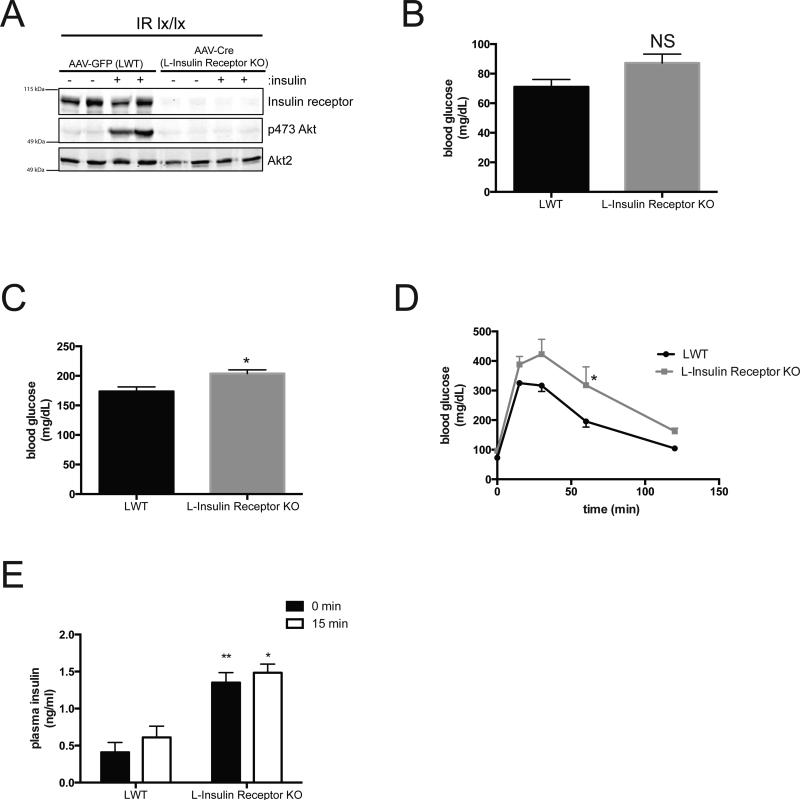
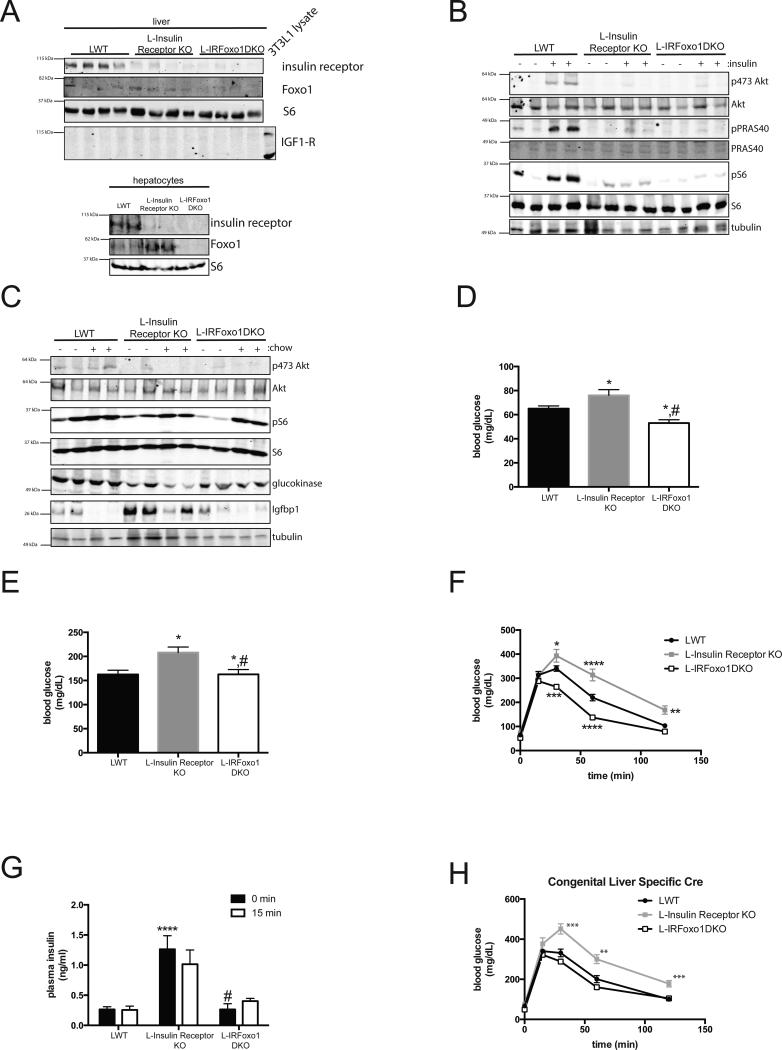
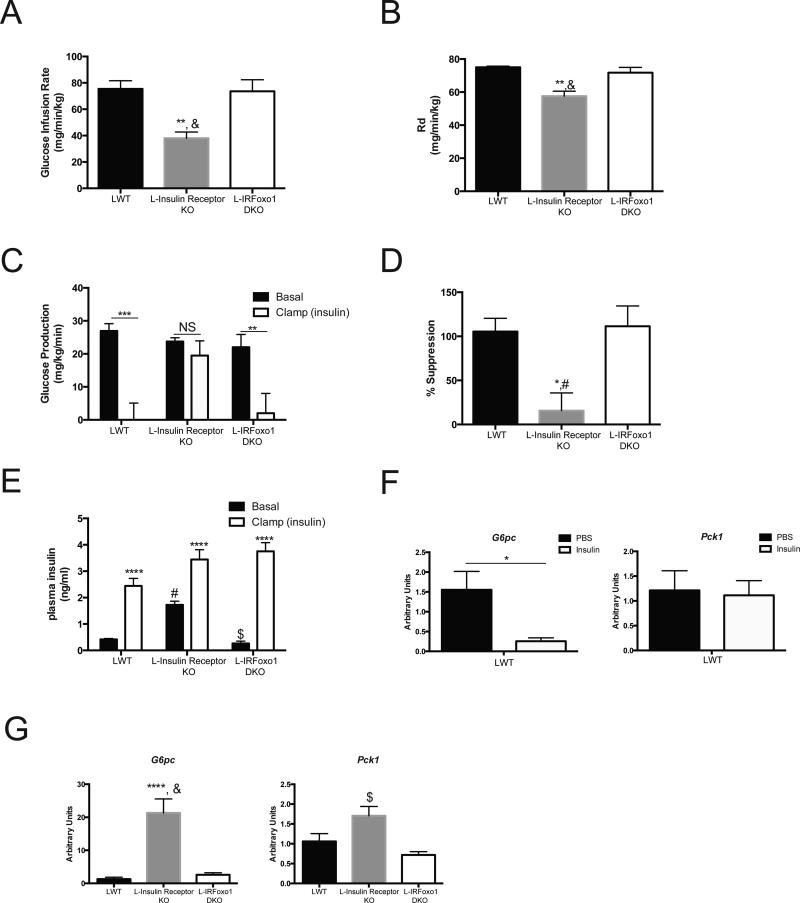
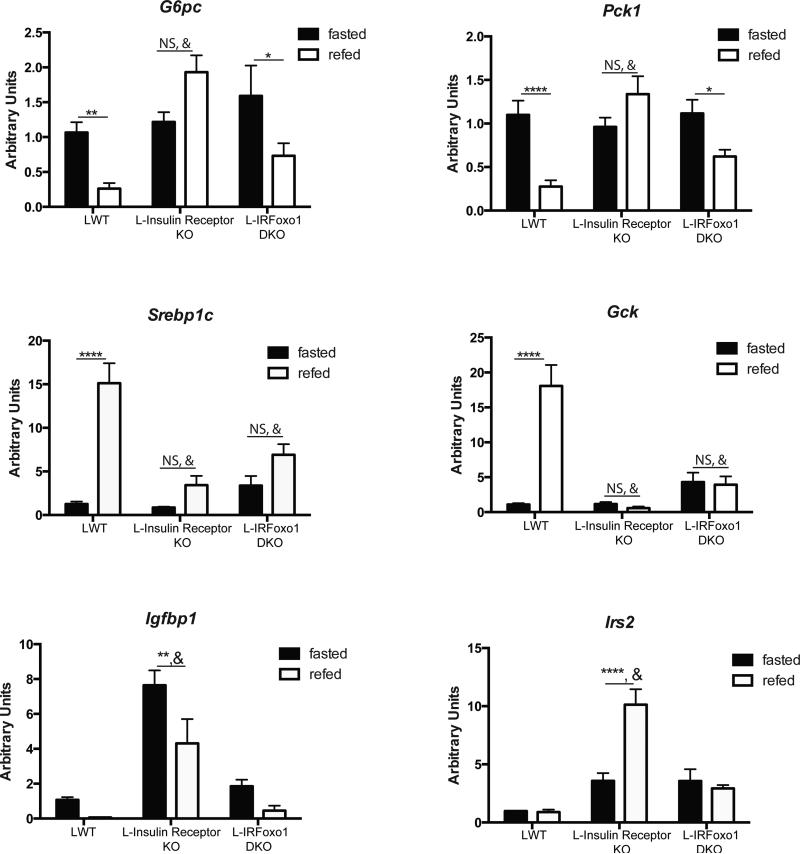
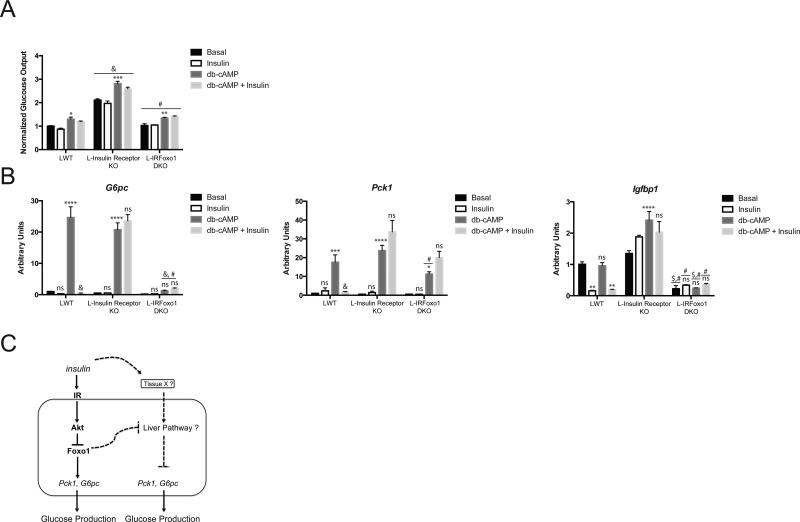
Insulin signalling and nutrient levels coordinate the metabolic response to feeding in the liver. Insulin signals in hepatocytes to activate Akt, which inhibits Foxo1 suppressing hepatic glucose production (HGP) and allowing the transition to the postprandial state. Here we provide genetic evidence that insulin regulates HGP by both direct and indirect hepatic mechanisms. Liver-specific ablation of the IR (L-Insulin Receptor KO) induces glucose intolerance, insulin resistance and prevents the appropriate transcriptional response to feeding. Liver-specific deletion of Foxo1 (L-IRFoxo1DKO) rescues glucose tolerance and allows for normal suppression of HGP and gluconeogenic gene expression in response to insulin, despite lack of autonomous liver insulin signalling. These data indicate that in the absence of Foxo1, insulin signals via an intermediary extrahepatic tissue to regulate liver glucose production. Importantly, a hepatic mechanism distinct from the IR-Akt-Foxo1 axis exists to regulate glucose production.


Figures

Figure 1
Figure 1. Acute deletion of liver insulin receptor leads to glucose intolerance and enhanced Foxo1 activity
(A) Western blot of primary hepatocytes from mice treated with 10 nM insulin for 15 minutes and probed for specific proteins as indicated. AAVGFP=LWT mice, AAV-Cre=L-Insulin Receptor KO mice. (B,C) Blood glucose concentrations in mice after overnight fast (B) and overnight fasted following by 4 h refeeding of normal chow (C). NS:not significant * P<0.05. n=5 mice. (E) Intraperitoneal glucose tolerance test (2 g per kg) on overnight fasted mice. n=5 mice per group. * p<0.05 vs LWT (F) Insulin levels before and after 15 minutes following glucose injection IP. n=5 mice per group. *** p<0.001, ** p<0.01 vs LWT. All data are presented as mean ± s.e.m. Statistical analysis was performed using Students's t followed by two-tailed analysis. A P <0.05 was considered statistically significant.
Figure 2
Figure 2. Liver Foxo1 deletion normalizes glucose levels and hyperinsulinemia in L-Insulin Receptor KO mice despite lack of hepatic insulin signaling
(A) Western blot from primary hepatocyte and liver lysates of mice from indicated gentoypes probed for specific proteins as indicated. (B) Western blot of liver lysates in mice fasted overnight and I.P injected with either saline or insulin (2mU/g) and probed for specific proteins as indicated. (C) Western blot of liver lysates in mice fasted overnight and refed normal chow for 4 h and probed for specific proteins as indicated. (D,E) Blood glucose concentrations in mice after overnight fast (D) and overnight fasted following by 4 h refeeding of normal chow (E). * p<0.05 vs LWT, #p<0.05 vs L-Insulin Receptor KO. LWT group includes total of 18 mice in fasting group with n=10 IRloxP/loxP and n=8 IRloxP/loxP;Foxo1loxP/loxP and in refed group includes total of 9 mice in fasting group with n=4 IRloxP/loxP and n=5 IRloxP/loxP;Foxo1loxP/loxP. L-Insulin Receptor KO includes n=12 for fasting group and n=6 for refed group. L-IRFoxo1DKO includes n=22 for fasting group and n=7 for refed group. (F) Intraperitoneal glucose tolerance test (2 g per kg) on overnight fasted mice. LWT group includes total of 8 mice with n=6 IRloxP/loxP and n=2 IRloxP/loxP;Foxo1loxP/loxP. L-Insulin Receptor KO includes n=7 and L-IRFoxo1DKO includes n=8. *p<0.05 vs LWT, ****p<0.0001 vs LWT (G) Insulin levels before and after 15 minutes following glucose injection. LWT group includes total of 8 mice with n=6 IRloxP/loxP and n=2 IRloxP/loxP;Foxo1loxP/loxP, L-Insulin Receptor KO includes n=6 and L-IRFoxo1DKO includes n=13, for fasting group. LWT group includes total of 3 mice with n=2 IRloxP/loxP and n=1 IRloxP/loxP;Foxo1loxP/loxP, L-Insulin Receptor KO includes n=3 and L-IRFoxo1DKO includes n=8 for 15 min group. ****p<0.0001 vs LWT, #p<0.05 vs L-Insulin Receptor KO (H) Intraperitoneal glucose tolerance test (2 g per kg) on overnight fasted mice. n=7-10 mice. LWT group includes total of 6 mice with n=5 IRloxP/loxP and n=1 IRloxP/loxP;Foxo1loxP/loxP. L-Insulin Receptor KO includes n=8 and L-IRFoxo1DKO includes n=5. **p<0.01 vs LWT, ****p<0.0001 vs LWT. All data are presented as mean ± s.e.m. Statistical analysis was performed using one-way analysis of variance followed by Tukey post-test when more than two groups were compared, two-way analysis of variance followed by Bonferroni when two conditions were involved. A P <0.05 was considered statistically significant.
Figure 3
Figure 3. L-IRFoxo1DKO are insulin responsive during euglycemic clamps
Hyperinsulinemic-euglycemic clamps were perfromed on unrestrained 5 h fasted mice using a 2.5 mU/ming/kg infusion of insulin. (A) Steady state glucose infusion rate (B) rate of glucose disposal (C) hepatic glucose production during basal and insulin portions of the clamp (D) percent suppression of hepatic glucose production during the clamp portion compared to basal period (E) insulin levels during during basal and insulin portions of the clamp. *p<0.05 vs LWT, **p<0.01 vs LWT, ***p<0.001 vs LWT, ****p<0.0001 vs LWT #p<0.05 vs Insulin Receptor KO, &p<0.01 vs L-Insulin Receptor KO, $p<0.0001 vs L-Insulin Receptor KO. LWT group includes total of 4 mice with n=2 IRloxP/loxP and n=2 IRloxP/loxP;Foxo1loxP/loxP. L-Insulin Receptor KO includes n=6 and L-IRFoxo1DKO includes n=4. ****p<0.0001 vs LWT $p<0.0001 vs L-Insulin Receptor KO. (F) Relative expression of G6pc and Pck1 under euglycemic conditions with/without infusion of 2.5 mU/min/kg of insulin for 120 mins. *p<0.05 vs PBS of indicated genotype. n=3 (PBS), n=6 (insulin). (G) Relative expression of G6pc and Pck1 under euglycemic conditions with infusion of 2.5 mU/min/kg of insulin for 120 mins. LWT group includes total of 4 mice with n=2 IRloxP/loxP and n=2 IRloxP/loxP;Foxo1loxP/loxP. L-Insulin Receptor KO includes n=4 and L-IRFoxo1DKO includes n=4. ****p<0.0001 vs LWT $p<0.0001 vs L-Insulin Receptor KO. All data are presented as mean ± s.e.m. Statistical analysis was performed using one-way analysis of variance followed by Tukey post-test. A P <0.05 was considered statistically significant.
Figure 4
Figure 4. Metabolic transcriptional response to feeding in the absense of hepatic insulin signaling
Hepatic gene expression in LWT, L-Insulin Receptor KO, and LIRFoxo1DKO following an overnight fast and 4 h of refeeding normal chow. LWT group includes total of 9 mice with n=5 IRloxP/loxP and n=4 IRloxP/loxP;Foxo1loxP/loxP. L-Insulin Receptor KO includes n=6 and L-IRFoxo1DKO includes n=4-5 *p<0.05 vs fasted condition of indicated genotype, **p<0.01 vs fasted condition of indicated genotype, ***p<0.001 vs fasted condition of indicated genotype, ****p<0.0001 vs fasted condition of indicated genotype, #p<0.0001 vs fasted LWT, &p<0.0001 vs fed LWT. All data are presented as mean ± s.e.m. Statistical analysis was performed using two-way analysis of variance followed by Bonferroni post-test. A P <0.05 was considered statistically significant.
Figure 5
Figure 5. Glucose Production and gluconeogenic gene response to insulin and cAMP in isolated primary hepatocytes
Primary hepatocytes were isolated from indicated genotype and treated with either 0.1 mM db-cAMP and/or 0.1 μM insulin for 6 h. (A) Glucose concentration in media was determined and expressed normalized to protein concentration. (B) Gene expression analysis was performed at the end of the treatments. Data is from a representative experiment and presented as mean ± SEM. *p<0.05 vs basal condition of indicated genotype, **p<0.01 vs basal condition of indicated genotype, ***p<0.001 vs basal condition of indicated genotype, ****p<0.001 vs basal condition of indicated genotype , #p<0.0001 vs L-Insulin Receptor KO, &p<0.0001 vs LWT for indicated treatment condition. All data are presented as mean ± s.e.m. Statistical analysis was performed using two-way analysis of variance followed by Bonferroni post-test. A P <0.05 was considered statistically significant. (C) In hepatocytes, insulin stimulates the kinase Akt thus inactivating the transcription factor Foxo1, which leads to the suppression of gluconeogenic genes and glucose production. In addition to the canonical IR-Akt liver pathway, there is an insulin responsive non-hepatic tissue (tissue X) capable of communicating with the liver to regulate hepatic glucose output and gluconeogenic genes. An unidentified liver pathway receives the insulin signal via tissue X to suppress gluconeogenic genes and glucose output in response to insulin. Deletion in liver of the IR, Irs, or Akt gene or high fat diet feeding leads to abberant Foxo1 activity, which represses this unidentified liver pathway. Ablation of hepatic Foxo1 alleviates this suppressive effect allowing insulin to regulate hepatic glucose metabolism.

Comment in

  • FoxO1: mute for a tuned metabolism?
    Cheng Z. Cheng Z. Trends Endocrinol Metab. 2015 Aug;26(8):402-3. doi: 10.1016/j.tem.2015.06.006. Epub 2015 Jul 11. Trends Endocrinol Metab. 2015. PMID: 26170190

References

    1. Rizza RA. Pathogenesis of fasting and postprandial hyperglycemia in type 2 diabetes: implications for therapy. Diabetes. 2010;59:2697–2707. - PMC - PubMed
    1. Nakae J, Park BC, Accili D. Insulin stimulates phosphorylation of the forkhead transcription factor FKHR on serine 253 through a Wortmannin-sensitive pathway. J Biol Chem. 1999;274:15982–15985. - PubMed
    1. Lin HV, Accili D. Hormonal regulation of hepatic glucose production in health and disease. Cell Metab. 2011;14:9–19. - PMC - PubMed
    1. Leavens KF, Birnbaum MJ. Insulin signaling to hepatic lipid metabolism in health and disease. Crit Rev Biochem Mol Biol. 2011;46:200–215. - PubMed
    1. Menon S, et al. Spatial control of the TSC complex integrates insulin and nutrient regulation of mTORC1 at the lysosome. Cell. 2014;156:771–785. - PMC - PubMed

Publication types