. 2015 May 12:6:7086.
doi: 10.1038/ncomms8086.

CD11c-mediated deletion of Flip promotes autoreactivity and inflammatory arthritis

Affiliations

CD11c-mediated deletion of Flip promotes autoreactivity and inflammatory arthritis

Qi-Quan Huang et al. Nat Commun. .

Abstract

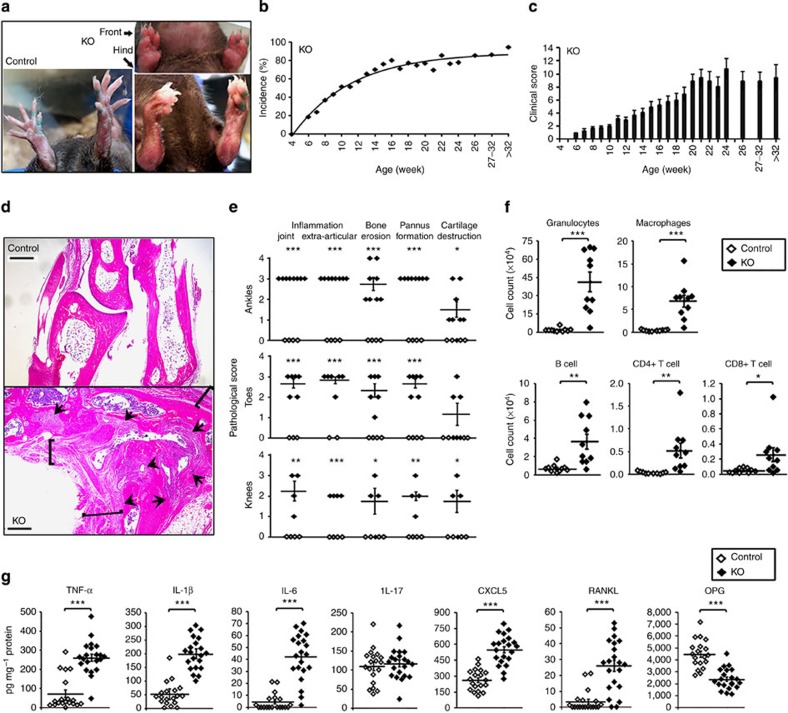
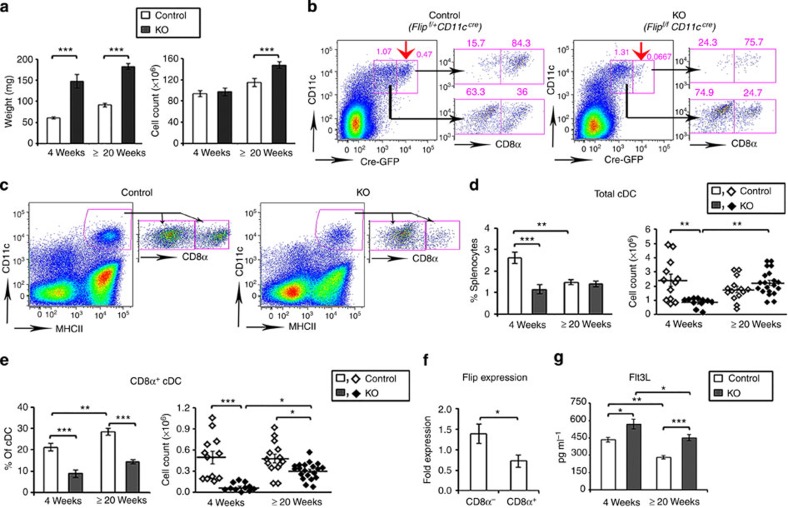
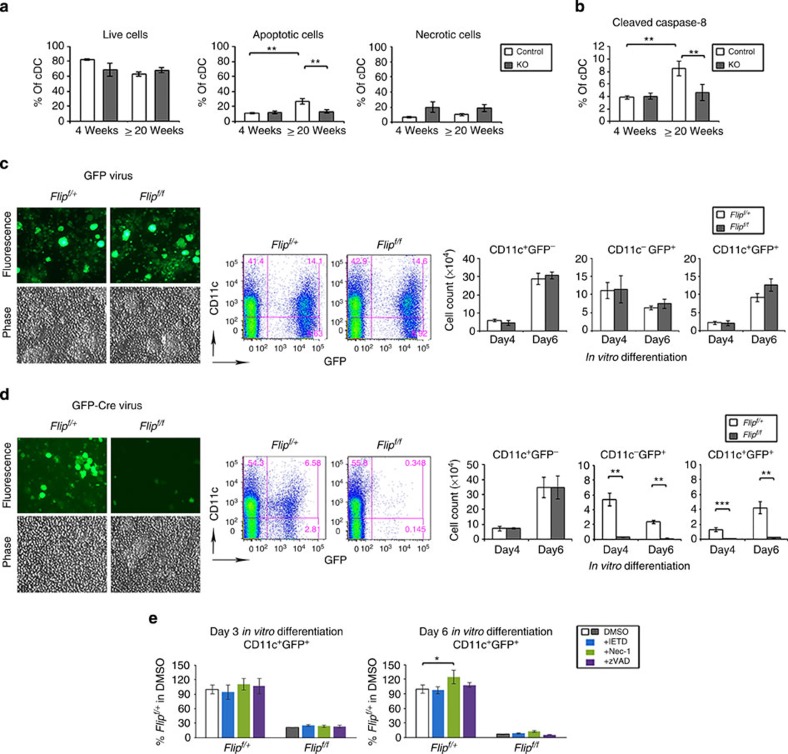
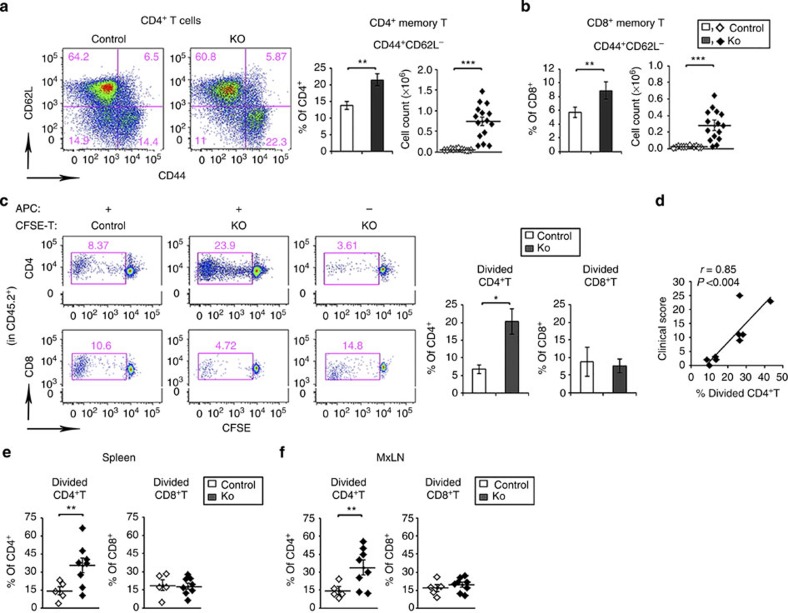
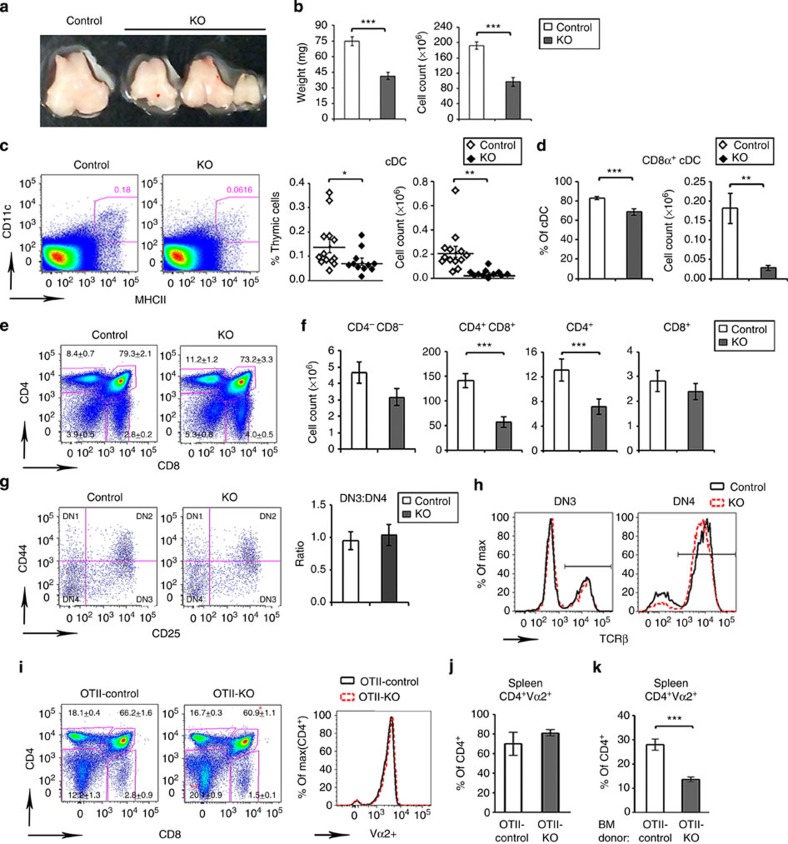
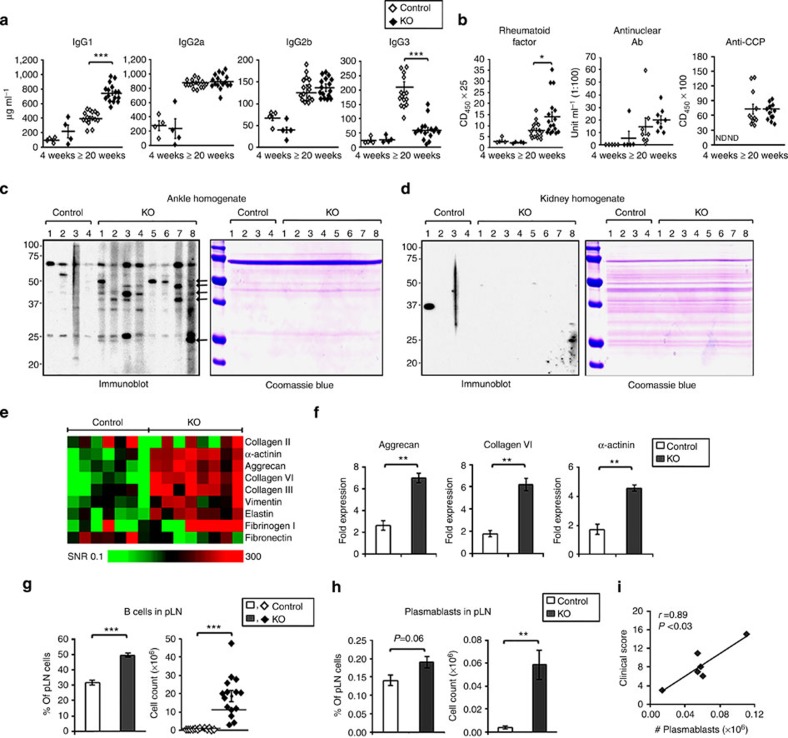
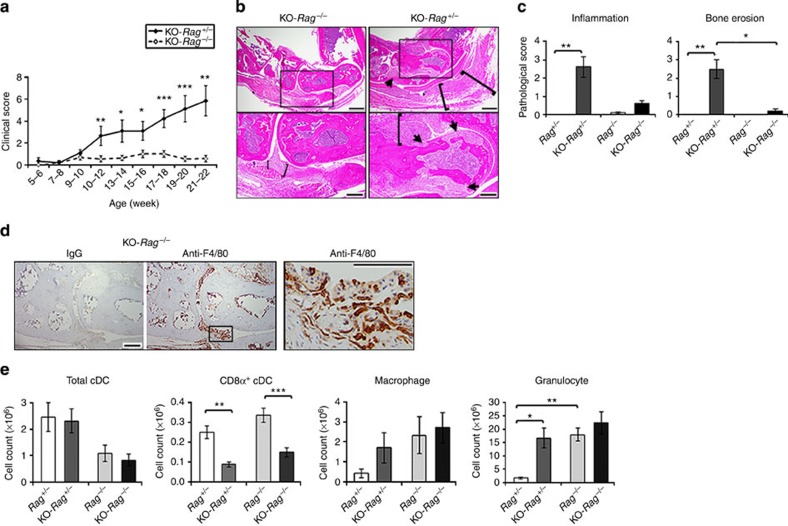
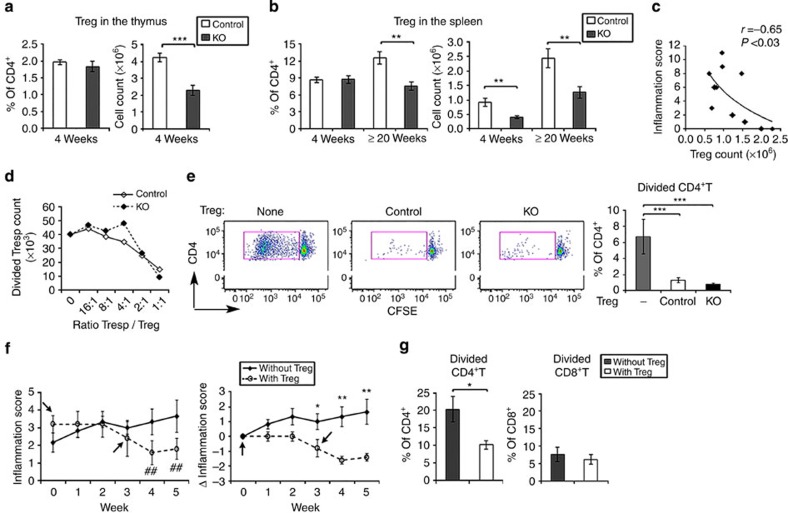
Dendritic cells (DCs) are critical for immune homeostasis. To target DCs, we generated a mouse line with Flip deficiency in cells that express cre under the CD11c promoter (CD11c-Flip-KO). CD11c-Flip-KO mice spontaneously develop erosive, inflammatory arthritis, resembling rheumatoid arthritis, which is dramatically reduced when these mice are crossed with Rag(-/-) mice. The CD8α(+) DC subset is significantly reduced, along with alterations in NK cells and macrophages. Autoreactive CD4(+) T cells and autoantibodies specific for joint tissue are present, and arthritis severity correlates with the number of autoreactive CD4(+) T cells and plasmablasts in the joint-draining lymph nodes. Reduced T regulatory cells (Tregs) inversely correlate with arthritis severity, and the transfer of Tregs ameliorates arthritis. This KO line identifies a model that will permit in depth interrogation of the pathogenesis of rheumatoid arthritis, including the role of CD8α(+) DCs and other cells of the immune system.


Figures

Figure 1
Figure 1. CD11c-Flip-KO mice develop spontaneous arthritis.
(a) Representative joint swelling and flexion contraction in CD11c-Flip-KO (KO) mice. (b) Clinical incidence and (c) severity of spontaneous arthritis, n=16–57 at each time point. (d) Representative H&E histology of ankles of control and CD11c-Flip-KO (KO) mice. The arrowheads identify bone erosion and pannus formation, and the brackets indicate articular and extra-articular inflammation. Scale bar, 500 μm. (e) The comparison of histological scoring for ankles, toes and knees. (f) CD45+ inflammatory cells from ankles and knees were identified using flow cytometry employing antibodies to Ly6G, F4/80, CD19, CD4 and CD8. (g) Inflammatory mediators in ankle homogenates determined using ELISA. The concentration of each molecule was adjusted to total ankle homogenate protein (mg). For c through g, only the CD11c-Flip-KO mice with arthritis were included, which were compared with littermate controls. The values presented are the mean±1s.e. (*P<0.05, **P<0.01 and ***P<0.001, unpaired two-sided t-test).
Figure 2
Figure 2. Decreased CD8α+ cDCs in spleens of CD11c-Flip-KO mice.
(a) Increased spleen weight and cell number in CD11c-Flip-KO (KO) mice (n=26–36 per group). (b) Representative (of ≥3) flow cytometry gating for CD11c+Cre-GFPhi cells. The red arrows identify the Cre-GFPhi population. CD8α expression in both Cre-GFPlo and Cre-GFPhi population are indicated on the right for each panel. (c) Representative flow cytometry gating for total spleen cDCs and the CD8α+ subset at 4 weeks. The total cDCs are defined as CD64CD11c+MHCII+ (d), and its CD8α+ subset (e), which was both analysed by percentage and cell numbers. (f) Flip expression determined using RT–PCR employing purified CD11c+MHCII+CD8α+ and CD8α cDCs (n=4). (g) The concentration of Flt3 ligand (Flt3L, pg ml−1) in the serum of mice was determined using ELISA (n=15 in each group, except for n=35 in the CD11c-Flip-KO (KO) mice ≥20 week). The values presented are the mean ±1 s.e. (**P<0.01 and ***P<0.001; (a,b,f) unpaired two-sided t-test; (d,e,g) ANOVA plus Tukey).
Figure 3
Figure 3. Flip is necessary for DC development.
(a) cDCs in vivo apoptosis and necrosis in spleen were examined with 7AAD and Annexin V, gating on the CD64CD11c+MHCII+ DC population in the CD11c-Flip-KO (KO) and littermate control mice (n=4–5 per group). Live cells were identified as 7AADAnnexin V, apoptotic cells were 7AADAnnexin V+ and necrotic cells are 7AAD+. (b) The caspase-8 activation in cDCs was determined employing an antibody to cleaved caspase-8, (n=5–6 per group). (ce) Lineage-negative (Lin) haematopoietic stem cells from the bone marrow of Flipf/+ or Flipf/f mice were isolated and infected with recombinant retroviral vectors expressing GFP alone (c) or GFP-Cre (d) followed by in vitro differentiation in a medium containing Flt3L and GM-CSF. Representative fluorescence microscopy and flow histograms (day 6 post differentiation) for each viral infection is presented. The numbers of CD11c+GFP, CD11cGFP+ or CD11c+GFP+ cells were determined using flow cytometry. (e) Lin haematopoietic stem cells from the bone marrow of Flipf/+ or Flipf/f mice (n=3 per group) were infected with the GFP-Cre retrovirus and differentiated as in d, except differentiation was performed in the dimethylsulphoxide (DMSO) control medium or a medium containing optimal concentrations of IETD.fmk, necrostatin-1 or zVAD.fmk. Cells were harvested at 3 or 6 days of differentiation. The data were analysed adjusting the values for the Flipf/+ cells in control medium to 100%. ( (ce) n=3 per group from two independent experiments). (*P<0.05, **P<0.01 and ***P<0.001; for a,b,e, ANOVA plus Tukey; for d, unpaired two-sided t-test).
Figure 4
Figure 4. CD4+ T cells from CD11c-Flip-KO mice are autoreactive.
(a,b) pLNs were examined for memory T cells (CD44+CD62L) in CD4+ (a) and CD8+ (b) T-cell populations at ≥20 weeks in the CD11c-Flip-KO (KO) and control mice. (c) In vitro syngeneic mixed lymphocyte response was employed to identify autoreactive T cells. T cells from the pLNs and brachial LNs of ≥20 week CD11c-Flip-KO mice were CFSE-labelled and represent the responder T cells (3 × 10⁵). The antigen-presenting cells (APCs) are T-cell-depleted spleen cells from CD45.1 mice (3 × 10⁵). After co-culture for 5–7 days, cell division was determined by the dilution of CFSE. The panels on the left are representative flow gating defining the divided cells present in the CD45.2+ CD4+ or CD8+ T-cell populations. The panels on the right are the analysis of KO (n=9) and control mice (n=4). (d) Correlation (Pearson's) between the severity of arthritis in Flip-DC-KO mice just before being killed and the percent of divided CD4+ T cells as defined in c. Identification of autoreactive T cells by adoptive transfer of CFSE-labelled T cells from the (e) spleen and (f) MxLNs of CD11c-Flip-KO or littermate control mice (≥20 weeks, CD45.2+) into CD45.1 recipients. The autoreactive T cells were defined using flow cytometry as defined in c. The spleens and MxLNs from the recipients were examined 8–11 days after transfer. Each data point represents an individual recipient mouse that received T cells from a single donor (*P<0.05, **P<0.01 and ***P<0.001, unpaired two-sided t-test).
Figure 5
Figure 5. Alterations in the thymus precede development of arthritis in the CD11c-Flip-KO mice.
(a,b) Representative photos of thymi, which were analysed by weight and cell count (n=25–27 per group). (c) Identification of total cDC and (d) the CD8α+ subset, presented as percent and total number. cDCs were defined as CD64CD11c+MHCII+ (n=11–13 per group). (e,f) Thymocytes were characterized for the (e) percent and (f) number of CD4 and CD8 as CD4CD8−(DN), CD4+CD8+ (DP) and CD4 or CD8 SP (n=8–9 per group). The numbers in the histogram (e) represent the means±s.e for each population. (g) Development from the DN1 through DN4 of CD4CD8 thymocytes determined by antibodies to CD25 and CD44, and the ratio of DN3/DN4 (n=8–9 per group). (h) Representative overlay of intracellular TCR-β expression in DN3 and DN4 cells (n=3 per group). (i) Comparison of the thymocytes in mice crossed with OTII, genotyped as OTII-Flipflox/flox, CD11c+ (OTII-control) and OTII-Flipflox/flox, CD11ccre (OTII-KO; n=4 per group). The expression of OTII transgene Vα2 in CD4+ T cell is overlaid (right panel). (j) Assessment of clonotypic CD4+Vα2+ T cells in spleens of OTII-control mice and OTII-KO mice (n=4 per group) and (k) of irradiated RIP-mOVA recipients that received the BM from OTII-control or OTII-KO donors (n=7–10 per group). The data are presented as percent of CD4+Vα2+ cells of all CD4+ cells. (*P<0.05, **P<0.01 and ***P<0.001, unpaired two-sided t-test).
Figure 6
Figure 6. Autoantibodies and increased B cells and plasmablasts in CD11c-Flip-KO mice.
(a) Quantification of serum IgG subclasses by ELISA (μg ml−1) in the CD11c-Flip-KO (KO) and control mice. (b) ELISA quantification of serum RF, ANA and antiCCP (lower panel). Values are presented as OD450 × serum dilution for RF and anti-CCP and units for ANA. (c,d) Immunoblotting of ankle (c) and kidney (d) homogenates from Rag−/− mice employing individual serum randomly selected from control and CD11c-Flip-KO mice (≥20 weeks) and a duplicated tissue blot stained with Coomassie blue R250. The arrows identify protein bands common between individual CD11c-Flip-KO but not in control mice. The blots are representative of three independent experiments. (e,f) Antibodies identified by autoantigen array. (e). Heatmap of IgG antibodies to joint-related antigens, generated as the signal-to-noise ratio (SNR) for each antigen (controls n=7, CD11c-Flip-KO mice ≥20 weeks with arthritis, n=8). (f) Three autoantibodies in the array were significantly increased following the Bonferroni correction in the CD11c-Flip-KO mice. (g,h) pLNs were examined for B cells (n=12–15 per group) and plasmablasts (n=6 per group) from mice ≥20 weeks. B cells were defined as CD19+B220+ and plasmablasts as CD19+B220+CD138+ in the CD64CD11b population. (i) Correlation (Pearson's) between the number of pLN plasmablasts and the arthritis clinical score for CD11c-Flip-KO mice just before killing. The values represent the mean±1 s.e. (*P<0.05, **P<0.01 and ***P<0.001, all panels unpaired two-sided t-test and in f unpaired two-sided t-test followed by the Bonferroni correction).
Figure 7
Figure 7. Reduced arthritis progression in KO-Rag−/− mice.
The CD11c-Flip-KO mice were crossed with Rag−/− mice to generate the KO-Rag−/− line. (a) The spontaneous development of arthritis in KO-Rag−/−mice was compared with the littermate KO-Rag+/− mice (n=7–10 KO-Rag+/− mice and 7–16 KO-Rag−/− at the observed time points). No arthritis was observed in the Rag−/−or Rag+/− mice. (b) Representative (of four to five per group) H&E histology of ankles of KO-Rag−/− mice and KO-Rag+/− mice. The arrowheads identify bone erosion and pannus formation, and the brackets indicate inflammation. The boxed areas in upper panels (scale bar, 500 μm) are enlarged in the lower panels (scale bar, 200 μm). (c) The analysis of inflammation and bone erosion scores for ankles harvested from Rag−/−, KO-Rag−/− and KO-Rag+/− mice (n=4–5 mice for each group) harvested at the termination of the experiment (21–22 weeks). (d) Representative (of n=5) immunohistochemistry of joints from CD11c-Flip-KO mice for F4/80+ macrophages (scale bar, 200 μm). The boxed area in F4/80 staining is enlarged in the right panel (scale bar, 100 μm). (e) At the time of killing, spleens examined for DCs, macrophages and granulocytes (n=4–5 per group). The values presented are mean ±1 s.e. (*P<0.05, **P<0.01 and ***P<0.001; (a) unpaired two-sided t-test; (c) ANOVA plus Dunn and (e) ANOVA plus Tukey).
Figure 8
Figure 8. Reduced Tregs in CD11c-Flip-KO mice contribute to the pathogenesis of arthritis.
(a) The percent and number of Tregs in the thymus (n=15 per group), defined as CD4+CD25+Foxp3+ in the CD11c-Flip-KO (KO) and control mice. (b) Tregs in spleens at 4 weeks (n=11) and ≥20 weeks (n=6–9), defined as CD4+CD25+Foxp3+. (c) Correlation (Pearson's) between the number of spleen Tregs and the inflammation score of arthritis in CD11c-Flip-KO mice (≥20 week) determined just before killing. (d) The in vitro suppressive function of Tregs. The CD45.2+CD4+CD25+ T cells from CD11c-Flip-KO or control mice were co-cultured with CFSE-labelled CD45.1+CD4+D25 Tresp cells at indicated ratios on anti-CD3 mAb-coated plates for 3 days, and examined for the CFSE dilution of CD4+ T cells. The results are representative of three experiments. Cell number was calculated by flow counting beads. (e) The in vitro suppressor function by Tregs for autoreactive CD4+T-cell proliferation, determined by in vitro syngeneic mixed lymphocyte response same as in Fig. 4. Results from three independent experiments, n=3 without Tregs and n=5 with Tregs. (f)The in vivo Treg function. CD11c-Flip-KO mice (n=5) were adoptively transferred with two dosages (∼ 2 × 10⁶ per dose) of CD4+CD25+ T cells isolated from the spleens of CD45.1 mice at 0 and 3 weeks. Six age-matched CD11c-Flip-KO mice served as the no-treatment controls. The values in the left panel represent the mean ±1 s.e of the inflammation scores, ##P<0.01 (paired t test) compared with the score at week 0. The data in right panel reflect the change in the inflammation score (Δ). (g) In vitro syngeneic mixed lymphocyte response. The T cells from the pLNs and brachial LNs of the Treg-treated mice (in f) were CFSE-labelled and incubated with syngeneic APCs to identify autoreactive T cells. The values for the autoreactive T cells of CD11c-Flip-KO mice without Treg treatment are same as presented in Fig. 4c, which are used here for comparison (*P<0.05, **P<0.01 and ***P<0.001, unpaired two-sided t-test, except(e) ANOVA plus Tukey).

References

    1. Shortman K. & Naik S. H. Steady-state and inflammatory dendritic-cell development. Nat. Rev. Immunol. 7, 19–30 (2007). - PubMed
    1. Ganguly D., Haak S., Sisirak V. & Reizis B. The role of dendritic cells in autoimmunity. Nat. Rev. Immunol. 13, 566–577 (2013). - PMC - PubMed
    1. Belz G. T. & Nutt S. L. Transcriptional programming of the dendritic cell network. Nat. Rev. Immunol. 12, 101–113 (2012). - PubMed
    1. Gallegos A. M. & Bevan M. J. Central tolerance to tissue-specific antigens mediated by direct and indirect antigen presentation. J. Exp. Med. 200, 1039–1049 (2004). - PMC - PubMed
    1. Dresch C. et al. Thymic but not splenic CD8(+) DCs can efficiently cross-prime T cells in the absence of licensing factors. Eur. J. Immunol. 41, 2544–2555 (2011). - PubMed

Publication types

Substances