Pathway-based personalized analysis of breast cancer expression data
- PMID: 25963740
- PMCID: PMC5528809
- DOI: 10.1016/j.molonc.2015.04.006
Pathway-based personalized analysis of breast cancer expression data
Abstract
Introduction: Most analyses of high throughput cancer data represent tumors by "atomistic" single-gene properties. Pathifier, a recently introduced method, characterizes a tumor in terms of "coarse grained" pathway-based variables.
Methods: We applied Pathifier to study a very large dataset of 2000 breast cancer samples and 144 normal tissues. Pathifier uses known gene assignments to pathways and biological processes to calculate for each pathway and tumor a Pathway Deregulation Score (PDS). Individual samples are represented in terms of their PDSs calculated for several hundred pathways, and the samples of the data set are analyzed and stratified on the basis of their profiles over these "coarse grained", biologically meaningful variables.
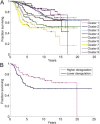
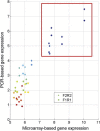
Results: We identified nine tumor subtypes; a new subclass (comprising about 7% of the samples) exhibits high deregulation in 38 PKA pathways, induced by overexpression of the gene PRKACB. Another interesting finding is that basal tumors break into two subclasses, with low and high deregulation of a cluster of immune system pathways. High deregulation corresponds to higher concentrations of Tumor Infiltrating Lymphocytes, and the patients of this basal subtype have better prognosis. The analysis used 1000 "discovery set" tumors; our results were highly reproducible on 1000 independent "validation" samples.
Conclusions: The coarse-grained variables that represent pathway deregulation provide a basis for relevant, novel and robust findings for breast cancer. Our analysis indicates that in breast cancer reliable prognostic signatures are most likely to be obtained by treating separately different subgroups of the patients.
Keywords: Breast cancer; PKA pathways; Pathway-based analysis.
Copyright © 2015 Federation of European Biochemical Societies. Published by Elsevier B.V. All rights reserved.
Figures


References
-
- Alexe, G. , Dalgin, G.S. , Scanfeld, D. , Tamayo, P. , Mesirov, J.P. , DeLisi, C. , Harris, L. , Barnard, N. , Martel, M. , Levine, A.J. , Ganesan, S. , Bhanot, G. , 2007. High expression of lymphocyte-associated genes in node-negative HER2+ breast cancers correlates with lower recurrence rates. Cancer Res. 67, 10669–10676. - PubMed
-
- Ali, H.R. , Provenzano, E. , Dawson, S.J. , Blows, F.M. , Liu, B. , Shah, M. , Earl, H.M. , Poole, C.J. , Hiller, L. , Dunn, J.A. , Bowden, S.J. , Twelves, C. , Bartlett, J.M.S. , Mahmoud, S.M.A. , Rakha, E. , Ellis, I.O. , Liu, S. , Gao, D. , Nielsen, T.O. , Pharoah, P.D.P. , Caldas, C. , 2014. Association between CD8+ T-cell infiltration and breast cancer survival in 12,439 patients. Ann. Oncol. 25, 1536–1543. - PubMed
-
- Benjamini, Y. , Hochberg, Y. , 1995. Controlling the false discovery rate – a practical and powerful approach to multiple testing. J. Roy Stat. Soc. B 57, 289–300.
-
- Beuschlein, F. , Fassnacht, M. , Assie, G. , Calebiro, D. , Stratakis, C.A. , Osswald, A. , Ronchi, C.L. , Wieland, T. , Sbiera, S. , Faucz, F.R. , Schaak, K. , Schmittfull, A. , Schwarzmayr, T. , Barreau, O. , Vezzosi, D. , Rizk-Rabin, M. , Zabel, U. , Szarek, E. , Salpea, P. , Forlino, A. , Vetro, A. , Zuffardi, O. , Kisker, C. , Diener, S. , Meitinger, T. , Lohse, M.J. , Reincke, M. , Bertherat, J. , Strom, T.M. , Allolio, B. , 2014. Constitutive activation of PKA catalytic subunit in adrenal Cushing's syndrome. New Engl. J. Med. 370, 1019–1028. - PMC - PubMed
Publication types
MeSH terms
Substances
Grants and funding
LinkOut - more resources
Full Text Sources
Other Literature Sources
Medical
Molecular Biology Databases
Miscellaneous

