. 2016 Feb 15;524(3):456-70.
doi: 10.1002/cne.23801. Epub 2015 Jun 3.

S-phase duration is the main target of cell cycle regulation in neural progenitors of developing ferret neocortex

Affiliations

S-phase duration is the main target of cell cycle regulation in neural progenitors of developing ferret neocortex

Miguel Turrero García et al. J Comp Neurol. .

Abstract

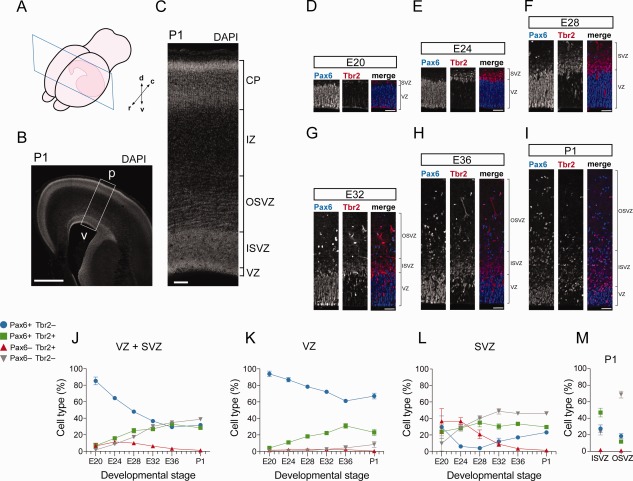
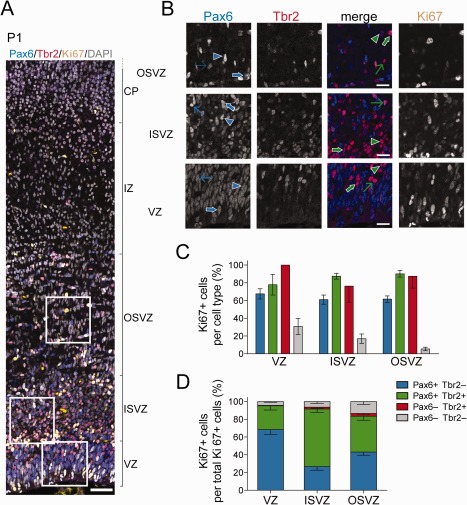
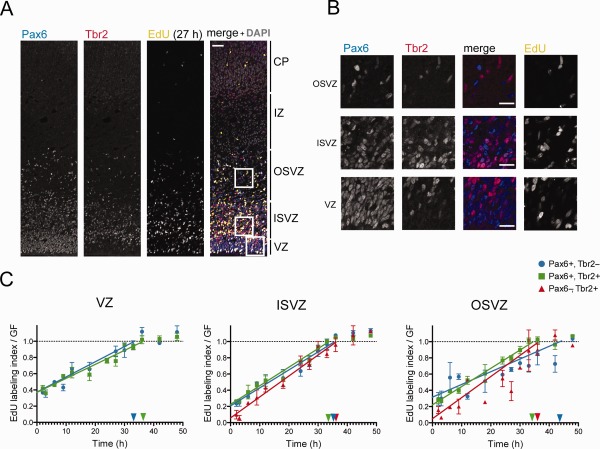
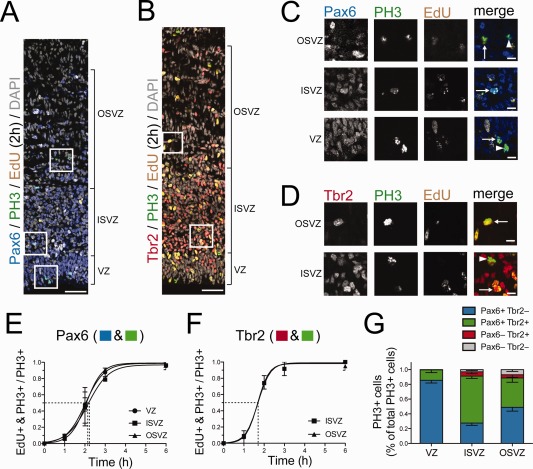
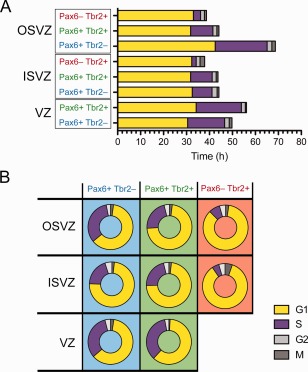
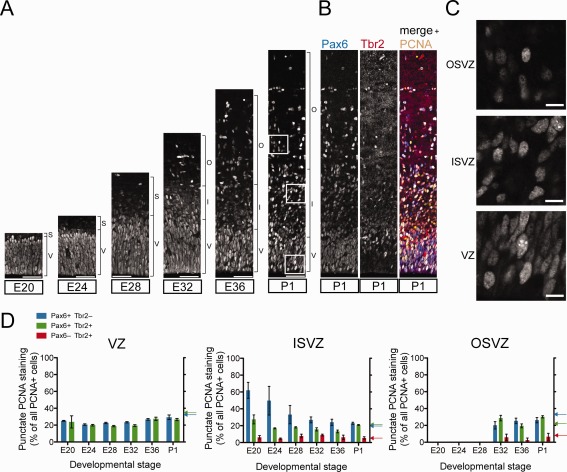
The evolutionary expansion of the neocortex primarily reflects increases in abundance and proliferative capacity of cortical progenitors and in the length of the neurogenic period during development. Cell cycle parameters of neocortical progenitors are an important determinant of cortical development. The ferret (Mustela putorius furo), a gyrencephalic mammal, has gained increasing importance as a model for studying corticogenesis. Here, we have studied the abundance, proliferation, and cell cycle parameters of different neural progenitor types, defined by their differential expression of the transcription factors Pax6 and Tbr2, in the various germinal zones of developing ferret neocortex. We focused our analyses on postnatal day 1, a late stage of cortical neurogenesis when upper-layer neurons are produced. Based on cumulative 5-ethynyl-2'-deoxyuridine (EdU) labeling as well as Ki67 and proliferating cell nuclear antigen (PCNA) immunofluorescence, we determined the duration of the various cell cycle phases of the different neocortical progenitor subpopulations. Ferret neocortical progenitors were found to exhibit longer cell cycles than those of rodents and little variation in the duration of G1 among distinct progenitor types, also in contrast to rodents. Remarkably, the main difference in cell cycle parameters among the various progenitor types was the duration of S-phase, which became shorter as progenitors progressively changed transcription factor expression from patterns characteristic of self-renewal to those of neuron production. Hence, S-phase duration emerges as major target of cell cycle regulation in cortical progenitors of this gyrencephalic mammal.

Keywords: AB_10569705; AB_10615604; AB_2142367; AB_2295065; AB_778267; AB_95106; RRIDs: AB_2313780; SciRes_000137; cortical development; evolution; gyrencephaly; neurogenesis; nif-0000-30467.


Figures

Figure 1
Figure 1
Pax6‐ and/or Tbr2‐expressing cell subpopulations in the germinal zones of developing ferret neocortex. A: Cartoon showing a coronal section of a P1 ferret hemisphere, with the rostrocaudal (r–c) and dorsoventral (d–v) axes as indicated. B,C: DAPI staining of P1 ferret neocortex (100‐μm coronal vibratome section, stack of four 2.5‐μm optical sections). The box in B indicates the area shown at higher magnification in C. p, pial surface; v, ventricle. D–I: Double immunofluorescence for Pax6 (blue in merged images) and Tbr2 (red in merged images) on 20‐μm coronal cryosections of ferret neocortex at the indicated stages (single 1‐μm optical sections). J–M: Quantification of Pax6+ & Tbr2− (blue), Pax6+ & Tbr2+ (green), Pax6− & Tbr2+ (red) and Pax6− & Tbr2− (gray) nuclei in the VZ+SVZ (J), VZ (K), SVZ (L), and ISVZ vs. OSVZ (M) of ferret neocortex at the indicated developmental stages, each expressed as percentage of total nuclei in the respective zone(s) as determined by DAPI staining. Data are the mean ± SD (E20, n = 8; E24, n = 4; E28, n = 4; E32, n = 5; E36, n = 4; P1, n = 8). Scale bar = 1 mm in B; 100 μm in C; 50 μm in D–I.
Figure 2
Figure 2
Proportion of cycling progenitors among the various cell subpopulations in the germinal zones of P1 ferret neocortex. A: Triple immunofluorescence for Pax6 (blue), Tbr2 (red), and Ki67 (yellow), combined with DAPI staining (gray), on a 20‐μm coronal cryosection of P1 ferret neocortex (1‐μm optical section). Scale bar, 50 μm. B: Higher magnification of the areas indicated in A, showing immunofluorescence for Pax6 (first column, blue in merged images), Tbr2 (second column, red in merged images), Pax6 & Tbr2 (merge, third column), and Ki67 (fourth column). Selected cells are indicated as follows: blue arrowheads, Pax6+ Tbr2− Ki67−; thin blue arrows, Pax6+ Tbr2− Ki67+ (low Ki67 intensity); thick blue arrows, Pax6+ Tbr2− Ki67+ (high Ki67 intensity); green arrowheads, Pax6+ Tbr2+ Ki67−; thin green arrows, Pax6+ Tbr2+ Ki67+ (low Ki67 intensity); thick green arrows, Pax6+ Tbr2+ Ki67+ (high Ki67 intensity). C: Quantification of the percentage of Ki67+ cells within each Pax6± & Tbr2± cell subpopulation (see key) for each of the three germinal zones of P1 ferret neocortex. Data are the mean ± SD (n = 8). D: Quantification of the percentage of the Ki67+ cells of each Pax6± & Tbr2± cell subpopulation (see key) within the total Ki67+ cells for each of the three germinal zones of the P1 ferret neocortex. Data are the mean ± SD (n = 8). Scale bar = 50 μm in A; 20 μm in B.
Figure 3
Figure 3
Cumulative EdU labeling of P1 ferret neocortical progenitors. A: Triple (immuno)fluorescence for Pax6 (blue in merged image), Tbr2 (red in merged image), and EdU (yellow in merged image), combined with DAPI staining (gray in merged image), on a 20‐μm coronal cryosection of P1 ferret neocortex (1‐μm optical section), after 27 hours of cumulative EdU labeling. B: Higher magnification of the areas indicated in A, showing immunofluorescence for Pax6 (first column, blue in merged images), Tbr2 (second column, red in merged images), Pax6 & Tbr2 (merge, third column), and EdU (fourth column). C: Cumulative EdU labeling of Pax6+ & Tbr2− (blue circles), Pax6+ & Tbr2+ (green squares), and Pax6− & Tbr2+ (red triangles) progenitors in each of the three germinal zone of P1 (start of EdU labeling) ferret neocortex. Color‐coded horizontal dashed lines indicate the growth fraction of the respective progenitor subpopulation as determined from the plateau of cumulative labeling. Color‐coded arrows on the Y‐axes indicate the proportion of cycling progenitors in the respective cell subpopulation as determined in Figure 2C. Color‐coded arrowheads on the X‐axes indicate the time at which the respective progenitor subpopulation is predicted to reach the plateau (corresponding to TC‐TS). Data are the mean ± SEM (n = 3 for all time points, except for 2, 6, 9, and 18 hours, for which n = 2; in the latter cases, error bars indicate the variation of the individual values from the mean). Scale bar = 50 μm in A; 20 μm in B.
Figure 4
Figure 4
Cumulative EdU labeling of mitotic P1 ferret neocortical progenitors. A,C: Triple (immuno)fluorescence for either Pax6 (A, blue) or Tbr2 (C, red), phosphohistone H3 (PH3, green), and EdU (yellow), combined with DAPI staining (gray), on a 10‐μm coronal cryosection of P1 ferret neocortex after 2 hours of EdU labeling (single 1‐μm optical section). B,D: Higher magnification of the regions indicated in A and C, respectively. B: Arrows indicate Pax6+ PH3+ EdU+ mitotic cells and arrowheads Pax6+ PH3+ EdU− mitotic cells. D: Arrows indicate Tbr2+ PH3+ EdU+ mitotic cells and the arrowhead a Tbr2+ PH3+ EdU− mitotic cell. E,F: Cumulative EdU labeling of mitotic Pax6+ cells (E) and mitotic Tbr2+ cells (F) in the indicated germinal zones of P1 ferret neocortex. Fitted sigmoidal curves are shown. Dashed lines indicate the half‐maximal labeling time, corresponding to the average duration of G2 (2.0, 2.2, and 2.1 hours for Pax6+ progenitors in VZ, ISVZ, and OSVZ, respectively, and 1.7 hours for Tbr2+ progenitors in ISVZ and OSVZ). G: Quantification of the proportion of the PH3+ cells of each Pax6± & Tbr2± cell subpopulation (see key) within the total PH3+ cells for each of the three germinal zones of the P1 ferret neocortex. Data are mean ± SEM (n = 9). Scale bar = 50 μm in A; 20 μm in B–D.
Figure 5
Figure 5
Cell cycle parameters of P1 ferret neocortical progenitors. A: Average duration of cell cycle phases (G1, yellow; S, purple; G2, white; M, gray) for the indicated progenitor type and germinal zone. B: Proportional contribution of cell cycle phases to total cell cycle for the indicated progenitor type and germinal zone.
Figure 6
Figure 6
PCNA staining of developing ferret neocortex to determine the proportion of progenitors in S‐phase. A: Immunofluorescence for PCNA on 20‐μm coronal cryosections of ferret neocortex at the indicated stages (single 1‐μm optical sections). V, ventricular zone; S, subventricular zone; I, inner subventricular zone; O, outer subventricular zone. B: Right: same PCNA immunofluorescence (yellow) of P1 ferret neocortex as in A, combined with Pax6 (left, blue in merged image on right) and Tbr2 (middle, red in merged image on right) immunofluorescence. C: Higher magnification of the PCNA‐stained regions indicated in A. D: Quantification of the percentage of PCNA nuclei showing punctate staining, indicative of S‐phase, within each Pax6± & Tbr2± progenitor subpopulation (see key) for each of the three germinal zones of ferret neocortex at the indicated developmental stages. Data are mean ± SEM (n = 5 for E20, E32, P1; n = 4 for E24, E28, E36). Color‐coded arrows on the right Y‐axes indicate the percentages of progenitors in S‐phase at P1, as calculated from the cumulative EdU labeling data (Fig. 3C, Table 1). Scale bar = 50 μm in A; 10 μm in C.

References

    1. Arai Y, Pulvers JN, Haffner C, Schilling B, Nusslein I, Calegari F, Huttner WB. 2011. Neural stem and progenitor cells shorten S‐phase on commitment to neuron production. Nat Commun 2:154. - PMC - PubMed
    1. Betizeau M, Cortay V, Patti D, Pfister S, Gautier E, Bellemin‐Ménard A, Afanassieff M, Huissoud C, Douglas RJ, Kennedy H, Dehay C. 2013. Precursor diversity and complexity of lineage relationships in the outer subventricular zone of the primate. Neuron 80:442–457. - PubMed
    1. Borrell V, Calegari F. 2014. Mechanisms of brain evolution: regulation of neural progenitor cell diversity and cell cycle length. Neurosci Res 86:14–24. - PubMed
    1. Borrell V, Reillo I. 2012. Emerging roles of neural stem cells in cerebral cortex development and evolution. Dev Neurobiol 72:955–971. - PubMed
    1. Breunig JJ, Haydar TF, Rakic P. 2011. Neural stem cells: historical perspective and future prospects. Neuron 70:614–625. - PMC - PubMed

Publication types

Substances