. 2015 Jun 2;112(22):E2967-76.
doi: 10.1073/pnas.1506763112. Epub 2015 May 11.

Optimized tools for multicolor stochastic labeling reveal diverse stereotyped cell arrangements in the fly visual system

Affiliations

Optimized tools for multicolor stochastic labeling reveal diverse stereotyped cell arrangements in the fly visual system

Aljoscha Nern et al. Proc Natl Acad Sci U S A. .

Abstract

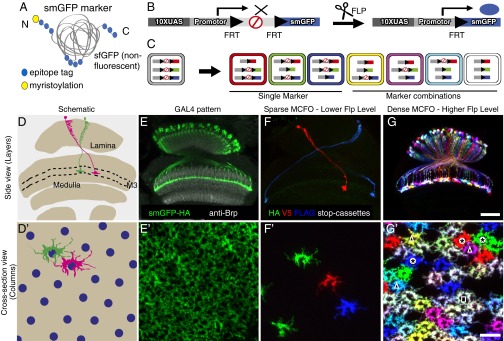
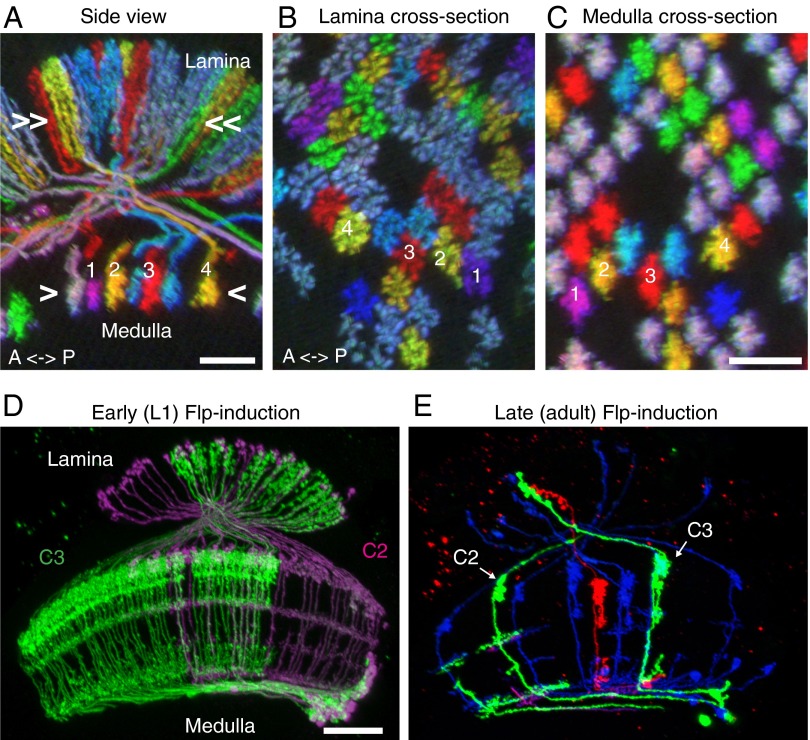
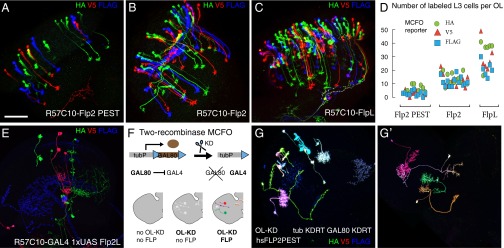
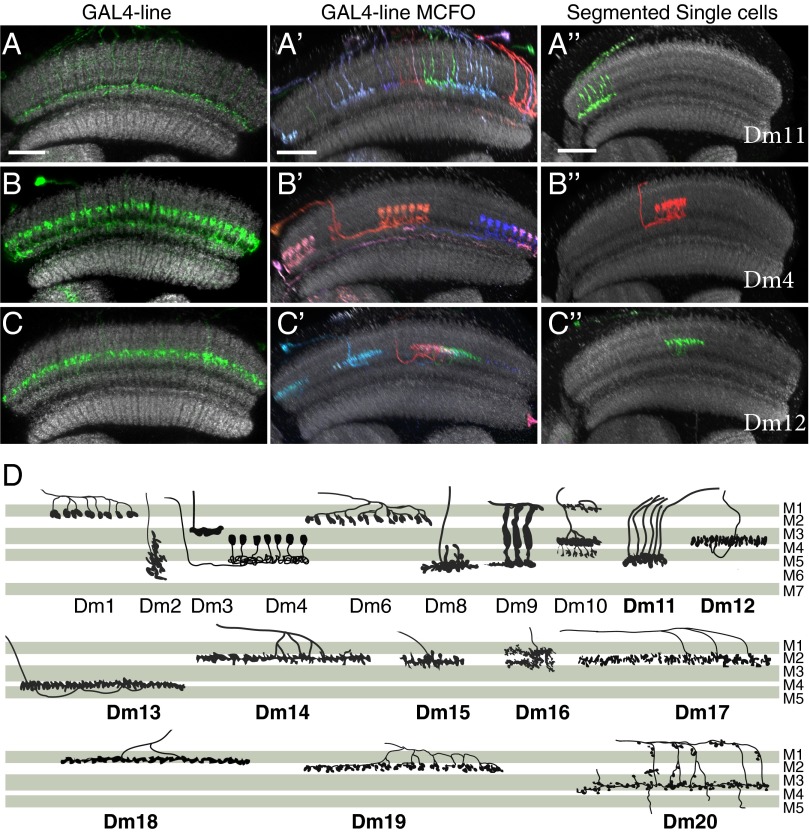
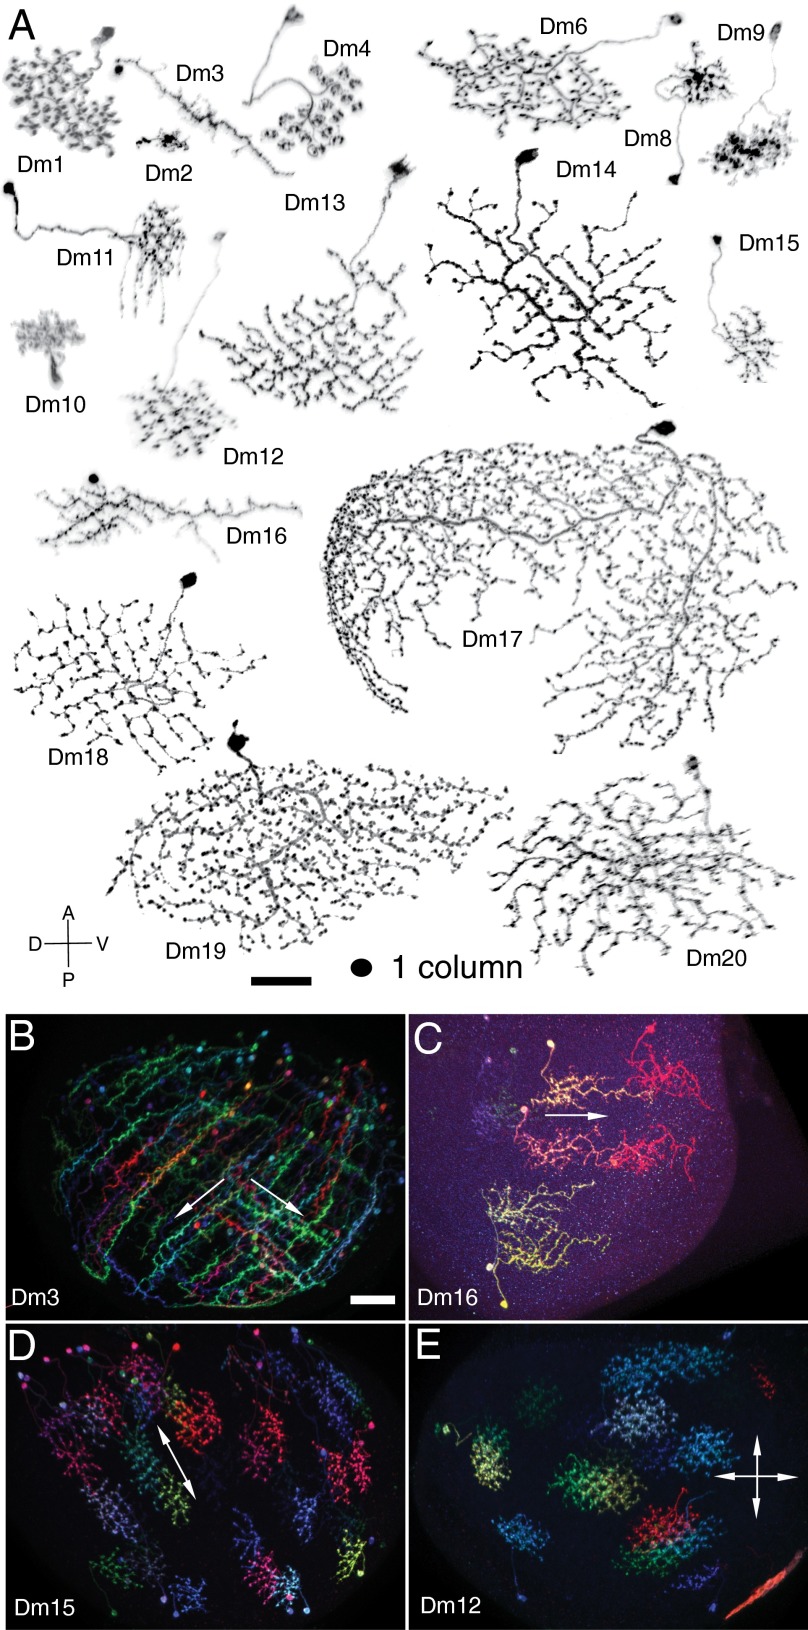
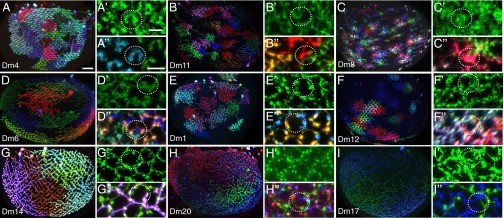
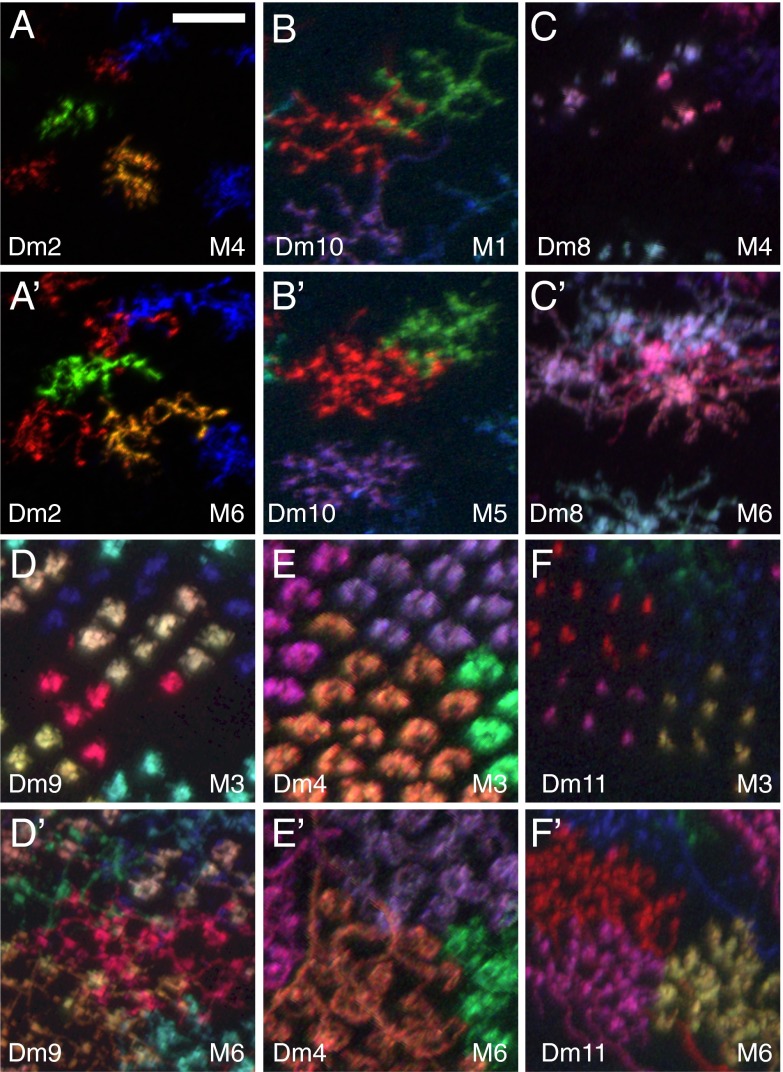
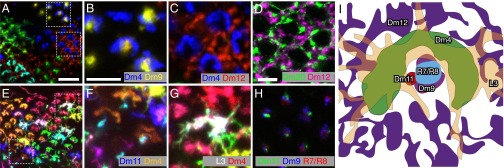
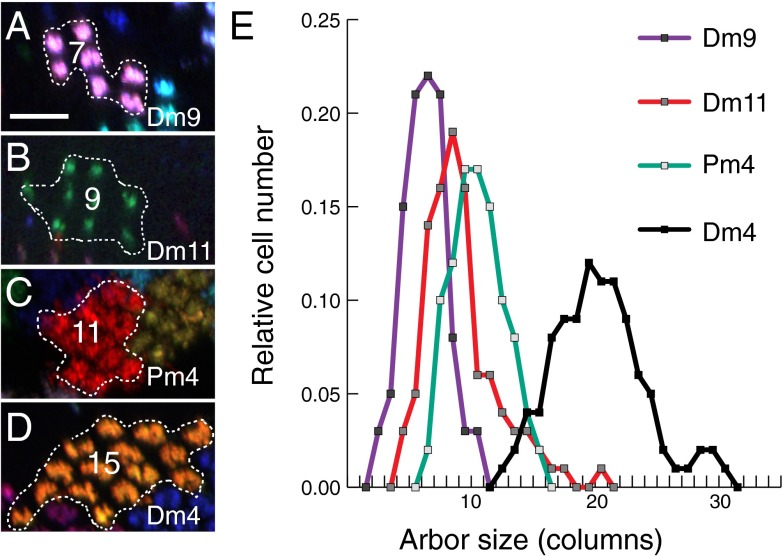
We describe the development and application of methods for high-throughput neuroanatomy in Drosophila using light microscopy. These tools enable efficient multicolor stochastic labeling of neurons at both low and high densities. Expression of multiple membrane-targeted and distinct epitope-tagged proteins is controlled both by a transcriptional driver and by stochastic, recombinase-mediated excision of transcription-terminating cassettes. This MultiColor FlpOut (MCFO) approach can be used to reveal cell shapes and relative cell positions and to track the progeny of precursor cells through development. Using two different recombinases, the number of cells labeled and the number of color combinations observed in those cells can be controlled separately. We demonstrate the utility of MCFO in a detailed study of diversity and variability of Distal medulla (Dm) neurons, multicolumnar local interneurons in the adult visual system. Similar to many brain regions, the medulla has a repetitive columnar structure that supports parallel information processing together with orthogonal layers of cell processes that enable communication between columns. We find that, within a medulla layer, processes of the cells of a given Dm neuron type form distinct patterns that reflect both the morphology of individual cells and the relative positions of their arbors. These stereotyped cell arrangements differ between cell types and can even differ for the processes of the same cell type in different medulla layers. This unexpected diversity of coverage patterns provides multiple independent ways of integrating visual information across the retinotopic columns and implies the existence of multiple developmental mechanisms that generate these distinct patterns.

Keywords: Drosophila; interneuron diversity; light microscopy; neuroanatomy; recombinase.


Conflict of interest statement

The authors declare no conflict of interest.

Figures

Fig. 1.
Fig. 1.
MCFO as a tool for visualization of neurons and neuronal arrangements. (A) Schematic of smGFP markers. Multiple copies of a single epitope tag (HA, FLAG, MYC, V5, or OLLAS; blue circles) are inserted in groups into a backbone of myristoylated (yellow circle) nonfluorescent superfolder GFP (gray). (B) Schematic of an individual MCFO reporter with 10 Upstream Activating Sequences (10XUAS) and a core promoter for GAL4-activated expression, a transcriptional terminator flanked by Flp Recombination Target (FRT) sites, and an smGFP marker. We also made similar constructs for use with the LexA/LexAop2 transcription control system (SI Appendix, Table S1). Flp-recombinase excision of the terminator permits marker expression. Flies with a combination of three stop cassettes were used for the experiments (FG′). (C) Potential marker combinations with three MCFO stop cassettes with different smGFPs: unlabeled (gray), one marker (red, green, blue), or combinations of two (yellow, magenta, cyan) or three (white) labels. Additional intermediate colors are often observed in specimens, possibly due to differences in the timing of the removal of individual terminator cassettes. (DG′) Sparse and dense MCFO labeling of L3 lamina neurons. Side (DG) and cross-section views (D′–G′) show neuropil layers and columns, respectively. Cross-section views are at the level of the L3 terminals in layer M3 (D and D′). (D and D′) Diagram of lamina and medulla (D) or part of medulla layer M3 (D′) with two L3 neurons (of ∼750). Layer M3 (of layers M1–M10; area between dashed lines in D) and the array of photoreceptor neurons (blue circles in D′) are indicated. (E and E′) Overall GAL4 expression (green) with anti-Brp neuropil marker (gray, E). (FG′) MCFO labeling with three stop-cassette reporters with HA, V5, and FLAG smGFPs, respectively. Flp recombinase (pBPhsFlp2::PEST) (SI Appendix) was induced in adult flies by a 12 min (F and F′) or 40 min (G and G′) shift from 25 °C to 37 °C for sparse (F and F′) or dense (G and G′) L3 labeling, respectively. Examples of cells showing the single (asterisks), double (triangles), and triple (square) marker combinations illustrated in C are indicated in G′. [Scale bars: 30 µm (EG) or 10 µm (E′–G′).] For detailed genotypes used for this and other figures, see SI Appendix, Tables S2 and S3.
Fig. 2.
Fig. 2.
Visualization of neuronal arrangements and clonal developmental origins by MCFO. (AC) MCFO for comparing relative positions of neurons in different brain regions. All images are resampled views of the same image stack generated computationally using Vaa3D (44). Side view (A) and cross-section views (B and C) of T1 neurons in lamina (A and B) and medulla (A and C). Relative positions of T1 terminals in the arrays in lamina (B) and medulla (C) are maintained except that axon cross-over in the first optic chiasm inverts positions along the anterior–posterior axis (see numbered cells for examples; only cell 4 can be fully traced between lamina and medulla in the image in A). Approximate levels of the cross-section views shown in B and C are indicated in A. (D and E) MCFO labeling as a tool to reveal common developmental origins. Labeling of C2 and C3 centrifugal medulla-lamina neurons after Flp-recombinase induction in first instar larvae (D) or adult flies (E). The clone labeled in green in D contains >100 C3 but no C2 cells. Both C2 and C3 are present in every medulla column. A split-GAL4 driver line (R20C11-p65ADZp; R48D11-ZpGdbd) that specifically labels both C2 and C3 neurons was used in both D and E. [Scale bars: 10 µm (AC) and 20 µm (D and E).]
Fig. 3.
Fig. 3.
Additional recombinase drivers expand MCFO applications. (AD) Broad expression of Flp variants in mature neurons enables heat-shock–independent MCFO labeling at different densities. (AC) MCFO labeling of L3 neurons with R57C10-driven expression of Flp alleles. Experiments were as in Fig. 1 but no heat shock was applied. Images are maximum-intensity projections that show optic lobes including the lamina in rotated (dorsal more to the right) frontal views. L3 neuron cell bodies and dendrites in the lamina are located in the upper (C) or upper right (A and B) part of the images. L3 axons project to the medulla. (Scale bar: 50 µm.) (D) The number of labeled L3 cells (y axis in graph) was counted for each stop-cassette reporter (HA, V5, or FLAG) in 1- to 5-d-old female flies. Median number of total labeled cells per optic lobe was 10 for Flp2::PEST (n = 11 optic lobes), 38 for Flp2 (n = 13), and 83 for FlpL (n = 6). Labeling density increases with age, as R57C10 continues to be expressed in adult flies. FlpL2 MCFO did not label any cells in these experiments (no labeling; n = 20), suggesting an over 100-fold reduction in activity compared with Flp2::PEST. (EG′) Approaches for sampling single cells from very broad GAL4 patterns. Images in E, G, and G′ show maximum-intensity projections through optic lobes (E and G) or through part of an optic lobe and the adjacent central brain (G′). (E) MCFO with R57C10-GAL4 driving both 1XUAS-FlpL2 and MCFO reporter expression. (F, G, and G′) Combined use of multiple recombinases for sparse labeling of optic lobe neurons. (F) Schematic. Ubiquitous expression (tubulin promoter, tubP) of GAL80 suppresses activity of broadly expressed (R57C10) GAL4. KD-recombinase (expressed in the developing optic lobe, OL-KD) drives excision of the GAL80 transgene via flanking KD-recombinase Target Recognition (KDRT) sites. In cells without GAL80, GAL4 becomes active; these cells (shown as white cells in OL-KD, no FLP diagram) can be labeled by MCFO, here induced with pBPhsFlp2::PEST. (G and G′) Two examples of two-recombinase MCFO labeling as described in F. Note that both patterns are sparse but consist of neurons labeled in a much broader range of colors than those in E.
Fig. 4.
Fig. 4.
Characterization of local interneurons in the outer medulla using MCFO. (AC′′) Overall medulla pattern (AC) and MCFO (A′, B′, and C′) labeling of selected GAL4 lines and examples of segmented single cells (SI Appendix) from sparse MCFO labeling of R57C10 (A′′–C′′) for three Dm cell types (Dm11, AA′′; Dm4, BB′′; Dm12, CC′′). Anti-Brp reference pattern (45) is in gray. Images in A′–C′′ are reoriented substack projections. (Scale bars: 20 µm.) (D) Schematics showing the layer patterns of all Dm cell types examined in this study. Cell types were initially classified based primarily on layer innervation; for some cell populations with similar or overlapping layer position, we also carried out double-labeling experiments using LexA and GAL4 lines (SI Appendix, Fig. S5) to directly confirm their distinct identity and relative layer positions. All cells are shown in the same orientation (anterior left) and scale. The names of cell types not described in previous Golgi or EM studies are in boldface type. Dm neurons show diverse, cell-type–specific patterns that in combination included all layers of the outer medulla. The most similar layer positions were observed for a group of seven cell types with monostratified arbors in layer M2 or the adjacent proximal part of layer M1. These cell types (Dm1, Dm14, Dm15, Dm17, Dm18, and Dm19) with identical or near identical layer positions can be distinguished by other properties such as arbor size and shape, cell body distribution, or intracolumnar arbor position (SI Appendix, Table S4).
Fig. 5.
Fig. 5.
Diversity of arbor size, shape, and polarity. (A) Images of Dm cells segmented from MCFO images and reoriented to show cross-section view. Cells are shown in the same orientation (anterior up, dorsal left; approximate axes are indicated) and scale. Approximate size of “1 column” is indicated. (BE) Stereotypy of arbor orientation and polarity. Reoriented views of the entire medulla with MCFO labeling of several cells of a type are shown for Dm3 (B), Dm16 (C), Dm15 (D), and Dm12 (E). For GAL4 lines used, see SI Appendix, Table S3. (Scale bars: 20 µm.)
Fig. 6.
Fig. 6.
Diversity of arbor arrangements of local interneurons in the medulla. Distribution of MCFO-labeled cells over the entire medulla (AI). Cross-section views of the full GAL4 line pattern in a few columns (A′–I′) showed distinct patterns for each cell type; however, these patterns were not sufficient to predict the arrangement of individual cells. MCFO-labeled cells in a few columns of each cell type (A′′–I′′). White dashed circles indicate the approximate size of a medulla column. Cell types are indicated. Reoriented substack projections are shown. [Scale bars: 20 µm (AI) and 5 μm (the scale bar in A′ applies to all single prime panels and that in A′′ to all double prime panels).]
Fig. 7.
Fig. 7.
Position and distribution of processes of multistratified neurons in different layers. Cross-section views (reoriented substack projections) of MCFO-labeled processes are shown. Approximate layer positions are indicated in each panel. For each cell type, views of the same group of cells in two different layers are shown. Top panels (AF) show a more distal layer position than lower panels (A′–F′). Dorsal is to the right in A and A′. (Scale bar: 10 µm.)
Fig. 8.
Fig. 8.
Precise intracolumnar positions of arbors of multicolumnar cells. (AG) Relative positions of neurons of different cell types in medulla layer M3 revealed by MCFO or LexA/Gal4 double labeling. (AC) Combined MCFO labeling of Dm4, Dm9, and Dm12 in the M3 layer. (B and C) Detailed views of Dm4/Dm9 (B) and Dm4/Dm12 (C). (EG) MCFO of Dm4, L3, and Dm11. (F) Dm4 and Dm11. (G) L3 and Dm4. (D and H) LexA/Gal4 double labeling. (D) Dm20 (green) and Dm12 (magenta). (H) Dm11 (green), Dm9 (blue), and R7/R8 (red). R7 and R8 cells were labeled with mAb24B10. (I) Schematic diagram of column positions of cell types; several other cell types, not included in this diagram, are also present in M3. [Scale bars: 10 µm (A and E) and 5 µm (BD and FH).]
Fig. 9.
Fig. 9.
Arbor sizes of individual cells are variable but follow cell-type–specific distributions. (AD) Outline of a cell with indicated column count for Dm9 (A), Dm11 (B), Pm4 (C), and Dm4 (D). Cross-section views of layers M3 (A, B, and D) and M9 (C) are shown. (Scale bar: 10 µm.) (E) Distribution of arbor sizes determined as illustrated in AD. Median column coverage was 21 for Dm4 (n = 311 cells), 11 for Pm4 (n = 441), 9 for Dm11 (n = 277), and 7 for Dm9 (n = 224). We estimated the total number of cells of each type from these data by dividing the size of the medulla array (∼750 columns) by the average column spread; these estimates (Dm4, 36; Pm4, 67; Dm11, 78; and Dm9, 110) were similar to average cell body counts from GAL4 line images (Dm4, ∼40; Pm4, ∼60; Dm11, ∼70; and Dm9, ∼110).

References

    1. Sanes JR, Zipursky SL. Design principles of insect and vertebrate visual systems. Neuron. 2010;66(1):15–36. - PMC - PubMed
    1. Masland RH. Neuronal diversity in the retina. Curr Opin Neurobiol. 2001;11(4):431–436. - PubMed
    1. Fischbach KF, Dittrich APM. The optic lobe of Drosophila melanogaster. 1. A Golgi analysis of wild-type structure. Cell Tissue Res. 1989;258(3):441–475.
    1. Grueber WB, Jan LY, Jan YN. Tiling of the Drosophila epidermis by multidendritic sensory neurons. Development. 2002;129(12):2867–2878. - PubMed
    1. Strausfeld NJ. Golgi studies on insects. 2. Optic lobes of Diptera. Philos T Roy Soc B. 1970;258(820):135. - PubMed

LinkOut - more resources