

A Human Thrifty Phenotype Associated With Less Weight Loss During Caloric Restriction
- PMID: 25964395
- PMCID: PMC4512223
- DOI: 10.2337/db14-1881
A Human Thrifty Phenotype Associated With Less Weight Loss During Caloric Restriction
Abstract
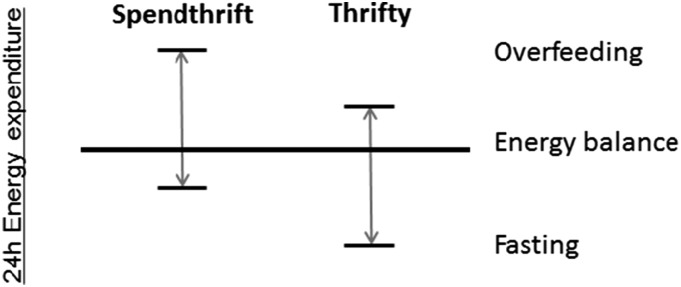
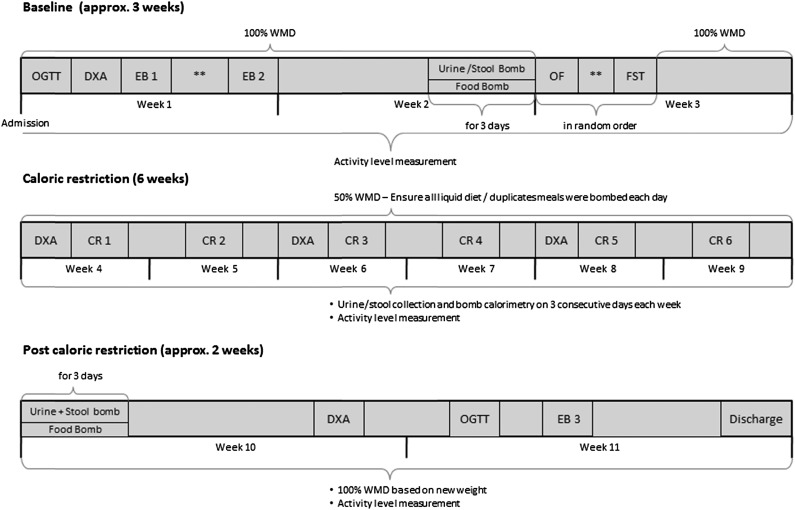
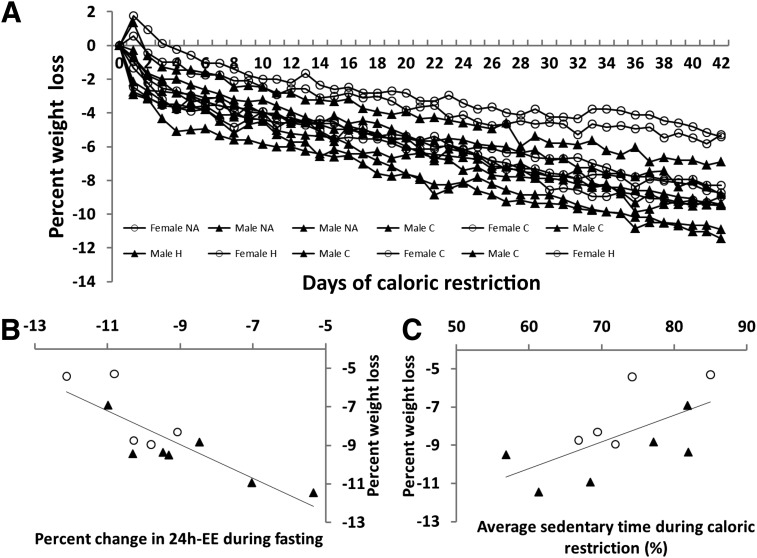
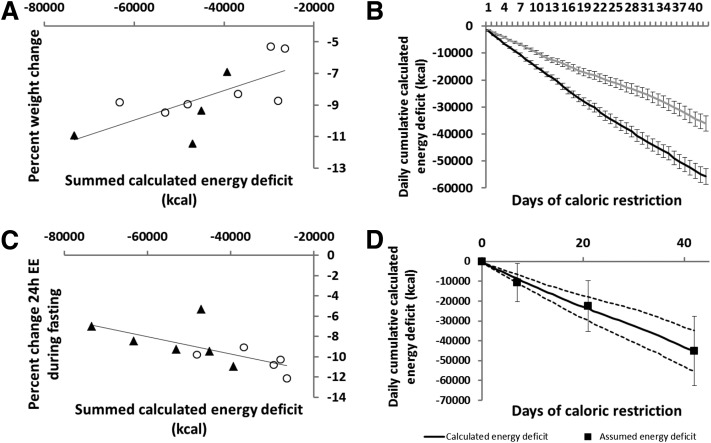
Successful weight loss is variable for reasons not fully elucidated. Whether effective weight loss results from smaller reductions in energy expenditure during caloric restriction is not known. We analyzed whether obese individuals with a "thrifty" phenotype, that is, greater reductions in 24-h energy expenditure during fasting and smaller increases with overfeeding, lose less weight during caloric restriction than those with a "spendthrift" phenotype. During a weight-maintaining period, 24-h energy expenditure responses to fasting and 200% overfeeding were measured in a whole-room indirect calorimeter. Volunteers then underwent 6 weeks of 50% caloric restriction. We calculated the daily energy deficit (kilocalories per day) during caloric restriction, incorporating energy intake and waste, energy expenditure, and daily activity. We found that a smaller reduction in 24-h energy expenditure during fasting and a larger response to overfeeding predicted more weight loss over 6 weeks, even after accounting for age, sex, race, and baseline weight, as well as a greater rate of energy deficit accumulation. The success of dietary weight loss efforts is influenced by the energy expenditure response to caloric restriction. Greater decreases in energy expenditure during caloric restriction predict less weight loss, indicating the presence of thrifty and spendthrift phenotypes in obese humans.
Trial registration: ClinicalTrials.gov NCT00687115.
© 2015 by the American Diabetes Association. Readers may use this article as long as the work is properly cited, the use is educational and not for profit, and the work is not altered.
Figures
Comment in
-
Acute Adaptation of Energy Expenditure Predicts Diet-Induced Weight Loss: Revisiting the Thrifty Phenotype.Diabetes. 2015 Aug;64(8):2714-6. doi: 10.2337/db15-0553. Diabetes. 2015. PMID: 26207037 No abstract available.
References
-
- Bogardus C, Lillioja S, Ravussin E, et al. . Familial dependence of the resting metabolic rate. N Engl J Med 1986;315:96–100 - PubMed
-
- Ravussin E, Lillioja S, Knowler WC, et al. . Reduced rate of energy expenditure as a risk factor for body-weight gain. N Engl J Med 1988;318:467–472 - PubMed
-
- Ravussin E, Gautier JF. Metabolic predictors of weight gain. Int J Obes Relat Metab Disord 1999;23(Suppl. 1):37–41 - PubMed
-
- Leibel RL, Rosenbaum M, Hirsch J. Changes in energy expenditure resulting from altered body weight. N Engl J Med 1995;332:621–628 - PubMed
MeSH terms
Associated data
LinkOut - more resources
Full Text Sources
Other Literature Sources
Medical
