. 2015 May 12:4:e06498.
doi: 10.7554/eLife.06498.

A distinct p53 target gene set predicts for response to the selective p53-HDM2 inhibitor NVP-CGM097

Affiliations

A distinct p53 target gene set predicts for response to the selective p53-HDM2 inhibitor NVP-CGM097

Sébastien Jeay et al. Elife. .

Erratum in

Abstract

Biomarkers for patient selection are essential for the successful and rapid development of emerging targeted anti-cancer therapeutics. In this study, we report the discovery of a novel patient selection strategy for the p53-HDM2 inhibitor NVP-CGM097, currently under evaluation in clinical trials. By intersecting high-throughput cell line sensitivity data with genomic data, we have identified a gene expression signature consisting of 13 up-regulated genes that predicts for sensitivity to NVP-CGM097 in both cell lines and in patient-derived tumor xenograft models. Interestingly, these 13 genes are known p53 downstream target genes, suggesting that the identified gene signature reflects the presence of at least a partially activated p53 pathway in NVP-CGM097-sensitive tumors. Together, our findings provide evidence for the use of this newly identified predictive gene signature to refine the selection of patients with wild-type p53 tumors and increase the likelihood of response to treatment with p53-HDM2 inhibitors, such as NVP-CGM097.

Keywords: HDM2; human; human biology; medicine; p53; predictive signature; translational oncology.


Conflict of interest statement

SJ: Employee of Novartis Institutes for BioMedical Research.

SG: Employee of Novartis Institutes for BioMedical Research.

SF: Employee of Novartis Institutes for BioMedical Research.

HB: Employee of Novartis Institutes for BioMedical Research.

MI: Employee of Novartis Institutes for BioMedical Research.

TV: Employee of Novartis Institutes for BioMedical Research.

MM: Employee of Novartis Institutes for BioMedical Research.

SR: Employee of Novartis Institutes for BioMedical Research.

DAG: Employee of Novartis Institutes for BioMedical Research.

CR: Employee of Novartis Institutes for BioMedical Research.

MRJ: Employee of Novartis Institutes for BioMedical Research.

MW: Employee of Novartis Institutes for BioMedical Research.

JK: Employee of Novartis Institutes for BioMedical Research.

PF: Employee of Novartis Institutes for BioMedical Research.

FG: Employee of Novartis Institutes for BioMedical Research.

PH: Employee of Novartis Institutes for BioMedical Research.

KM: Employee of Novartis Institutes for BioMedical Research.

JW: Employee of Novartis Institutes for BioMedical Research.

EH: Employee of Novartis Institutes for BioMedical Research.

FH: Employee of Novartis Institutes for BioMedical Research.

WRS: Was an employee of Novartis Institutes for BioMedical Research and is now an employee of Peptidream Inc. and has ownership interest (including patents) in Peptidream Inc.

DGP: Employee of Novartis Institutes for BioMedical Research. Holds the position of VP/Global Head of Oncology in Novartis Institutes for BioMedical Research and has ownership interest (including patents) in Novartis Pharmaceuticals.

Figures
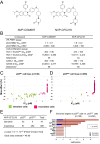
Figure 1.
Figure 1.. TP53 wild-type status is necessary but not sufficient to predict sensitivity to NVP-CGM097 and NVP-CFC218.
(A) Chemical structure of NVP-CGM097 and NVP-CFC218. (B) In vitro activity of NVP-CFC218 and NVP-CGM097 in TR-FRET binding assay (a) and cellular proliferation assay in human cancer cell lines (b). Data are expressed as concentration causing 50% inhibition and shown as mean ± SD from multiple (n ≥ 8) independent experiments. (c) Selectivity is determined by the ratio of GI50 obtained using the HCT-116 p53-null and the HCT-116 p53WT isogenic pair of cell lines. (d) Selectivity is determined by the ratio of GI50 obtained using SAOS-2 (p53-null) and SJSA-1 (p53WT and HDM2-amplified) osteosarcoma pair of cell lines. (C and D) Scatter plot showing IC50 values expressed in μM of NVP-CFC218 in cell viability assays of p53 wild-type cell lines (C) and p53 mutated cell lines (D), colored by their response to NVP-CFC218. The data used to generate these plots, as well as cell line identity is available in Figure 1—source data 1. (E) Contingency table indicating the total number of sensitive and insensitive cell lines to NVP-CFC218. The p-value of 5.1 × 10⁻²³ shows a significant association between sensitivity to NVP-CFC218 and TP53 wild-type status. (F) Main enriched compound target p-values from the Global Compound Selectivity Analysis. p-values are minus log10 transformed. The red color refers to compounds that are more selective in the wild-type p53 (p53WT) strata than in the mutated p53 (p53MUT) strata. The blue color indicates the reverse profile. Brighter colors indicate which target classes pass the 0.25 FDR cut-off. The length of each red/blue segment corresponds to the proportion of p53WT selective/p53MUT selective compounds in each target class. DOI: http://dx.doi.org/10.7554/eLife.06498.003
Figure 2.
Figure 2.. Predictive modeling of NVP-CFC218 chemical sensitivity from CCLE expression data.
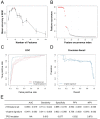
(A) Prediction accuracy estimation by bootstrapping analysis upon increasing feature set size. Estimates are averaged over 20 bootstrapping repeats. The maximum accuracy is observed for 17 features (red dot). Sensitivity and specificity are shown in Figure 2—figure supplement 1. The averaged data used to generate the accuracy, sensitivity and specificity plots is available in Figure 2—source data 1. (B) Feature occurrence frequencies of 13 feature selections in 100 bootstrapping repeats. Fifty five features were selected at least once. The 13 most frequently occurring features (red dots) were selected more than 30 times. (C) ROC curves for the three predictive models under comparison, i.e., the p53 mutation status, the 215-feature and the 13-gene signature models. (D) Precision-Recall plot for the 13-gene signature. Five curves are typically shown since cross-validation was repeated five times. (E) Performance estimates of the three compared predictive models: AUC (Area Under the Curve, from the ROC curve shown in C), Sensitivity (fraction of correctly predicted sensitive cell lines), Specificity (fraction of correctly predicted insensitive cell lines), PPV (positive predicted value, fraction of sensitive cell lines predicted as such), and NPV (negative predictive value, fraction of insensitive cell lines predicted as such). Measures are averaged over the 5 iterations of 5-fold cross-validations. DOI: http://dx.doi.org/10.7554/eLife.06498.005
Figure 2—figure supplement 1.
Figure 2—figure supplement 1.. Prediction performance estimation by bootstrapping analysis upon increasing feature set size.
Estimates are averaged over 20 bootstrapping repeats. Maximum sensitivity is observed for 13 features (sensitivity plot, red dot). Maximum specificity is observed for 17 features (specificity plot, red dot). DOI: http://dx.doi.org/10.7554/eLife.06498.007
Figure 2—figure supplement 2.
Figure 2—figure supplement 2.. Prediction performance of NVP-CFC218 in p53WT CCLE cell lines.
The measures of prediction accuracy are calculated restricted to the wild-type TP53 subset of CCLE cell lines (n=68). (A) ROC curves for the 215-feature set and the 13-gene signature predictive models. (B) Precision-Recall plot for the 13-gene signature. Five curves are typically shown since cross-validation was repeated 5 times. (C) Performance estimates of the 13-gene signature and TP53 mutation status as predictive models. DOI: http://dx.doi.org/10.7554/eLife.06498.008
Figure 3.
Figure 3.. Validation of the predictive 13-gene signature in an external set of cell lines.
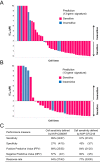
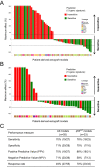
A total of 52 or 38 cell lines were tested against NVP-CGM097 (A) or NVP-CFC218 (B), respectively, in a 3-day proliferation assay. Sensitivity call for each compound was applied according to a cut-off of 3 µM. Cells that were predicted as sensitive are shown in pink, while the ones predicted as insensitive are shown in blue. The data used to generate the waterfall plots and cell line details are available in Figure 3—source data 1. Performance values of the 13-gene signature were derived from this experiment, and are shown in (C). DOI: http://dx.doi.org/10.7554/eLife.06498.010
Figure 3—figure supplement 1.
Figure 3—figure supplement 1.. Validation of the predictive 13-gene signature in p53WT cell lines.
The same visualization as in Figure 3 is shown restricted to the wild-type p53 cell lines. A total of 42 or 30 p53WT cell lines were tested against NVP-CGM097 (A) or NVP-CFC218 (B), respectively, in a 3-day proliferation assay. The data used to generate the waterfall plots and cell line details are available in Figure 3—source data 1. Performance values of the 13-gene signature were derived from this experiment, and are shown in (C). DOI: http://dx.doi.org/10.7554/eLife.06498.012
Figure 4.
Figure 4.. Prevalence of the 13-gene signature in human primary tumors and patient-derived tumor xenograft models.
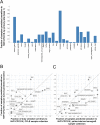
(A) Fraction of human primary tumors predicted sensitive by the 13-gene signature. Samples are grouped by primary site. Expression data from 21,300 human primary tumors were compiled and only primary sites consisting of more than 50 samples were included in the analysis. The primary site nomenclature is based on the COSMIC Classification System. (B) Correlation between the fraction of human primary tumor samples predicted sensitive and the observed sensitivity ratio in the CCLE cell line data. (C) Correlation between the sensitivity predictions from the human primary tumor sample collection and the patient-derived tumor xenograft model collection. Human primary tumor samples, patient-derived tumor xenografts, and CCLE cell lines are organized by lineage. The dashed line corresponds to the identity line. DOI: http://dx.doi.org/10.7554/eLife.06498.013
Figure 5.
Figure 5.. Activity of NVP-CGM097 in SJSA-1 tumor-bearing mice.
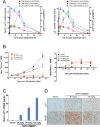
(A) PK/PD relationship. Mice (n = 3/time-point) bearing established subcutaneous SJSA-1 xenografts received vehicle or a single oral dose of 100 mg/kg NVP-CGM097. Levels of NVP-CGM097 were measured in plasma and in tumor at 7 different time-points within 48 hr following the dose. As a pharmacodynamic readout, the p53 target gene p21 mRNA (left panel) and protein (right panel) levels were assessed in the tumor samples by qRT-PCR and reverse phase protein array at 7 time-points within 48 hr following NVP-CGM097 single dose. Data are plotted as mean ± SEM. (B) In vivo anti-tumor activity of NVP-CGM097. Mice (n = 6/dosing group) bearing established subcutaneous SJSA-1 xenografts received vehicle or 25, 50, or 100 mg/kg of an oral suspension of NVP-CGM097 daily. Tumor volumes were calipered throughout the study, and data are plotted as mean ± SEM (left panel). The body-weight (BW) is expressed as the percentage change in BW relative to day 0 (initiation of treatment). Data are plotted as mean ± SEM (right panel). *, p < 0.05 vs vehicle control. (C and D) Tumor pharmacodynamics effects of NVP-CGM097. Tumor samples were retrieved 3 hr post-last dose at the end of the efficacy study described in (B). Tumor p21 mRNA levels were assessed by qRT-PCR and data are plotted as mean ± SEM (C). Tumor samples were retrieved and paraffin-embedded 3 hr post-last dose at the end of the efficacy experiment described in (B). p21 and HDM2 protein levels were assessed by immunohistochemistry (D). DOI: http://dx.doi.org/10.7554/eLife.06498.015
Figure 6.
Figure 6.. Validation of the predictive 13-gene signature in patient-derived tumor xenografts (PDX).
PDX models were established by subcutaneous implantation in nude mice of surgical tumor tissues from treatment-naive cancer patients. 55 PDX models of multiple cancer types were used for the study: melanoma (n = 19), colorectal cancer (n = 17), liposarcoma (n = 3), renal cell carcinoma (n = 3), hepatocellular carcinoma (n = 7), breast cancer (n = 1), pancreatic cancer (n = 2), and lung cancer (n = 3). Tumor-bearing mice (n = 4/dosing group/model) received vehicle or 100 mg/kg of NVP-CGM097 daily for 4 weeks. The response is reported as percentage change in tumor volume at a given day of treatment relative to day 0 (start of treatment). The cut-off used for sensitivity to NVP-CGM097 was based on RECIST adapted for full tumor volume measurement. The sensitivity call was made at the maximum effect time-point during the treatment period. Sensitivity predictions for each PDX model were generated using the 13-gene signature (Figure 6—source data 2). (A) Waterfall plot showing the tumor response to NVP-CGM097 for all the PDX models in the study (n = 55), color-coded by the prediction output. (B) The same visualization as in (A) is shown restricted to the wild-type p53 PDX models (n = 33). The data used to generate the waterfall plots and PDX model details are available in Figure 6—source data 1. Performance values of the 13-gene signature were derived from this experiment and are shown in (C). DOI: http://dx.doi.org/10.7554/eLife.06498.016
Author response image 1.
DOI: http://dx.doi.org/10.7554/eLife.06498.019

Comment in

  • A signature for success.
    Espinosa JM, Sullivan KD. Espinosa JM, et al. Elife. 2015 Jun 16;4:e08773. doi: 10.7554/eLife.08773. Elife. 2015. PMID: 26079875 Free PMC article.

References

    1. Adimoolam S, Ford JM. p53 and DNA damage-inducible expression of the xeroderma pigmentosum group C gene. Proceedings of the National Academy of Sciences. 2002;99:12985–12990. doi: 10.1073/pnas.202485699. - DOI - PMC - PubMed
    1. Allen MA, Andrysik Z, Dengler VL, Mellert HS, Guarnieri A, Freeman JA, Sullivan KD, Galbraith MD, Luo X, Kraus WL, Dowell RD, Espinosa JM. Global analysis of p53-regulated transcription identifies its direct targets and unexpected regulatory mechanisms. eLife. 2014;3:e02200. doi: 10.7554/eLife.02200. - DOI - PMC - PubMed
    1. Anderson SJ, Lauritsen JP, Hartman MG, Foushee AM, Lefebvre JM, Shinton SA, Gerhardt B, Hardy RR, Oravecz T, Wiest DL. Ablation of ribosomal protein L22 selectively impairs alphabeta T cell development by activation of a p53-dependent checkpoint. Immunity. 2007;26:759–772. doi: 10.1016/j.immuni.2007.04.012. - DOI - PubMed
    1. Barak Y, Juven T, Haffner R, Oren M. mdm2 expression is induced by wild type p53 activity. The EMBO Journal. 1993;12:461–468. - PMC - PubMed
    1. Barretina J, Caponigro G, Stransky N, Venkatesan K, Margolin AA, Kim S, Wilson CJ, Lehár J, Kryukov GV, Sonkin D, Reddy A, Liu M, Murray L, Berger MF, Monahan JE, Morais P, Meltzer J, Korejwa A, Jané-Valbuena J, Mapa FA, Thibault J, Bric-Furlong E, Raman P, Shipway A, Engels IH, Cheng J, Yu GK, Yu J, Aspesi P, de Silva M, Jagtap K, Jones MD, Wang L, Hatton C, Palescandolo E, Gupta S, Mahan S, Sougnez C, Onofrio RC, Liefeld T, MacConaill L, Winckler W, Reich M, Li N, Mesirov JP, Gabriel SB, Getz G, Ardlie K, Chan V, Myer VE, Weber BL, Porter J, Warmuth M, Finan P, Harris JL, Meyerson M, Golub TR, Morrissey MP, Sellers WR, Schlegel R, Garraway LA, Aspesi P. The Cancer Cell Line Encyclopedia enables predictive modelling of anticancer drug sensitivity. Nature. 2012;483:603–607. doi: 10.1038/nature11003. - DOI - PMC - PubMed

Publication types

MeSH terms