. 2015 May 12;10(5):e0125419.
doi: 10.1371/journal.pone.0125419. eCollection 2015.

Hepatitis C Virus NS3 Mediated Microglial Inflammation via TLR2/TLR6 MyD88/NF-κB Pathway and Toll Like Receptor Ligand Treatment Furnished Immune Tolerance

Affiliations

Hepatitis C Virus NS3 Mediated Microglial Inflammation via TLR2/TLR6 MyD88/NF-κB Pathway and Toll Like Receptor Ligand Treatment Furnished Immune Tolerance

Ayilam Ramachandran Rajalakshmy et al. PLoS One. .

Abstract

Background: Recent evidence suggests the neurotrophic potential of hepatitis C virus (HCV). HCV NS3 protein is one of the potent antigens of this virus mediating inflammatory response in different cell types. Microglia being the immune surveillance cells in the central nervous system (CNS), the inflammatory potential of NS3 on microglia was studied. Role of toll like receptor (TLR) ligands Pam2CSK3 and Pam3CSK4 in controlling the NS3 mediated microglial inflammation was studied using microglial cell line CHME3.

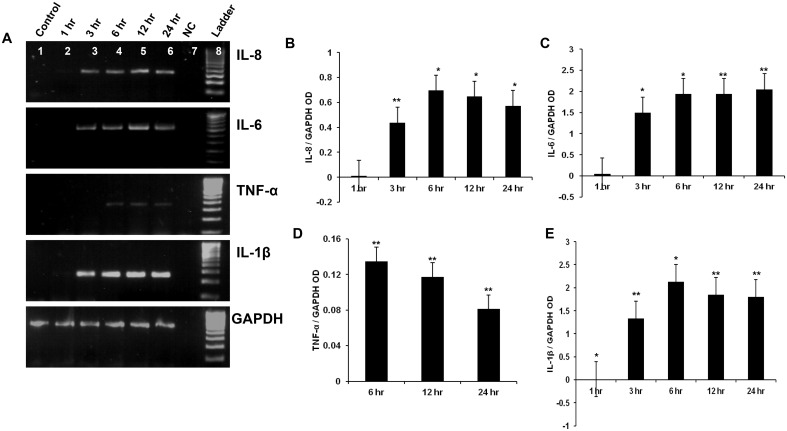
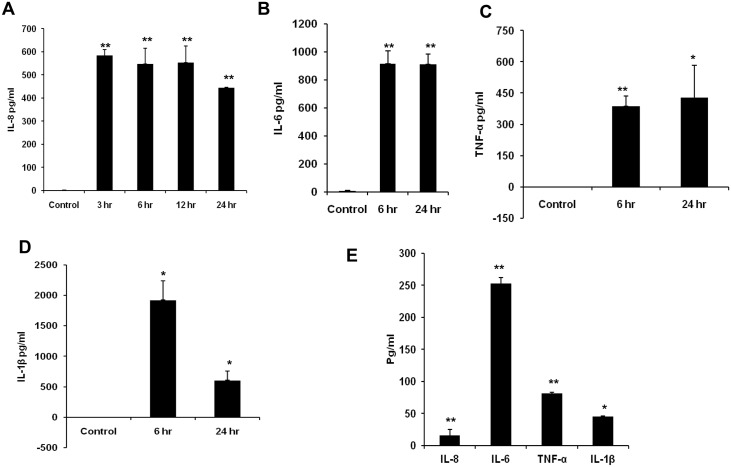
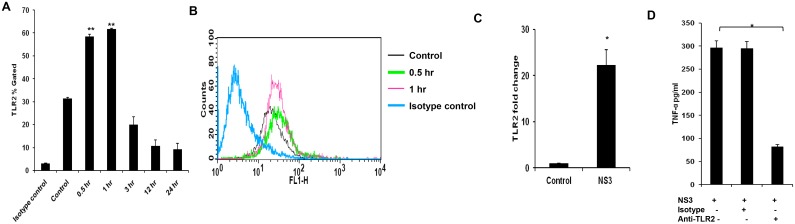
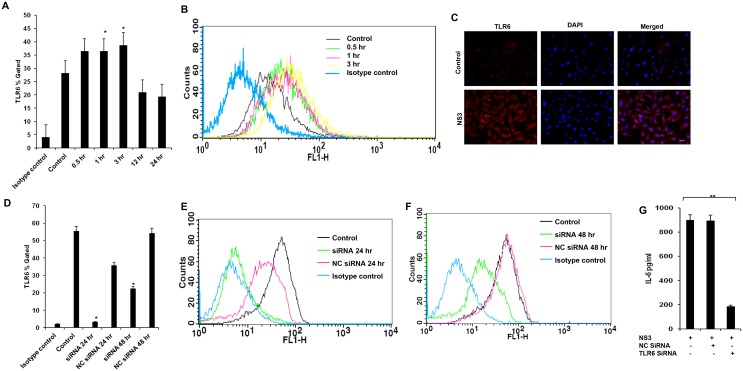
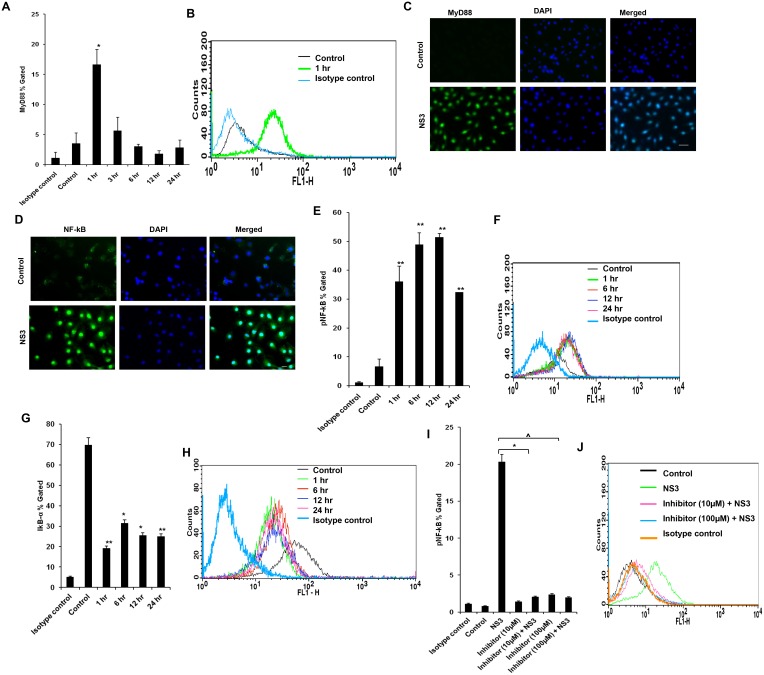
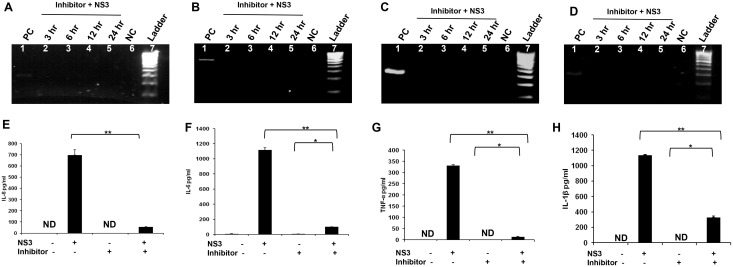
Methods: IL (Interleukin)-8, IL-6, TNF-α (Tumor nicrosis factor alpha) and IL-1β gene expressions were measured by semi quantitative RT-PCR (reverse transcription-PCR). ELISA was performed to detect IL-8, IL-6, TNF-α, IL-1β and IL-10 secretion. FACS (Flourescent activated cell sorting) was performed to quantify TLR1, TLR2, TLR6, MyD88 (Myeloid differntiation factor 88), IkB-α (I kappaB alpha) and pNF-κB (phosphorylated nuclear factor kappaB) expression. Immunofluorescence staining was performed for MyD88, TLR6 and NF-κB (Nuclear factor kappaB). Student's t-test or One way analysis of variance with Bonferoni post hoc test was performed and p < 0.05 was considered significant.

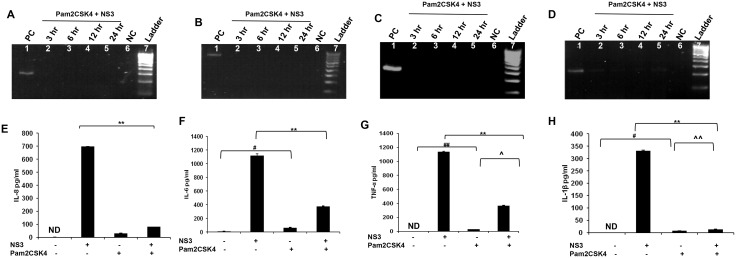
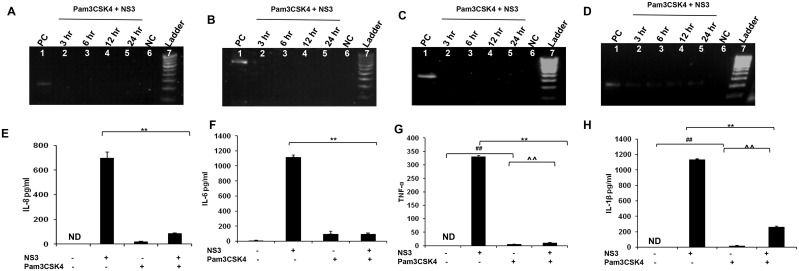
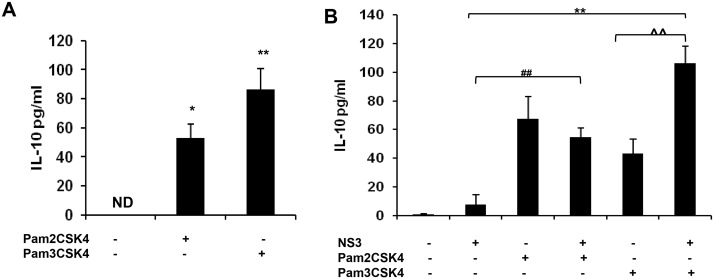
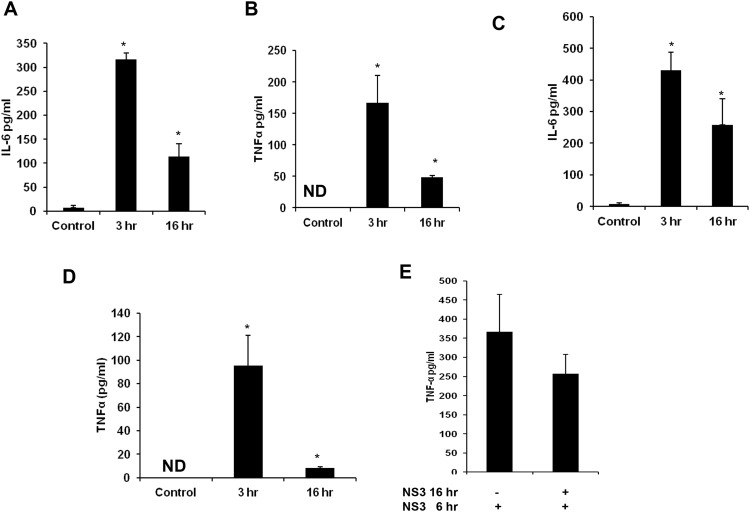
Results: Microglia responded to NS3 by secreting IL-8, IL-6, TNF-α and IL-1β via TLR2 or TLR6 mediated MyD88/NF-κB pathway. Transcription factor NF-κB was involved in activating the cytokine gene expression and the resultant inflammatory response was controlled by NF-κB inhibitor, Ro106-9920, which is known to down regulate pro-inflammatory cytokine secretion. Activation of the microglia by TLR agonists Pam3CSK4 and Pam2CSK4 induced immune tolerance against NS3. TLR ligand treatment significantly down regulated pro-inflammatory cytokine secretion in the microglia. IL-10 secretion was suggested as the possible mechanism by which TLR agonists induced immune tolerance. NS3 as such was not capable of self-inducing immune tolerance in microglia.

Conclusion: In conclusion, NS3 protein was capable of activating microglia and the inflammatory response could be controlled via blocking the transcription factor NF-κB, or by treating the microglia with TLR ligands which likely function via secreting anti-inflammatory cytokines such as IL-10. This can have therapeutic potential in controlling HCV mediated neuroinflammation.


Conflict of interest statement

Competing Interests: The authors have declared that no competing interests exist.

Figures

Fig 1
Fig 1. HCV NS3 induced pro inflammatory cytokine gene expression in microglia.
CHME3 cells were exposed to 20 ng/ml of HCV NS3 for different time points and RT-PCR was performed to detect the cytokine gene expression at various time points. (A) IL-8, IL-6, TNF-α, IL-1β mRNA was expressed in the microglial cells exposed to NS3. The gel OD values were measured by image J and were expressed as cytokine OD values normalized to that of the corresponding GAPDH. (B-D) Microglia expressed IL-8 mRNA from 3 hr to 24 hr, (C) IL-6 mRNA was expressed from 3 hr to 24 hr, (D) TNF-α was expressed from 6 hr to 24 hr and (D) IL-1β was expressed from 3 hr to 24 hr. Lanes 1–8 represents control, NS3 treated cells at 1 hr, 3 hr, 6 hr, 12 hr, 24 hr, negative control (NC), 100 bp ladder in that order. The data is expressed as mean (n = 3) ± SE, * p < 0.05, ** p < 0.01.
Fig 2
Fig 2. HCV NS3 induced pro inflammatory cytokine secretion by microglia.
CHME3 cells were exposed to 20 ng/ml of NS3 for different time points and cell culture supernatant was collected for pro inflammatory cytokine ELISA. (A) IL-8 secretion was detected from 3 hr to 24 hr, (B, C, D) IL-6, TNF-α and IL-1βwas detected at 6 and 24 hr time points. The cells were exposed to 2 ng/ml of NS3 for 6 hrs and ELISA was performed for cytokines. (E) The cells secreted significant amount of IL-8, IL-6, TNF-α and IL-1β. The data is expressed as mean (n = 3) ± SE, * p < 0.05, ** p < 0.01.
Fig 3
Fig 3. HCV NS3 mediated immune response via TLR2 CHME3 cells were exposed to 20 ng/ml of NS3 for different time points, cells were stained with TLR2 specific antibodies
. Flow cytometry and immunofluorescence staining was performed to detect the cellular expression of the protein. Real time PCR was performed to detect TLR2 gene exxpression. (A-B) TLR2 expression was up regulated from 0.5 hr to 3 hr. (C) TLR2 transcripts were up regulated at 0.5 hr. ((D) anti-TLR2 treatment down regulated the TNF-α secretion and the isotype control had no negative effect. Data is expressed as mean (n = 3) ± SE. * p < 0.05.
Fig 4
Fig 4. TLR6 was involved in NS3 mediated microglial activation.
Microglia was exposed to 20 ng/ml of NS3 for different time points and cells were stained for TLR6 protein expression. (A-B) Flow cytometry results indicates that TLR6 expression was significantly high from 1 hr to 3 hr time point. (C) Also NS3 exposed microglia stained brighter for TLR6 at 3 hr time point compared to the control cells. (D-F) TLR6 expression was silenced by TLR6 specific siRNA and the (G) TLR6 silenced cells secreted significantly less IL-6. Data is expressed as mean (n = 3) ± SE. * p < 0.05. Scale bar corresponds to 50 micron.
Fig 5
Fig 5. TLRs signalled via MyD88/NF-kB pathway.
(A-B) MyD88 was up regulated only during 1 hr time point and there was no significant difference observed at later time points. (C) Fluorescent signal for MyD88 was visually high in NS3 exposed microglia at 1 hr time point. (D) Nuclear translocation of NF-kB was observed at 1 hr time point for NS3 exposed cells. Flow cytometry data shows that (E-F) pNF-kB protein expression was significantly upregulated and (G-H) IkB-α protein expression was significantly downregulated from 1 hr to 24 hr exposure to NS3. (I-J) CHME3 cells were pre-treated with NF-kB inhibitor, Ro 106–9920 for 16 hrs before being exposed to 20 ng/ml of NS3. Flow cytometry data shows that pNF-kB expression in 10 μM and 100 μM NF-kB inhibitor treated microglia were significantly less during NS3 exposure at 6 hr time point compared to NS3 alone exposed cells. Immunofluorescence data is representative of 3 independent experiments, scale bar represents 50 micron. The data is expressed as mean (n = 3) ± SE, * p < 0.05, ^ p < 0.05.
Fig 6
Fig 6. NF-KB inhibitor down regulates NS3 mediated inflammation in microglia.
CHME3 cells were pre treated with NF-kB inhibitor, 10 μM Ro 106–9920 for 16 hrs before being exposed to 20 ng/ml of NS3. RT-PCR was performed for different time points and ELISA was performed for 6 hr time point to detect the cytokines. CHME3 exposed to 20 ng/ml of NS3 for 6 hrs were used as positive control. (A, B, C and D) IL-8, IL-6 and TNF-α expression was not detected and IL-1β gene band intensities were less in 3 hr to 24 hrs in the inhibitor treated cells when being exposed to NS3. NC represents the PCR reagent negative control. (E, F, G and H) IL-8, IL-6, TNF-α and IL-1β proteins were detected in the NS3 and inhibitor + NS3 treated cells and were absent in the control as well as inhibitor treated cells. There was a significant down regulation for IL-8 and other 3 cytokines in the inhibitor + NS3 treated cells compared to NS3 alone treated cells. PCR data is representative of 3 independent experiments. The data is expressed as mean (n = 3) ± SE, * p < 0.05, ** p < 0.01.
Fig 7
Fig 7. Pam2CSK4 induced immune tolerance against NS3 mediated inflammation.
The microglial cells were treated with 50 ng/ml of Pam2CSK4 for 16 hrs. The medium was replaced with fresh growth medium with or without NS3 for another 6 hours. RT-PCR and ELISA was performed to detect cytokine gene and protein expression respectively. 6 hr NS3 exposed microglia served as positive control. (A, B, C and D) Pam2Csk3 treatment completely blocked IL-8, IL-6 and TNF-α expression. IL-1β expression was detected however the band intensities were less compared to that of the positive control. NC represents the PCR reagent negative control. (E, F, G and H) ELISA results shows that IL-6, TNF-α and IL-1β were secreted at a significant level in the Pam2CSK4 treated cells even after replacing the cells with fresh growth medium without agonist (# p < 0.05, ## p< 0.01). TNF-α and IL-1β were significantly up regulated in Pam2CSK4 + NS3 treated cells compared to Pam2CSK4 exposed cells (^ p < 0.05, ^^ p < 0.01). There was a significant down regulation for IL-8 and other 3 cytokines in the Pam2CSK4 + NS3 treated cells compared to NS3 alone treated cells (* p < 0.05, ** p < 0.01). PCR data is representative of 3 independent experiments. The data is expressed as mean (n = 3) ± SE.
Fig 8
Fig 8. Pam3CSK4 induced immune tolerance against HCV NS3 mediated inflammation.
Microglia was pre treated with 50 ng/ml of Pam3CSK4 for 16 hrs. RT-PCR and ELISA was performed to study the immune tolerance mediated by Pam3CSK4. (A, B, C and D) Pam3CSK4 treatment completely blocked IL-8, IL-6 and TNF-α gene expression and IL-1β gene expression was down regulated compared to positive control (PC NC represents the PCR reagent negative control. (E, F, G and H) TNF-α and IL-1β were secreted at a significant level in the Pam3CSK4 treated cells even after replacing the cells with fresh growth medium without agonist (## p< 0.01). TNF-α and IL-1β were significantly upregulated in Pam3CSK4 + NS3 treated cells compared to Pam3CSK4 exposed cells (^ p < 0.05, ^^ p < 0.01). There was a significant down regulation for IL-8 and other 3 cytokines in the Pam3CSK4 + NS3 treated cells compared to NS3 alone treated cells (** p < 0.01). The data is expressed as mean (n = 3) ± SE.
Fig 9
Fig 9. TLR agonist treatment induced IL-10 production in microglia.
The microglial cells were treated with 50 ng/ml of Pam2CSK4 or Pam3CSK4 for 16 hrs. The medium was replaced with fresh growth medium with or without NS3 for another 6 hours. ELISA was performed to detect IL-10 secretion. CHME3 exposed to 20 ng/ml of NS3 for 6 hrs were used as positive control. (A) Microglial cells exposed to Pam2CSK4 or Pam3CSK4 for 16 hrs secreted IL-10 at a significant level (* p < 0.05). (B) IL-10 production was significantly up regulated in Pam2CSK+NS3 (** p < 0.01) and Pam3CSK4+NS3 (## p < 0.01) treated cells compared to NS3 alone treated cells, also IL-10 significantly up regulated in Pam3CSK4+NS3 exposed cells compared to Pam3CSK4 exposed cells (^^ p < 0.01). The data is expressed as mean (n = 3) ± SE.
Fig 10
Fig 10. TLR agonist treatment induced pro-inflammatory cytokines and NS3 pre-treatment does not induce immune tolerance.
Microglia was exposed to 50 ng/ml of Pam2CSK4 and Pam3CSK4 and pro-inflammatory cytokine expressions were measured by ELISA. (A and B) Pam2CSK4 treatment induced IL-6 and TNF-α production at 3 and 16 hr time point. (C and D) Similarly Pam3CSK4 treatment induced IL-6 and TNF-α production. Microglial cells were pre-treated with 20 ng/ml of NS3 protein for 16 hrs before 6 hr NS3 treatment to study the immune tolerance induction by NS3. (E) There was no significant difference observed for TNF-α production inNS3 exposed and NS3 pre-treated cells. The data is expressed as mean (n = 3) ± SE, *p< 0.05.

Similar articles

Cited by

References

    1. Howard CR. Hepatitis C virus: clades and properties. J Gastroentrol Hepatol. 2002; 17: S468–470. - PubMed
    1. Gravitiz L. Introduction: a smouldering public-health crisis. Nature. 2011; 474: S2–S4. 10.1038/474S2a - DOI - PubMed
    1. Bielefeldt-Ohmann H, Smirnova NP, Toinay AE, Webb BT, Antoniazzi AQ, van Campen H, et al. Neuro-invasion by a 'Trojan Horse' strategy and vasculopathy during intrauterine flavivirus infection. Int J Exp Pathol. 2012; 93: 24–33. 10.1111/j.1365-2613.2011.00795.x - DOI - PMC - PubMed
    1. Murray J, Fishman SL, Ryan E, Eng FJ, Walewski JL, Branch AD, et al. Clinicopathologic correlates of hepatitis C virus in brain: a pilot study. J Neurovirol. 2008; 14: 17–27. 10.1080/13550280701708427 - DOI - PMC - PubMed
    1. Laskus T, Radkowski M, Bednarska A, Wilkinson J, Adair D, Nowicki M, et al. Detection and analysis of hepatitis C virus sequences in cerebrospinal fluid. J Virol. 2002; 19: 10064–10068. - PMC - PubMed

Publication types

LinkOut - more resources