. 2015 May 12;10(5):e0125664.
doi: 10.1371/journal.pone.0125664. eCollection 2015.

Genotype-Associated Differential NKG2D Expression on CD56+CD3+ Lymphocytes Predicts Response to Pegylated-Interferon/Ribavirin Therapy in Chronic Hepatitis C

Affiliations

Genotype-Associated Differential NKG2D Expression on CD56+CD3+ Lymphocytes Predicts Response to Pegylated-Interferon/Ribavirin Therapy in Chronic Hepatitis C

Po-sung Chu et al. PLoS One. .

Abstract

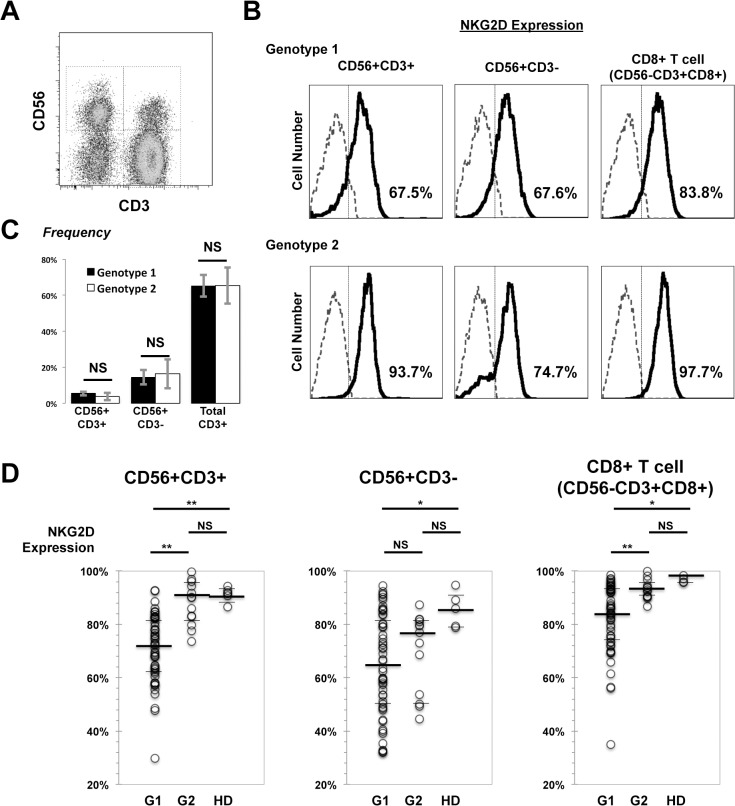
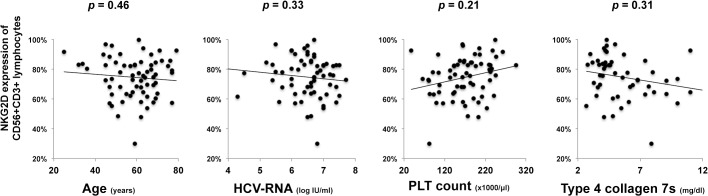
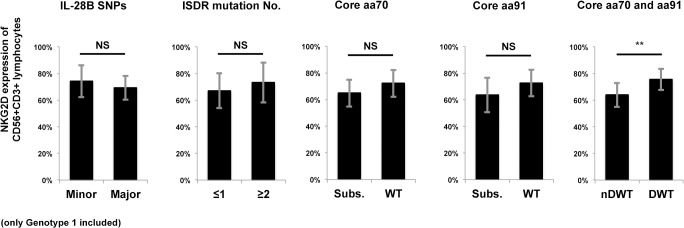
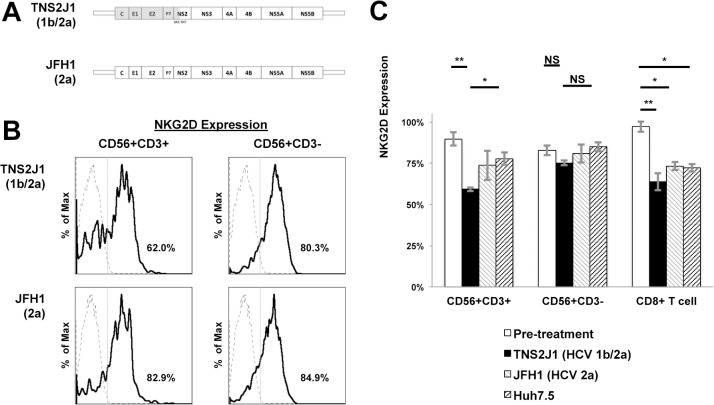
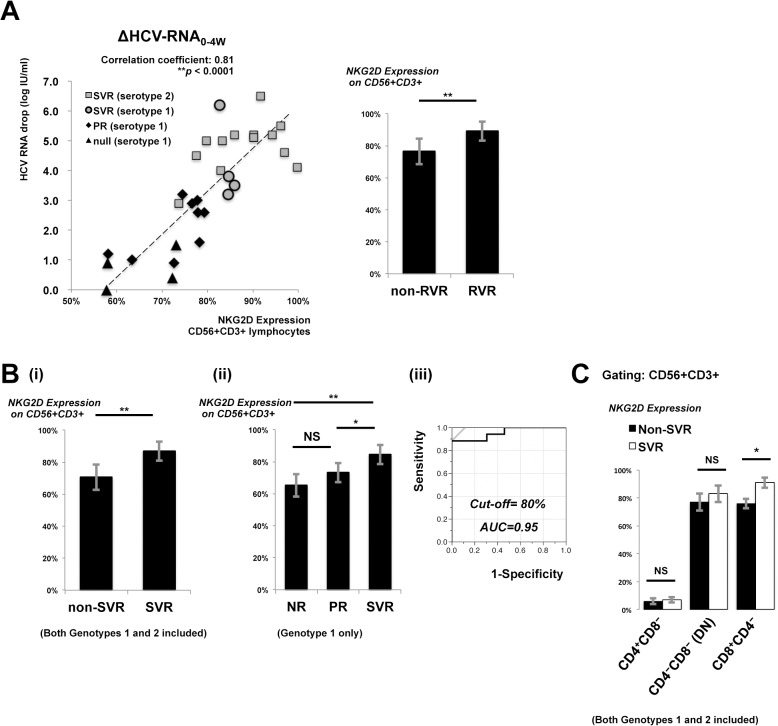
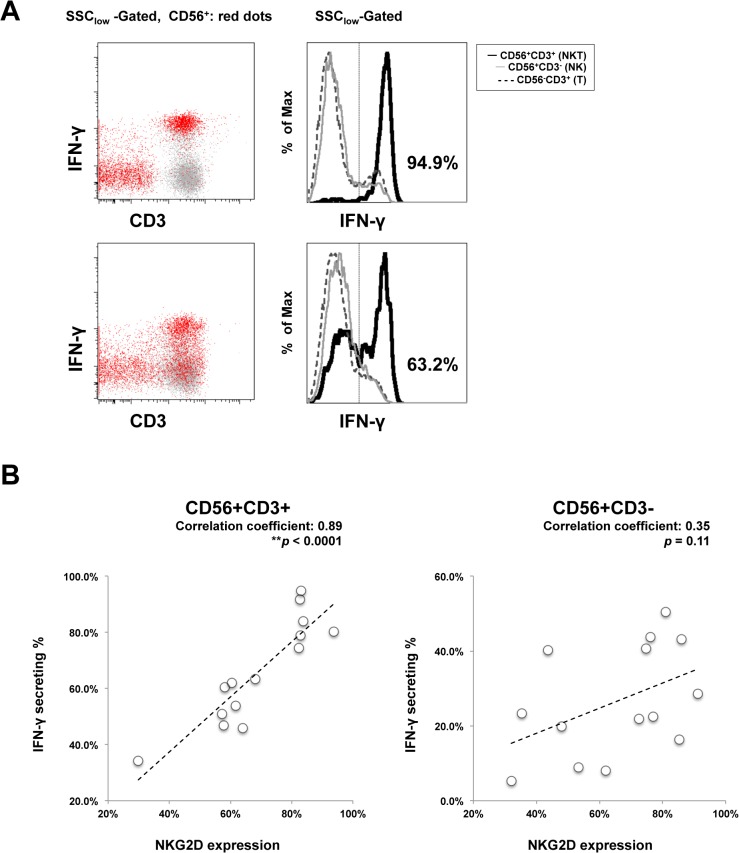
Hepatitis C virus (HCV) genotype 1 infections are significantly more difficult to eradicate with PEG-IFN/ribavirin therapy, compared to HCV genotype 2. The aim of this work is to investigate the difference of immunological impairments underlying this phenomenon. Pre-treatment NKG2D expression on peripheral CD56+CD3+ lymphocytes and CD56+CD3- NK cells from cases of chronic hepatitis C were analyzed and assessed by treatment effect. Two strains of HCV were used to co-incubate with immune cells in vitro. NKG2D expression on peripheral CD56+CD3+ lymphocytes, but not NK cells, was significantly impaired in genotype 1 infection, compared to genotype 2. When peripheral blood mononuclear cells from healthy donors were co-incubated with TNS2J1, a genotype 1b/2a chimera strain, or with JFH1, a genotype 2a strain, genotype-specific decrease of NKG2D on CD56+CD3+ lymphocytes, but not NK cells, was observed. Pre-treatment NKG2D expression on peripheral CD56+CD3+ lymphocytes significantly correlated with reduction in serum HCV RNA levels from week 0 to week 4, and predicted treatment response. Ex vivo stimulation of peripheral CD56+CD3+ lymphocytes showed NKG2D expression-correlated IFN-γ production. In conclusion, Decreased NKG2D expression on CD56+CD3+ lymphocytes in chronic HCV genotype 1 infection predicts inferior treatment response to PEG-IFN/ribavirin therapy compared to genotype 2.


Conflict of interest statement

Competing Interests: The authors have declared that no competing interests exist.

Figures

Fig 1
Fig 1. NKG2D expression on CD56+CD3+ lymphocytes in HCV genotype 1 infection is significantly impaired.
PBMCs were collected and analyzed by flow cytometry. (A) Representative flow cytometry plot shows CD56+CD3+ lymphocytes, NK (CD3-CD56+) cells and T lymphocytes (CD3+CD56-) gated on SSClow compartment. (B) Histograms from representative genotype 1 HCV infected (upper) and genotype 2 (lower) show NKG2D expression on CD56+CD3+ lymphocytes, NK cells and CD8+ T cells. Isotype controls are shown as dashed lines. Percentages are for NKG2D positive levels in corresponding compartments. (C) Peripheral frequency (compared to total SSClow cells) stratified by HCV genotypes. (D) NKG2D expression on CD56+CD3+ lymphocytes, NK cells and CD8+ CTLs was compared by HCV genotypes (G1, genotype 1, n = 53; G2, genotype 2, n = 13), with control data from healthy donors (HD, n = 9). Statistics were analyzed by Mann-Whitney U-test. Medians, IQRs were presented as bars. Please refer to Table 1 for exact values *P < 0.05, **P < 0.01, NS; not significant.
Fig 2
Fig 2. NKG2D expression on CD56+CD3+ lymphocytes has no significant correlation to age, HCV-RNA levels or liver fibrotic degree.
PBMCs were collected and analyzed by flow cytometry for expression of NKG2D on CD56+CD3+ lymphocytes. Statistics of data including age, HCV-RNA, peripheral platelet count, and serum type IV collagen 7s levels were analyzed for correlation. Please refer to supporting S1 Table for detailed values.
Fig 3
Fig 3. Differential NKG2D expression on CD56+CD3+ lymphocytes from chronic genotype 1 infection is associated with core protein aa substitutions.
Cases of HCV genotype 1 infection were determined for the IL28B SNP polymorphism at rs8099917, mutation numbers of ISDR on NS5A (aa2209-aa2248) and core protein substitution at aa70 or aa91 before treatment. NKG2D expression on CD56+CD3+ lymphocytes was compared between IL28B genotype major (TT at rs8099917, n = 35) or minor (TG or GG, n = 18), ISDR mutation numbers ≤1 (n = 34) or ≥2 (= 19), aa70 substituted (subs, n = 17) or wild type (n = 36), aa91 substituted (n = 19) or wild type (n = 34), double wild type (DWT, n = 25) at aa70 and aa91 or non-double wild type (nDWT, n = 27). Data show mean ± SD. **P < 0.01. NS: not significant.
Fig 4
Fig 4. Ex vivo exposure with different genotypes of HCV strains induced genotype-specific decrease of NKG2D expression on CD56+CD3+ lymphocytes.
PBMCs from healthy donors were isolated and co-incubated with HCV strains of different genotypes, or with supernatants from Huh7.5 cells for 48 hours, and were analyzed by flow cytometry for NKG2D expression. (A) Genetic schemes of two strains of HCV, TNS2J1, a genotype 1b/2a chimera virus strain, and JFH1, a genotype 2a strain. (B) Representative histograms from THS2J1 (upper) and JFH1 groups (lower) show NKG2D expression on CD56+CD3+ lymphocytes and NK cells. Isotype controls are shown as dashed lines. Percentages show positive NKG2D levels in corresponding compartments. (C) NKG2D expression on CD56+CD3+ lymphocytes, NK or CD8+ CTLs, and representative results of PBMCs from three healthy donors are shown. Data show mean ± SD. *P < 0.05, **P < 0.01, NS: not significant.
Fig 5
Fig 5. NKG2D expression on CD56+CD3+ lymphocytes predicts treatment responses to PEG-IFN/ ribavirin therapy.
PBMCs were collected and analyzed by flow cytometry for NKG2D expression on CD56+CD3+ lymphocytes before treatment. Plasma HCV-RNA levels were measured regularly to monitor viral kinetics during treatment. (A, left) Correlation of decreased plasma HCV RNA (IU/ml) from week 0 to week 4 and NKG2D expression on CD56+CD3+ lymphocytes is shown. (A, right) NKG2D expression was analyzed to compare RVR (n = 8) and non-RVR (n = 22) cases. (B) NKG2D expression on CD56+CD3+ lymphocytes was analyzed to (i) compare SVR (n = 17) and non-SVR (n = 13) cases; (ii) SVR (n = 4), PR (n = 9), and NR (n = 4) in genotype 1 infection; (iii) ROC analysis to predict SVR by NKG2D expression on CD56+CD3+ lymphocytes. (C) Pre-treatment peripheral CD56+CD3+ lymphocytes were stratified into CD4+CD8-, CD8+CD4- and CD4-CD8- double negative (DN) subpopulations. NKG2D expression on corresponding subpopulations were determined. Statistics of NKG2D expression were compared between SVR (n = 17) and non-SVR (n = 13) cases, including both genotypes. Data show mean ± SD. *P < 0.05, **P < 0.01, NS: not significant.
Fig 6
Fig 6. Impaired NKG2D expression on CD56+CD3+ lymphocytes correlates to decreased IFN-γ production.
PBMC were collected and analyzed for surface NKG2D expression by flow cytometry in fourteen chronically HCV genotype 1 infected cases. With the same blood sample and at the same time, 4 hours of PMA/ionomycin stimulations were introduced, and then intracellular IFN-γ production levels were determined in CD56+CD3+ (NKT), CD56+CD3- (NK) and CD56-CD3+ (T lymphocyte) populations. (A) Two representative FACS plots and histograms are from the case of SVR (upper) and non-SVR (lower). CD56+ cells are shown as red dots, and other cells as gray dots. n = 14. Statistical correlation of corresponding NKG2D expression and IFN-i production was analyzed in (B).

Similar articles

Cited by

References

    1. Bowen DG, Walker CM. Mutational escape from CD8+ T cell immunity: HCV evolution, from chimpanzees to man. The Journal of experimental medicine. 2005;201(11):1709–14. Epub 2005/06/09. 10.1084/jem.20050808 PubMed - DOI - PMC - PubMed
    1. Rosen HR. Clinical practice. Chronic hepatitis C infection. The New England journal of medicine. 2011;364(25):2429–38. Epub 2011/06/24. 10.1056/NEJMcp1006613 PubMed . - DOI - PubMed
    1. Thein HH, Yi Q, Dore GJ, Krahn MD. Estimation of stage-specific fibrosis progression rates in chronic hepatitis C virus infection: a meta-analysis and meta-regression. Hepatology. 2008;48(2):418–31. Epub 2008/06/20. 10.1002/hep.22375 PubMed . - DOI - PubMed
    1. Rosen HR. Emerging concepts in immunity to hepatitis C virus infection. The Journal of clinical investigation. 2013;123(10):4121–30. Epub 2013/10/03. 10.1172/JCI67714 PubMed - DOI - PMC - PubMed
    1. Ebinuma H, Nakamoto N, Li Y, Price DA, Gostick E, Levine BL, et al. Identification and in vitro expansion of functional antigen-specific CD25+ FoxP3+ regulatory T cells in hepatitis C virus infection. Journal of virology. 2008;82(10):5043–53. Epub 2008/03/14. 10.1128/JVI.01548-07 PubMed - DOI - PMC - PubMed

Publication types

MeSH terms