. 2015 Aug;276(2):371-80.
doi: 10.1148/radiol.2015142304. Epub 2015 May 12.

Are Qualitative Assessments of Background Parenchymal Enhancement, Amount of Fibroglandular Tissue on MR Images, and Mammographic Density Associated with Breast Cancer Risk?

Affiliations

Are Qualitative Assessments of Background Parenchymal Enhancement, Amount of Fibroglandular Tissue on MR Images, and Mammographic Density Associated with Breast Cancer Risk?

Brian N Dontchos et al. Radiology. 2015 Aug.

Abstract

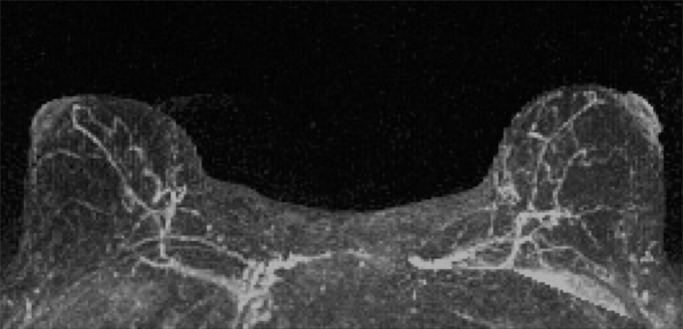
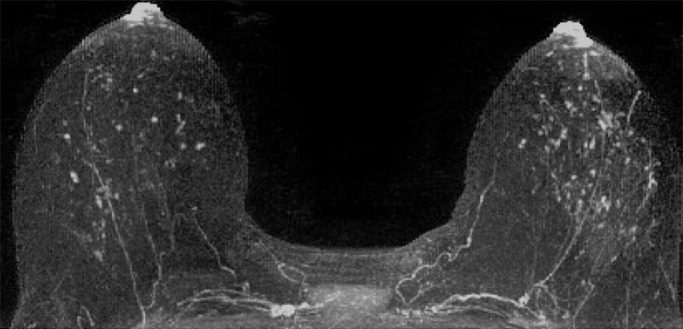
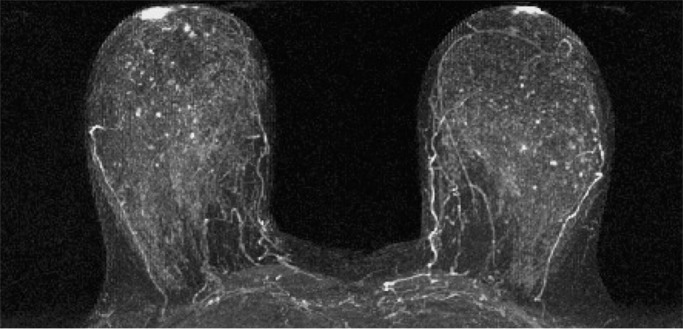
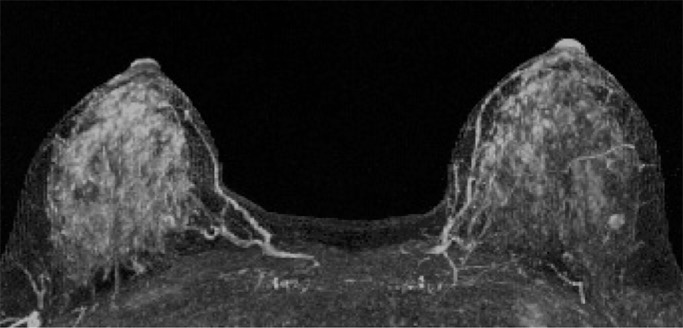
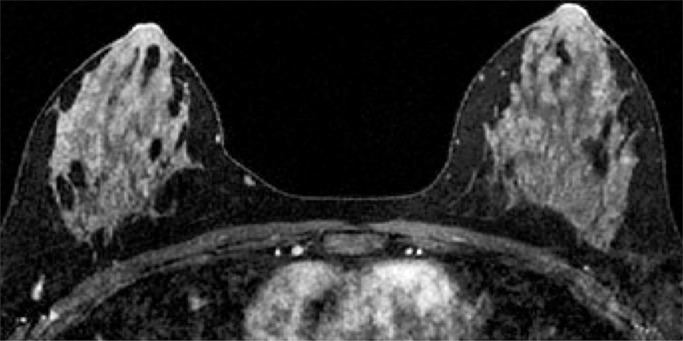
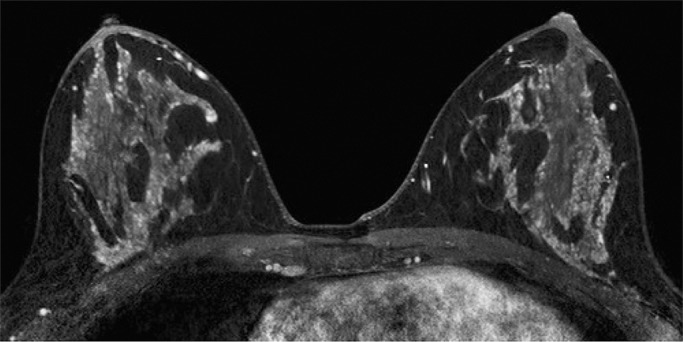
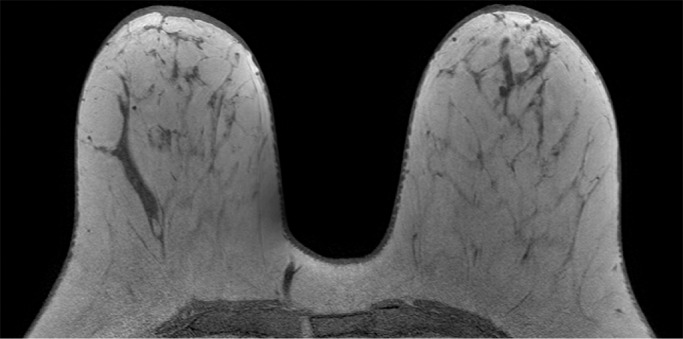
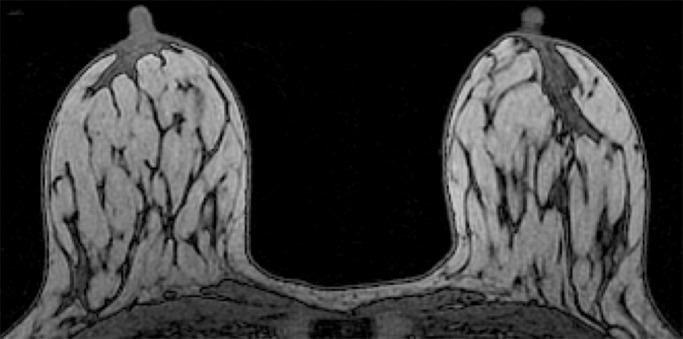
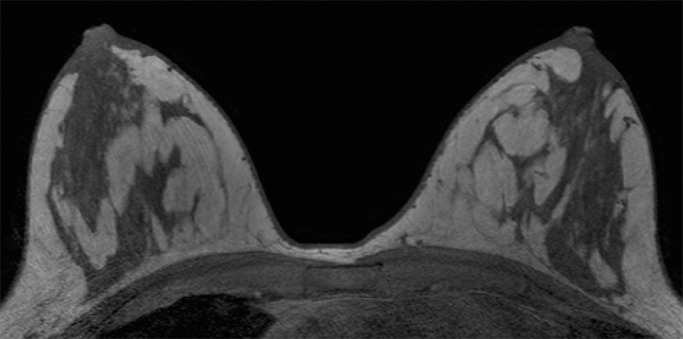
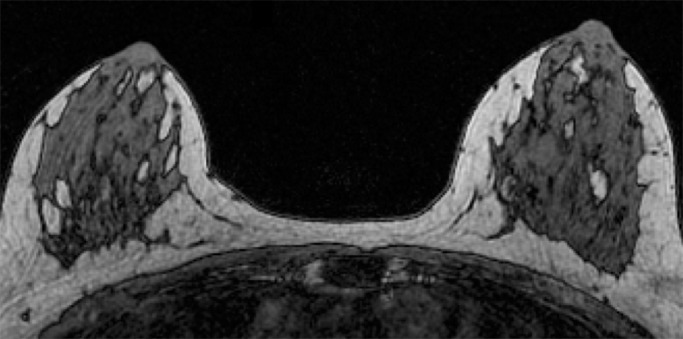
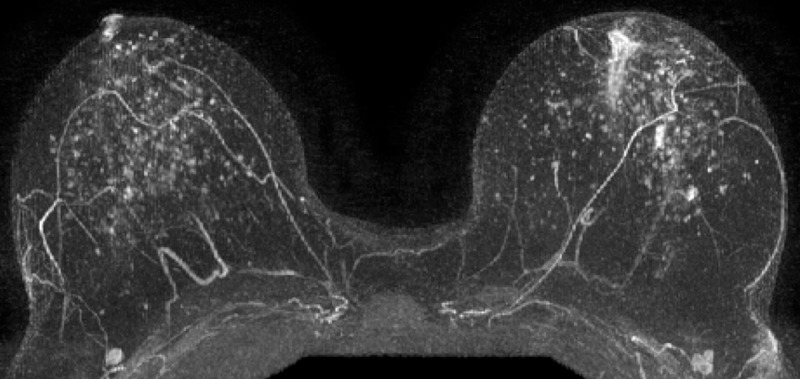
Purpose: To investigate whether qualitative magnetic resonance (MR) imaging assessments of background parenchymal enhancement (BPE), amount of fibroglandular tissue (FGT), and mammographic density are associated with risk of developing breast cancer in women who are at high risk.

Materials and methods: In this institutional review board-approved HIPAA-compliant retrospective study, all screening breast MR images obtained from January 2006 to December 2011 in women aged 18 years or older and at high risk for but without a history of breast cancer were identified. Women in whom breast cancer was diagnosed after index MR imaging comprised the cancer cohort, and one-to-one matching (age and BRCA status) of each woman with breast cancer to a control subject was performed by using MR images obtained in women who did not develop breast cancer with follow-up time maximized. Amount of BPE, BPE pattern (peripheral vs central), amount of FGT at MR imaging, and mammographic density were assessed on index images. Imaging features were compared between cancer and control cohorts by using conditional logistic regression.

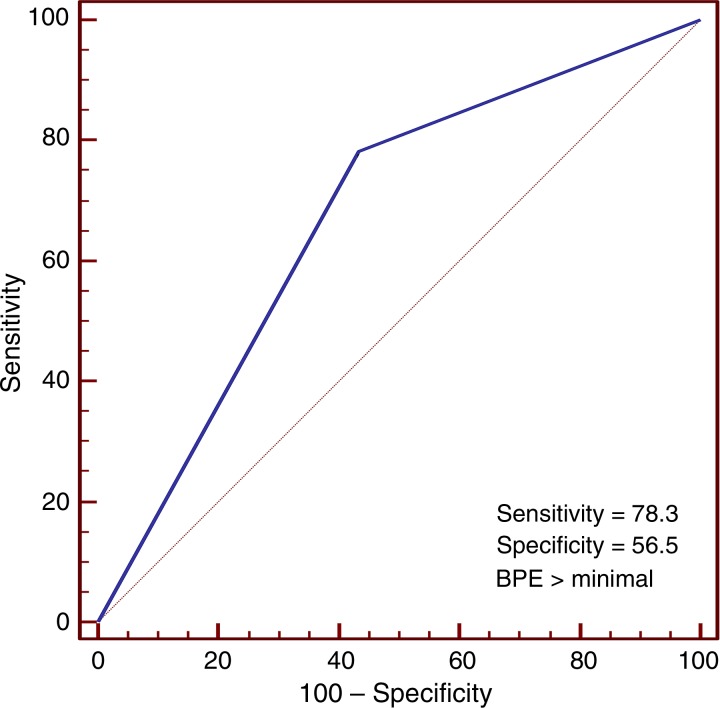
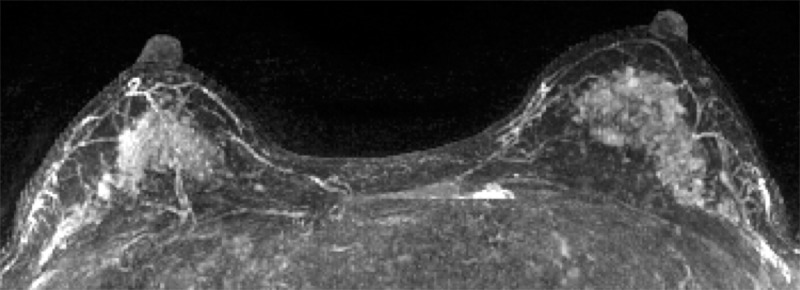
Results: Twenty-three women at high risk (mean age, 47 years ± 10 [standard deviation]; six women had BRCA mutations) with no history of breast cancer underwent screening breast MR imaging; in these women, a diagnosis of breast cancer (invasive, n = 12; in situ, n = 11) was made during the follow-up interval. Women with mild, moderate, or marked BPE were nine times more likely to receive a diagnosis of breast cancer during the follow-up interval than were those with minimal BPE (P = .007; odds ratio = 9.0; 95% confidence interval: 1.1, 71.0). BPE pattern, MR imaging amount of FGT, and mammographic density were not significantly different between the cohorts (P = .5, P = .5, and P = .4, respectively).

Conclusion: Greater BPE was associated with a higher probability of developing breast cancer in women at high risk for cancer and warrants further study.


Figures

Figure 1a:
Figure 1a:
Examples of varying amounts of BPE, as prospectively assessed qualitatively. Axial postcontrast maximum intensity projection MR images show (a) minimal, (b) mild, (c) moderate, and (d) marked BPE.
Figure 1b:
Figure 1b:
Examples of varying amounts of BPE, as prospectively assessed qualitatively. Axial postcontrast maximum intensity projection MR images show (a) minimal, (b) mild, (c) moderate, and (d) marked BPE.
Figure 1c:
Figure 1c:
Examples of varying amounts of BPE, as prospectively assessed qualitatively. Axial postcontrast maximum intensity projection MR images show (a) minimal, (b) mild, (c) moderate, and (d) marked BPE.
Figure 1d:
Figure 1d:
Examples of varying amounts of BPE, as prospectively assessed qualitatively. Axial postcontrast maximum intensity projection MR images show (a) minimal, (b) mild, (c) moderate, and (d) marked BPE.
Figure 2a:
Figure 2a:
Examples of BPE patterns, as assessed retrospectively, with observers blinded to clinical outcomes. Axial T1-weighted postcontrast fat-saturated images show (a) BPE with a predominantly central pattern and (b) BPE with a predominantly peripheral pattern.
Figure 2b:
Figure 2b:
Examples of BPE patterns, as assessed retrospectively, with observers blinded to clinical outcomes. Axial T1-weighted postcontrast fat-saturated images show (a) BPE with a predominantly central pattern and (b) BPE with a predominantly peripheral pattern.
Figure 3a:
Figure 3a:
Examples of varying amounts of FGT on breast MR images, as assessed retrospectively, with observers blinded to known mammographic densities. Axial T1-weighted images show examples of breast composition described as (a) almost entirely fat, (b) scattered fibroglandular, (c) heterogeneous, and (d) extreme amount of FGT.
Figure 3b:
Figure 3b:
Examples of varying amounts of FGT on breast MR images, as assessed retrospectively, with observers blinded to known mammographic densities. Axial T1-weighted images show examples of breast composition described as (a) almost entirely fat, (b) scattered fibroglandular, (c) heterogeneous, and (d) extreme amount of FGT.
Figure 3c:
Figure 3c:
Examples of varying amounts of FGT on breast MR images, as assessed retrospectively, with observers blinded to known mammographic densities. Axial T1-weighted images show examples of breast composition described as (a) almost entirely fat, (b) scattered fibroglandular, (c) heterogeneous, and (d) extreme amount of FGT.
Figure 3d:
Figure 3d:
Examples of varying amounts of FGT on breast MR images, as assessed retrospectively, with observers blinded to known mammographic densities. Axial T1-weighted images show examples of breast composition described as (a) almost entirely fat, (b) scattered fibroglandular, (c) heterogeneous, and (d) extreme amount of FGT.
Figure 4:
Figure 4:
Receiver operating characteristic curve shows accuracy of BPE assessment in the discrimination of patients with cancer (n = 23) and control subjects (n = 23). The area under the curve was 0.70 (95% confidence interval: 0.54, 0.82). An optimal BPE threshold of greater than minimal was identified to maximize sensitivity and specificity, with a resulting diagnostic performance of 78% sensitivity and 57% specificity.
Figure 5:
Figure 5:
Contrast-enhanced maximum intensity projection in a 41-year-old woman with a family history of breast cancer shows marked BPE. This patient was found to have invasive ductal carcinoma 183 days after index MR imaging. (The maximum intensity projection image from the age- and history-matched control subject is provided in Figure E1 [online].)
Figure 6:
Figure 6:
Postcontrast maximum intensity projection in a 48-year-old woman with a genetic history of breast cancer and prior excisional biopsy in the left breast shows moderate BPE. A diagnosis of invasive ductal carcinoma was made 1044 days after index MR imaging. (The maximum intensity projection image from the age- and history-matched control subject is provided in Figure E2 [online].)

References

    1. Hamstra DA, Rehemtulla A, Ross BD. Diffusion magnetic resonance imaging: a biomarker for treatment response in oncology. J Clin Oncol 2007;25(26):4104–4109. - PubMed
    1. Smith RA, Cokkinides V, Brooks D, Saslow D, Shah M, Brawley OW. Cancer screening in the United States, 2011: a review of current American Cancer Society guidelines and issues in cancer screening. CA Cancer J Clin 2011;61(1):8–30. - PubMed
    1. Wald NJ, Hackshaw AK, Frost CD. When can a risk factor be used as a worthwhile screening test? BMJ 1999;319(7224):1562–1565. - PMC - PubMed
    1. Boyd NF, Byng JW, Jong RA, et al. . Quantitative classification of mammographic densities and breast cancer risk: results from the Canadian National Breast Screening Study. J Natl Cancer Inst 1995;87(9):670–675. - PubMed
    1. Byrne C, Schairer C, Brinton LA, et al. . Effects of mammographic density and benign breast disease on breast cancer risk (United States). Cancer Causes Control 2001;12(2):103–110. - PubMed

Publication types

LinkOut - more resources