

Avoiding drying-artifacts in transmission electron microscopy: Characterizing the size and colloidal state of nanoparticles
- PMID: 25965905
- PMCID: PMC4428270
- DOI: 10.1038/srep09793
Avoiding drying-artifacts in transmission electron microscopy: Characterizing the size and colloidal state of nanoparticles
Erratum in
-
Correction: Avoiding drying-artifacts in transmission electron microscopy: Characterizing the size and colloidal state of nanoparticles.Sci Rep. 2025 Dec 30;15(1):45674. doi: 10.1038/s41598-025-33795-w. Sci Rep. 2025. PMID: 41469478 Free PMC article. No abstract available.
Abstract
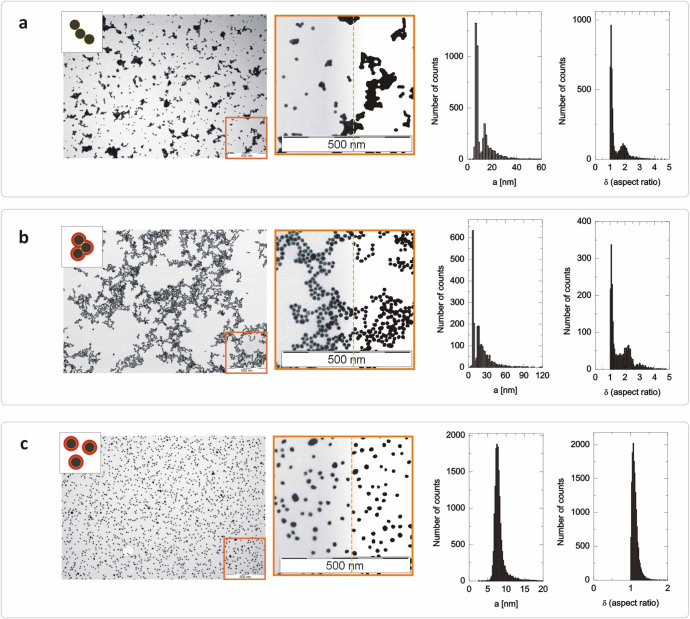
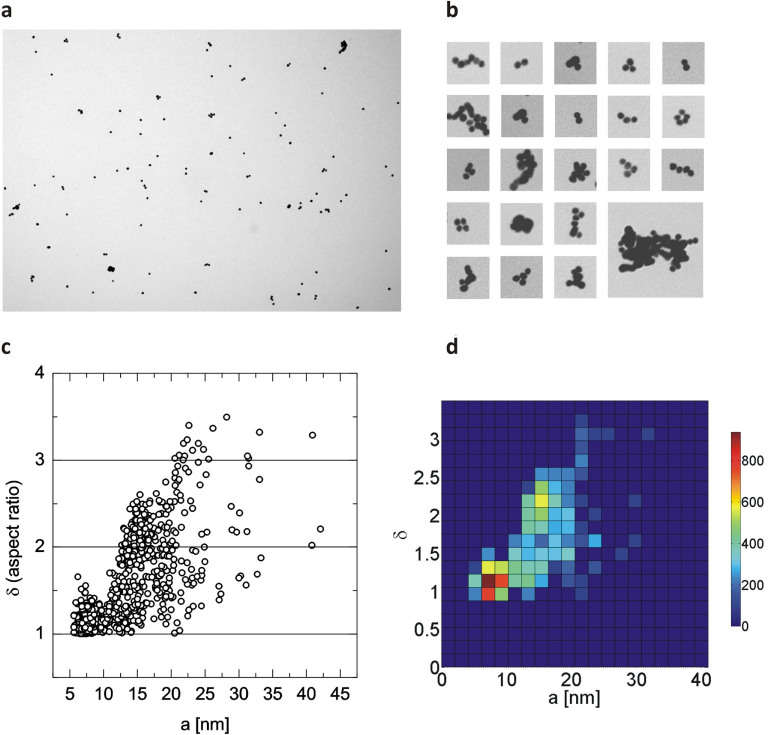
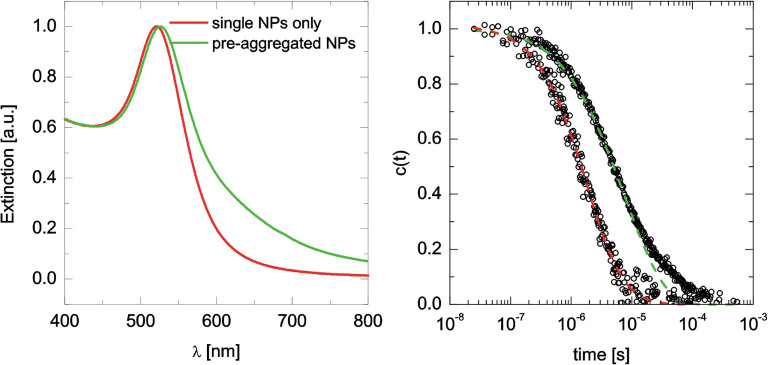
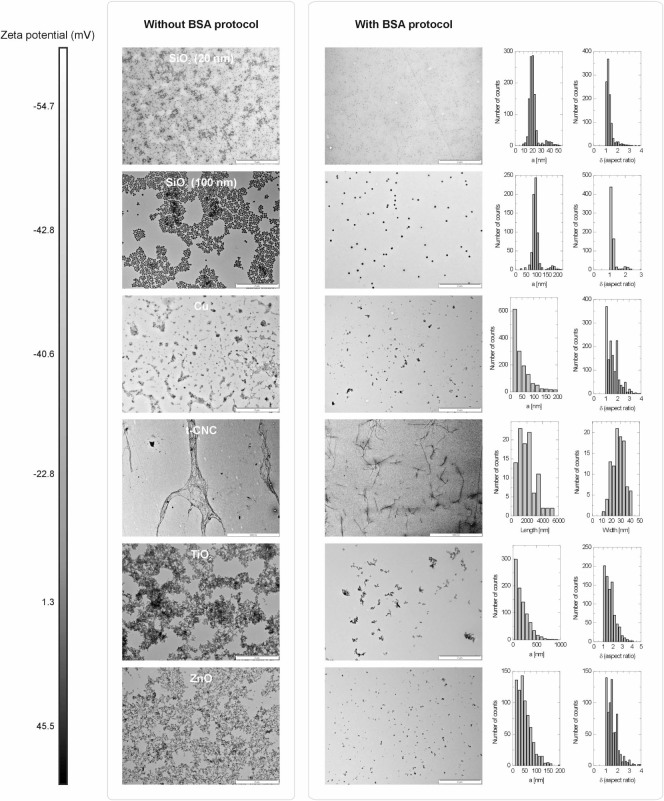
Standard transmission electron microscopy nanoparticle sample preparation generally requires the complete removal of the suspending liquid. Drying often introduces artifacts, which can obscure the state of the dispersion prior to drying and preclude automated image analysis typically used to obtain number-weighted particle size distribution. Here we present a straightforward protocol for prevention of the onset of drying artifacts, thereby allowing the preservation of in-situ colloidal features of nanoparticles during TEM sample preparation. This is achieved by adding a suitable macromolecular agent to the suspension. Both research- and economically-relevant particles with high polydispersity and/or shape anisotropy are easily characterized following our approach (http://bsa.bionanomaterials.ch), which allows for rapid and quantitative classification in terms of dimensionality and size: features that are major targets of European Union recommendations and legislation.
Figures
References
-
- Linsinger T. et al. Requirements on measurements for the implementation of the European Commission definition of the term ‘nanomaterial’, doi:10.2787/63490 (2012) (Date of access:11/12/2014).
-
- Hall J. B., Dobrovolskaia M. A., Patri A. K. & McNeil S. E. Characterization of nanoparticles for therapeutics. Nanomedicine 2, 789–803 (2007). - PubMed
-
- Deegan R. D. et al. Capillary flow as the cause of ring stains from dried liquid drops. Nature 389, 827–829 (1997).
-
- Dieckmann Y., Colfen H., Hofmann H. & Petri-Fink A. Particle Size Distribution Measurements of Manganese-Doped ZnS Nanoparticles. Anal. Chem. 81, 3889–3895 (2009). - PubMed
-
- Domingos R. F. et al. Characterizing Manufactured Nanoparticles in the Environment: Multimethod Determination of Particle Sizes. Environ. Sci. Technol. 43, 7277–7284 (2009). - PubMed
Publication types
LinkOut - more resources
Full Text Sources
Other Literature Sources
