

The effects of energy intake of four different feeding patterns in rats
- PMID: 25966980
- PMCID: PMC4935427
- DOI: 10.1177/1535370215584890
The effects of energy intake of four different feeding patterns in rats
Abstract
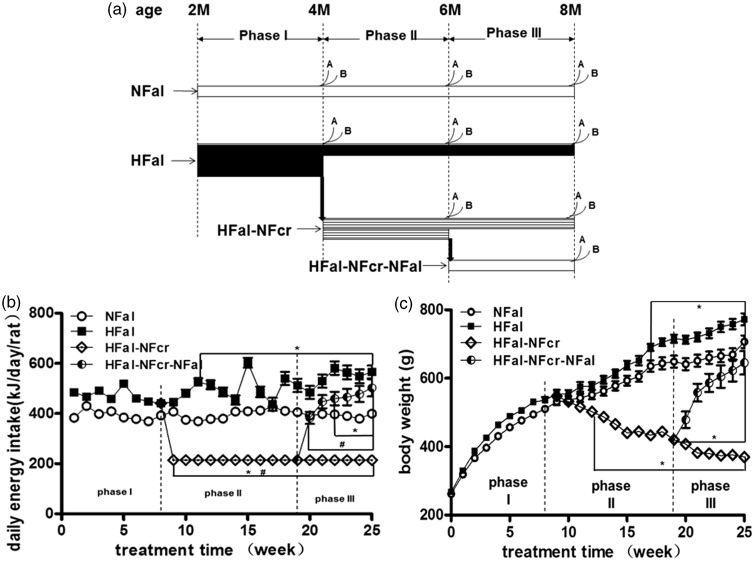
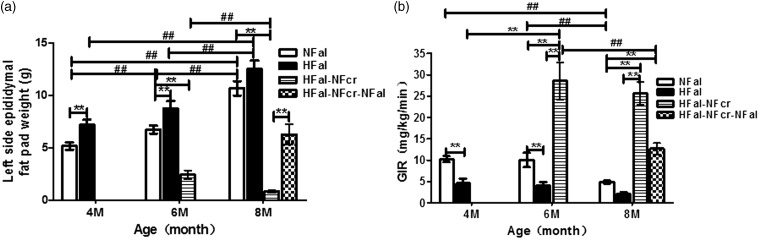
Energy intake can affect the metabolism. But it is not very clear that how and to what degree the metabolism can be changed by energy intake quantity and change. Here we applied four feeding patterns in male Sprague-Dawley rats--normal ad libitum diet (NFal), high-fat diet (HFal), caloric restriction (CR) after HFal (HFal-NFcr), and refeeding from CR to ad libitum (HFal-NFcr-NFal). Food intake and body weight, along with fat mass, insulin sensitivity, fasting plasma insulin, and glucose level were used to calculate the energy efficiency and compared the quantitative effects of energy intake. Energy intake changed little in NFal or HFal group; while it changed greatly and suddenly in HFal-NFcr or HFal-NFcr-NFal group. All the parameters we detected were different between these four feeding patterns. Excess of energy intake from high-fat diet induced adverse outcomes with low energy efficiency. CR reversed the impairment of high-fat diet with very high energy efficiency in a short period. However, dramatic response with high energy efficiency induced by recovery to feeding ad libitum after CR, which was possible harmful to health. In conclusion, energy intake quantity and change are key determinants of metabolism. Different energy intake quantity and change affect body weight, white adipose tissue weight, insulin sensitivity, etc. at different degrees and speeds because of different energy efficiency.
Keywords: Energy efficiency; caloric restriction; fat mass; high-fat diet; insulin sensitivity; refeeding.
© 2016 by the Society for Experimental Biology and Medicine.
Figures
References
-
- Obesity: preventing and managing the global epidemic. Report of a WHO consultation. World Health Organ Tech Rep Ser 2000; 894: i–xii,1–253. - PubMed
-
- Alberti KG, Zimmet P, Shaw J. Metabolic syndrome—a new world-wide definition. A Consensus Statement from the International Diabetes Federation. Diabet Med 2006; 23: 469–80. - PubMed
-
- Duarte FO, Sene-Fiorese M, Cheik NC, Maria AS, de Aquino AE, Jr, Oishi JS, Rossi EA, Garcia de Oliveira Duarte AC, Damaso AR. Food restriction and refeeding induces changes in lipid pathways and fat deposition in the adipose and hepatic tissues in rats with diet-induced obesity. Exp Physiol 2012; 97: 882–94. - PubMed
-
- Schrauwen P, Westerterp KR. The role of high-fat diets and physical activity in the regulation of body weight. Br J Nutr 2000; 84: 417–27. - PubMed
-
- Westerterp KR. Perception, passive overfeeding and energy metabolism. Physiol Behav 2006; 89: 62–5. - PubMed
Publication types
MeSH terms
Substances
LinkOut - more resources
Full Text Sources
Other Literature Sources