. 2015 May 13:13:114.
doi: 10.1186/s12916-015-0354-z.

Multiple clinical episodes of Plasmodium falciparum malaria in a low transmission intensity setting: exposure versus immunity

Affiliations

Multiple clinical episodes of Plasmodium falciparum malaria in a low transmission intensity setting: exposure versus immunity

Josea Rono et al. BMC Med. .

Abstract

Background: Epidemiological studies indicate that some children experience many more episodes of clinical malaria than their age mates in a given location. Whether this is as a result of the micro-heterogeneity of malaria transmission with some children effectively getting more exposure to infectious mosquitoes than others, or reflects a failure in the acquisition of immunity needs to be elucidated. Here, we investigated the determinants of increased susceptibility to clinical malaria by comparing the intensity of exposure to Plasmodium falciparum and the acquisition of immunity in children at the extreme ends of the over-dispersed distribution of the incidence of clinical malaria.

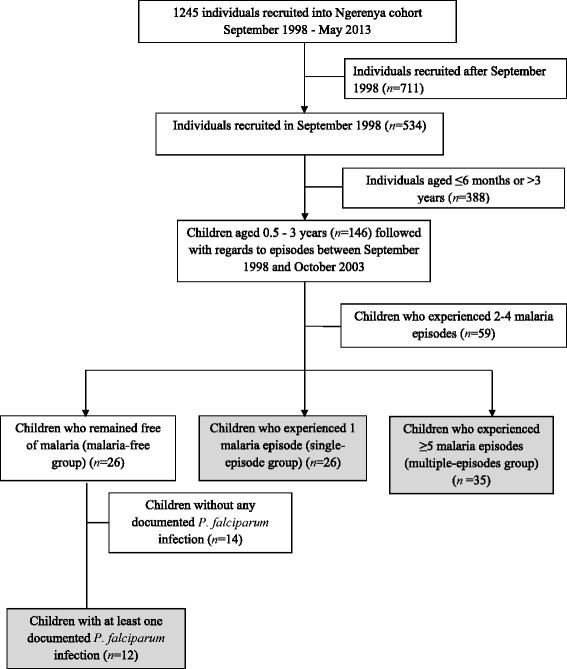
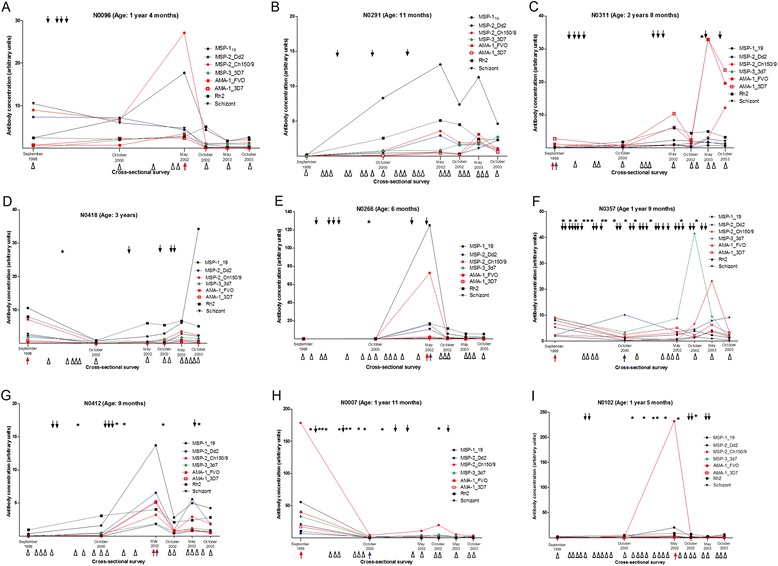
Methods: The study was nested within a larger cohort in an area where the intensity of malaria transmission was low. We identified children who over a five-year period experienced 5 to 16 clinical malaria episodes (children at the tail-end of the over-dispersed distribution, n = 35), remained malaria-free (n = 12) or had a single episode (n = 26). We quantified antibodies against seven Plasmodium falciparum merozoite antigens in plasma obtained at six cross-sectional surveys spanning these five years. We analyzed the antibody responses to identify temporal dynamics that associate with disease susceptibility.

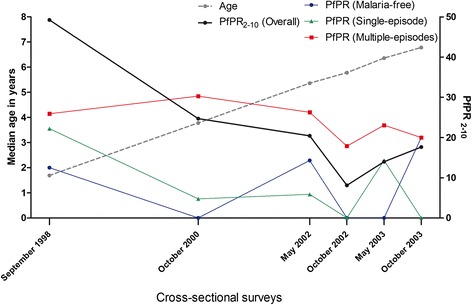
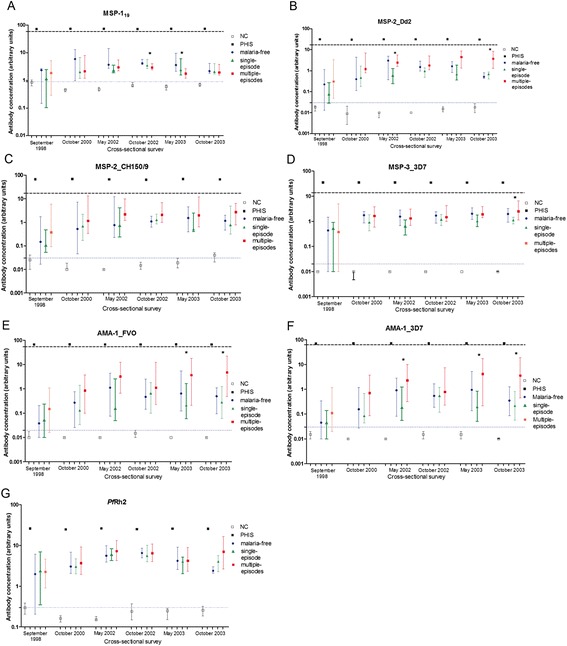
Results: Children experiencing multiple episodes of malaria were more likely to be parasite positive by microscopy at cross-sectional surveys (X (2) test for trend 14.72 P = 0.001) and had a significantly higher malaria exposure index, than those in the malaria-free or single episode groups (Kruskal-Wallis test P = 0.009). In contrast, the five-year temporal dynamics of anti-merozoite antibodies were similar in the three groups. Importantly in all groups, antibody levels were below the threshold concentrations previously observed to be correlated with protective immunity.

Conclusions: We conclude that in the context of a low malaria transmission setting, susceptibility to clinical malaria is not accounted for by anti-merozoite antibodies but appears to be a consequence of increased parasite exposure. We hypothesize that intensive exposure is a prerequisite for protective antibody concentrations, while little to modest exposure may manifest as multiple clinical infections with low levels of antibodies. These findings have implications for interventions that effectively lower malaria transmission intensity.


Figures

Figure 1
Figure 1
Inclusion of children into the malaria-free, single-episode and multiple-episodes groups. The gray-shaded boxes indicate the number of children included in the three groups investigated in this study.
Figure 2
Figure 2
Distribution of clinical malaria episodes per child among children in the multiple-episodes group. The histogram shows the number of children (y axis) within the multiple-episodes group with a given number of clinical malaria episodes (x axis) between September 1998 and October 2003.
Figure 3
Figure 3
Temporal change in age and parasite prevalence during the study period. The plot shows the median age in years (left y axis) of the children included in this study, the parasite prevalence rates in malaria-free (blue circles), single-episode (green triangles) and multiple-episodes (red squares) groups of children as well as the overall parasite prevalence (black circles) in children 2- to 10-years old (PfPR 2–10) in the entire Ngerenya cohort at the six cross-sectional surveys.
Figure 4
Figure 4
Antibody and P. falciparum infection profiles of individual children. The plots show the levels of IgG antibodies (y axis) to a panel of merozoite antigens at each of the six cross-sectional surveys (x axis) conducted between 1998 and 2003. The black solid arrows indicate the time during follow up when an individual child was parasitemic by microscopy. Asterisks indicate the time during follow up when a child had an episode of clinical malaria. The open triangles along the x axis indicate either the cross-sectional surveys when a child was aparasitemic or the weekly follow up visits when a child was symptomatic but found to be aparasitemic by microscopy. Red and blue arrows along the x-axis indicate the cross-sectional surveys at which a child was infected with P. falciparum clones of the IC-1 or FC msp2 types, respectively. Panel A-B, CE and FI show the profiles of children belonging to the malaria-free, single-episode and multiple-episodes groups, respectively. Ages are reported as at baseline, that is, in September 1998. IgG, immunoglobulin G.
Figure 5
Figure 5
Distribution of antibody titers to individual merozoite antigens among the three groups of children. The panels show the distribution of antibody titers (median and interquartile range) in the malaria-free (blue circles), single-episode (green triangles) and multiple-episodes (red squares) groups of children at six cross-sectional surveys for the respective antigens: A) MSP-119, B) MSP-2_Dd2, C) MSP-2_CH150/9, D) MSP-3_3D7, E) AMA-1_FVO, F) AMA-1_3D7 and G) PfRh2. ‘NC’ refers to antibody titers in sera from P. falciparum-naïve adults (used here as negative controls). ‘PHIS’ refers to antibody titers in a pool of hyperimmune sera (used here as a positive control). The black bold dotted line shows the ‘threshold’ antibody concentrations to respective antigens that were calculated as described in the Results section. The thin dotted blue line shows the ‘seropositivity cut off’ based on the mean plus two standard deviations of the antibody titer obtained with the negative control sera.

References

    1. Greenwood BM. The microepidemiology of malaria and its importance to malaria control. Trans R Soc Trop Med Hyg. 1989;83:25–9. doi: 10.1016/0035-9203(89)90599-3. - DOI - PubMed
    1. Trape JF, Pison G, Spiegel A, Enel C, Rogier C. Combating malaria in Africa. Trends Parasitol. 2002;18:224–30. doi: 10.1016/S1471-4922(02)02249-3. - DOI - PubMed
    1. Clark TD, Greenhouse B, Njama-Meya D, Nzarubara B, Maiteki-Sebuguzi C, Staedke SG, et al. Factors determining the heterogeneity of malaria incidence in children in Kampala. Uganda J Infect Dis. 2008;198:393–400. doi: 10.1086/589778. - DOI - PubMed
    1. Bejon P, Williams TN, Liljander A, Noor AM, Wambua J, Ogada E, et al. Stable and unstable malaria hotspots in longitudinal cohort studies in Kenya. PLoS Med. 2010;7:e1000304. doi: 10.1371/journal.pmed.1000304. - DOI - PMC - PubMed
    1. Mwangi TW, Fegan G, Williams TN, Kinyanjui SM, Snow RW, Marsh K. Evidence for over-dispersion in the distribution of clinical malaria episodes in children. PLoS One. 2008;3:e2196. doi: 10.1371/journal.pone.0002196. - DOI - PMC - PubMed

Publication types

Substances

LinkOut - more resources