. 2015 Aug 15;21(16):3771-82.
doi: 10.1158/1078-0432.CCR-14-3145. Epub 2015 May 12.

TLR9-Targeted STAT3 Silencing Abrogates Immunosuppressive Activity of Myeloid-Derived Suppressor Cells from Prostate Cancer Patients

Affiliations

TLR9-Targeted STAT3 Silencing Abrogates Immunosuppressive Activity of Myeloid-Derived Suppressor Cells from Prostate Cancer Patients

Dewan M S Hossain et al. Clin Cancer Res. .

Abstract

Purpose: Recent advances in immunotherapy of advanced human cancers underscored the need to address and eliminate tumor immune evasion. The myeloid-derived suppressor cells (MDSC) are important inhibitors of T-cell responses in solid tumors, such as prostate cancers. However, targeting MDSCs proved challenging due to their phenotypic heterogeneity.

Experimental design: Myeloid cell populations were evaluated using flow cytometry on blood samples, functional assays, and immunohistochemical/immunofluorescent stainings on specimens from healthy subjects, localized and metastatic castration-resistant prostate cancer patients.

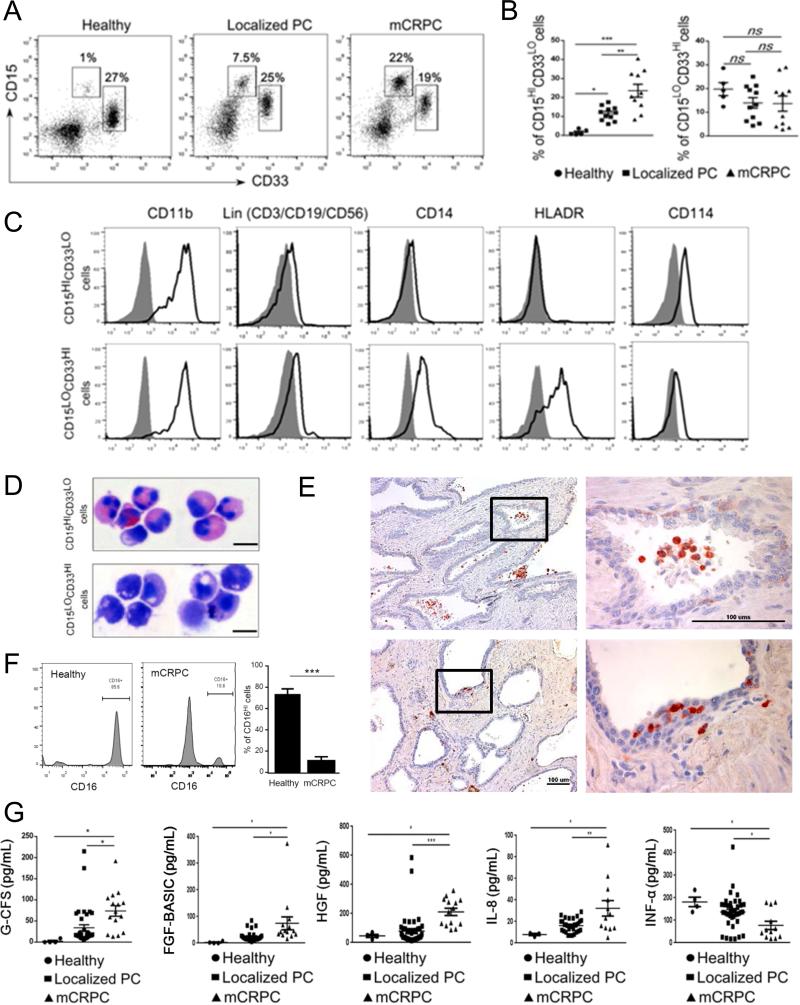
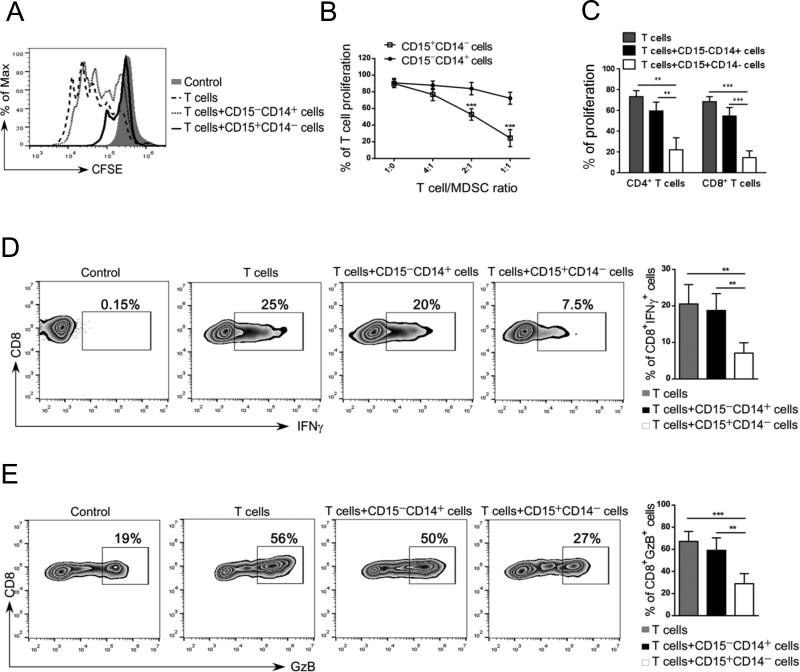
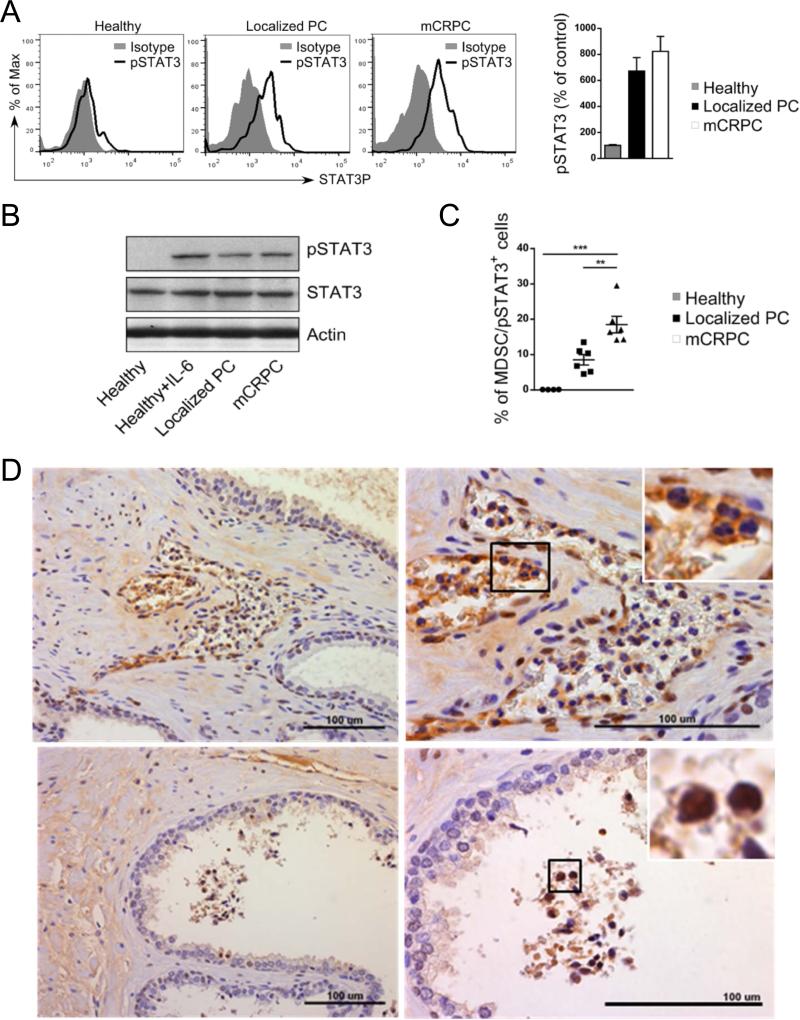
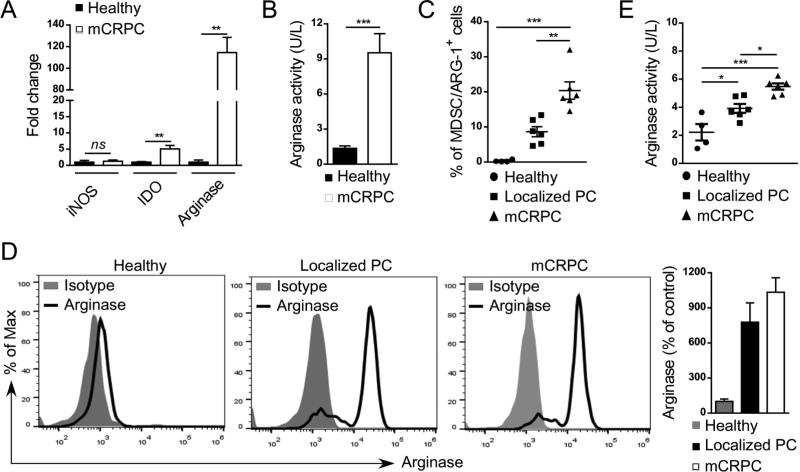
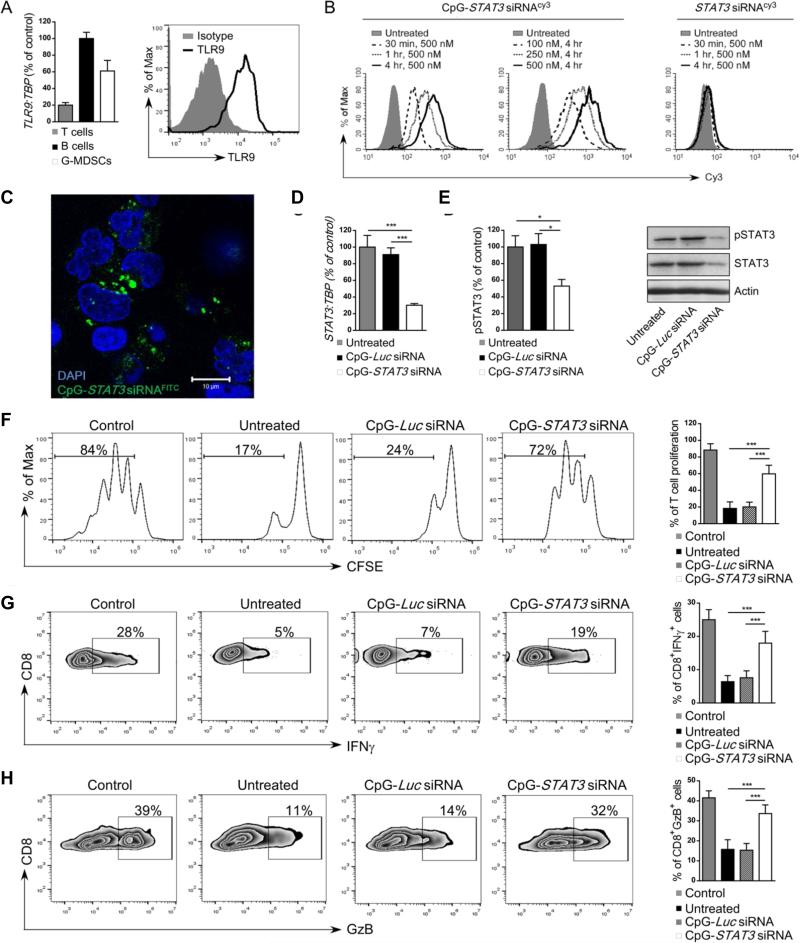
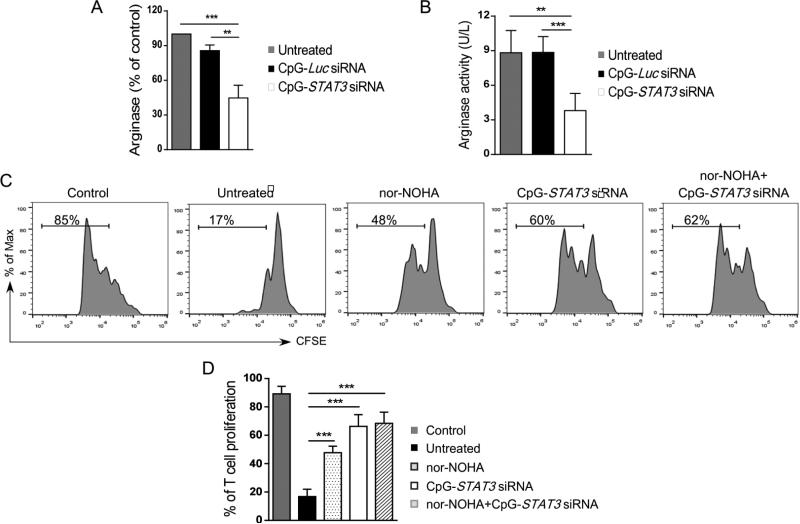
Results: Here, we identify a population of Lin(-)CD15(HI)CD33(LO) granulocytic MDSCs that accumulate in patients' circulation during prostate cancer progression from localized to metastatic disease. The prostate cancer-associated MDSCs potently inhibit autologous CD8(+) T cells' proliferation and production of IFNγ and granzyme-B. The circulating MDSCs have high levels of activated STAT3, which is a central immune checkpoint regulator. The granulocytic pSTAT3(+) cells are also detectable in patients' prostate tissues. We previously generated an original strategy to silence genes specifically in Toll-like Receptor-9 (TLR9) positive myeloid cells using CpG-siRNA conjugates. We demonstrate that human granulocytic MDSCs express TLR9 and rapidly internalize naked CpG-STAT3siRNA, thereby silencing STAT3 expression. STAT3 blocking abrogates immunosuppressive effects of patients-derived MDSCs on effector CD8(+) T cells. These effects depended on reduced expression and enzymatic activity of Arginase-1, a downstream STAT3 target gene and a potent T-cell inhibitor.

Conclusions: Overall, we demonstrate the accumulation of granulocytic MDSCs with prostate cancer progression and the feasibility of using TLR9-targeted STAT3siRNA delivery strategy to alleviate MDSC-mediated immunosuppression.


Figures

Figure 1
Figure 1. CD15HI myeloid cells accumulate in peripheral blood and tumor tissues in prostate cancer patients with disease progression
(A-B) Flow cytometric analysis of fresh PBMCs from healthy subjects and prostate cancer patients with localized or metastatic disease. Representative dot plots (A) and graphs combining data from all subjects (B) showing percentages of CD15HICD33LO or CD15LOCD33HI cells in prostate cancer patients’ circulation at localized prostate cancers (PC) (n = 11) or metastatic tumors (mCRPC) (n = 10) compared to healthy donors (n = 5). Shown are means ± SD. (C) Representative histograms showing expression of lineage markers (Lin = CD3/CD19/CD56), CD11b, CD14, HLA-DR and CD114 (G-CSFR) among CD15LOCD33HI (top row) and CD15HICD33LO (bottom row) cells. (D) Cellular morphology of sorted, cytospinned and stained CD15HICD33LO or CD15LOCD33HI myeloid cells. Representative microphotographs showing monocytic (top) and granulocytic polymorphonuclear (PMN) phenotype (bottom) of CD15HICD33LO and CD15LOCD33HI cells, respectively. (E) CD15+ cells in cancer patients’ prostate tissues have granulocytic and PMN phenotype. Representative results of immunohistochemical staining on FFPE sections from two different patients (top and bottom); scale bar = 100 μm. (F) Mature CD16HI neutrophils are only minor fraction of circulating CD15HICD33LO cells in prostate cancer patients. The expression of CD16 was assessed on granulocytic cells from healthy subjects or prostate cancer patients. Shown are representative dot plot graphs (two left panels) and the summary of results from six different patients (right bar graph); means ± SD (n = 6). (G) Plasma levels of G-CSF and several other growth factors/chemokines increase with prostate cancer progression in contrast to reduced levels of proinflammatory IFNα. Luminex-based analysis of plasma samples from prostate cancer patients with localized (n = 25) or metastatic tumors (n = 15) compared to healthy individuals (n = 4). Statistically significant differences were indicated by asterisks; means ± SD.
Figure 2
Figure 2. CD15HI MDSCs isolated from prostate cancer patients inhibit proliferation and activity of autologous T cells
(A-C) CD15+CD14 granulocytic and CD15CD14+ monocytic cell populations freshly enriched from metastatic prostate cancer patients’ PBMCs were cultured separately with 24 autologous T cells in presence of CD3-/ CD28-specific antibodies for stimulation. (A) Representative flow cytometry data showing T cell proliferation assessed by CFSE dilution after 3 days of co-culture. (B) Combined results of T cell proliferation assays from 5 patients showing percentage of total T cell proliferation at different T: myeloid cell ratios. (C) Proliferation of CD4+ and CD8+ T cells when incubated at 1:1 ratio with or without the indicated myeloid cell populations; means ± SD (n = 5). (D-E) CD15+CD14 myeloid cells inhibit production of IFNγ and granzyme B by activated CD8+ T cells. T cells were co-cultured with either one of myeloid cell populations at 1:1 ratio as above. The intracellular levels of IFNγ and granzyme B were measured using flow cytometry. Representative dot plots and bar graphs showing percentages of CD8+IFNγ+ T cells (D) and CD8+Granzyme-B+ T cells (E) after 3 days of culture; shown are means ± SD (n = 5). Statistically significant differences were indicated by asterisks.
Figure 3
Figure 3. STAT3 activity is elevated in CD15HI MDSCs in prostate cancer patients
(A) Flow cytometric analysis of activated STAT3 (pSTAT3) in granulocytic MDSCs (CD15HICD33LO) from patients with localized (n = 6) and metastatic (n = 6) prostate cancers compared to granulocytes from healthy individuals (n = 5). Shown are representative histogram overlays and bar graph summary of data from all patients; average of mean fluorescence intensities (MFI) ± SD. (B) Prostate cancer patients’ granulocytic cells show increased STAT3 phosphorylation without changes in the total STAT3 protein levels. Western blotting analysis to compare pSTAT3 and total STAT3 protein levels in CD15+ CD14 cells isolated from PBMCs pooled from prostate cancer patients or healthy donors. (C) The percentage of MDSCs (CD15HICD33LO) with activated STAT3 increases with prostate cancer progression. Summary of results from all tested patients; statistically significant differences were indicated by asterisks. (D) Increased infiltration of pSTAT3-positive cells with granulocytic (PMN) morphology in prostate tissues from high-risk prostate cancer patients. FFPE tissue sections were stained using immunohistochemistry for pSTAT3 and analyzed using bright field microscopy. Arrows indicate pSTAT3+ PMN cells accumulating within capillaries and venules (top) and involving the glandular lumen (bottom). Shown are representative images from two of ten analyzed specimens; scale bars = 100 μm.
Figure 4
Figure 4. The percentage of arginase-expressing MDSCs increases with prostate cancer progression
(A, B) Arginase 1 expression and activity is highly elevated in G-MDSCs from mCRPC patients. Levels of ARG1 mRNA in comparison to IDO and iNOS transcripts (A) as well as intracellular activity of Arginase 1 (B) were assessed in CD15+CD14 G-MDSCs using real-time qPCR and QuantiChrom™ assays, respectively. Shown are means ± SD (n = 4). (C) Prostate cancer progression correlates with increase in the percentage of arginase-expressing CD15HICD33LO G-MDSCs. Flow cytometric analysis comparing PBMCs from healthy individuals (n = 4) with prostate cancer patients with localized disease (n = 6) or mCRPCs (n = 6); means ± SD. (D) High intracellular levels of arginase expression in G-MDSCs from prostate cancer patients compared to granulocytes from healthy subjects as assessed using flow cytometry. Representative histograms (three left panels) and bar graph combining all data (right) from one of three experiments are shown; means ± SD. (E) Plasma levels of arginase activity increase with disease progression as measured in blood samples from in healthy individuals (n = 4), prostate cancer patients with localized (n = 6) and metastatic disease (n = 6); means ± SD. Statistically significant differences were indicated by asterisks.
Figure 5
Figure 5. Targeted STAT3 silencing using CpG-STAT3siRNA strategy abrogates immunosuppressive activity of granulocytic MDSCs
(A) CD15HICD33LO G-MDSCs express TLR9 at mRNA or protein levels as assessed by using real-time qPCR (left) or flow cytometry (right), respectively. CD19+ B cells and CD3+ T cells were used as positive and negative controls for qPCR analysis (left), respectively. (B) Dose- and time-dependent internalization of CpG-STAT3 siRNA by CD15HICD33LO MDSCs. PBMCs from prostate cancer patients were incubated with fluorescently-labeled CpG-STAT3 siRNACy3 conjugate or unconjugated STAT3 siRNACy3 for the indicated times and doses without any transfection reagents. Percentages of Cy3+ CD15HICD33LO MDSCs were assessed by flow cytometry; shown are representative results from one of three experiments. (C) STAT3 siRNA localizes to perinuclear/cytoplasmic cell compartment shortly after internalization. G-MDSCs (CD15+CD14) enriched from mCRPC patient were incubated with 500 nM CpG-STAT3siRNAFITC for 1 h. The localization of the labeled siRNA part of the conjugate was assessed using confocal microscopy; scale bar = 10 μm. (D-E) CpG-STAT3 siRNA induces STAT3 silencing in fresh granulocytic MDSCs. The G-MDSCs enriched from prostate cancer patients’ PBMCs were treated with 500 nM CpG-STAT3 siRNA or CpG-Luc siRNA, used a s a negative control, for 48 h. The level of STAT3 inhibition was measured at mRNA level (D) using real time qPCR or at protein level using flow cytometry (E, left) or western blotting (E, right) after staining with antibodies specific to pSTAT3 and/or total STAT3. Statistically significant differences were indicated by asterisks; shown are means ± SD (n = 5). (F-H) CD15+CD14 MDSCs isolated from prostate cancer patients were treated with CpG-STAT3 siRNA or control CpG-Luc siRNA for 18 h and then co-cultured with autologous CD3+ T cells at 1:1 ratio with anti-CD3/CD28 stimulation. (F) T cell proliferation was determined by CFSE dilution assay after 72 h of co-culture with fresh MDSC. Under same experimental conditions percentages of IFNγ- (G) or Granzyme B- (H) producing CD8+ T cells were assessed using flow cytometry. Shown are representative data from one of two experiments (left four panels) and bar graphs (right panel) combining results from analyses of 5 individual patients’ samples; means ± SD. Statistically significant differences were indicated by asterisks.
Figure 6
Figure 6. CpG-STAT3 siRNA blocks arginase expression and inhibits functions of granulocytic MDSCs
(A, B) STAT3 targeting using CpG-siRNA strategy inhibits arginase expression and activity in granulocytic MDSCs. Levels of arginase mRNA (A) and enzymatic activity (B) were assessed in cell lysates using qPCR and QuantiChrom™ assays, respectively, in CD15+CD14 granulocytic MDSCs after 48 h incubation with CpG-STAT3 siRNA, CpG-Luc siRNA or without any treatment. (C, D) Selective STAT3 inhibition alleviates immunosuppressive effect of MDSCs to greater extent than arginase inhibitor (nor-NOHA). Representative data from one of two experiments (C) and the summary of T cell proliferation assays (D) co-cultured in the presence or absence of MDSCs, nor-NOHA (20μM) and the indicated CpG-siRNAs (500 nM). Shown are means ± SD (n = 5). Statistically significant differences were indicated by asterisks.

References

    1. Jemal A, Siegel R, Xu J, Ward E. Cancer statistics, 2010. CA: a cancer journal for clinicians. 2010;60:277–300. - PubMed
    1. de Bono JS, Oudard S, Ozguroglu M, Hansen S, Machiels JP, Kocak I, et al. Prednisone plus cabazitaxel or mitoxantrone for metastatic castration-resistant prostate cancer progressing after docetaxel treatment: a randomised open-label trial. Lancet. 2010;376:1147–54. - PubMed
    1. Kantoff PW, Higano CS, Shore ND, Berger ER, Small EJ, Penson DF, et al. Sipuleucel-T immunotherapy for castration-resistant prostate cancer. N Engl J Med. 2010;363:411–22. - PubMed
    1. Whiteside TL. Inhibiting the inhibitors: evaluating agents targeting cancer immunosuppression. Expert opinion on biological therapy. 2010;10:1019–35. - PMC - PubMed
    1. May KF, Jr., Gulley JL, Drake CG, Dranoff G, Kantoff PW. Prostate Cancer Immunotherapy. Clin Cancer Res. 2011;17:5233–38. - PMC - PubMed

Publication types

MeSH terms