. 2015 May 13:6:6833.
doi: 10.1038/ncomms7833.

Recovery from severe H7N9 disease is associated with diverse response mechanisms dominated by CD8⁺ T cells

Affiliations

Recovery from severe H7N9 disease is associated with diverse response mechanisms dominated by CD8⁺ T cells

Zhongfang Wang et al. Nat Commun. .

Abstract

The avian origin A/H7N9 influenza virus causes high admission rates (>99%) and mortality (>30%), with ultimately favourable outcomes ranging from rapid recovery to prolonged hospitalization. Using a multicolour assay for monitoring adaptive and innate immunity, here we dissect the kinetic emergence of different effector mechanisms across the spectrum of H7N9 disease and recovery. We find that a diversity of response mechanisms contribute to resolution and survival. Patients discharged within 2-3 weeks have early prominent H7N9-specific CD8(+) T-cell responses, while individuals with prolonged hospital stays have late recruitment of CD8(+)/CD4(+) T cells and antibodies simultaneously (recovery by week 4), augmented even later by prominent NK cell responses (recovery >30 days). In contrast, those who succumbed have minimal influenza-specific immunity and little evidence of T-cell activation. Our study illustrates the importance of robust CD8(+) T-cell memory for protection against severe influenza disease caused by newly emerging influenza A viruses.


Conflict of interest statement

The authors declare no competing financial interests.

Figures

Figure 1
Figure 1. Elevated IFN-γ-producing CD8+, CD4+ and NK responses in the H7N9 recovery patient group.
H7N9-specific (a) CD8+, (b) CD4+ and (c) NK cells but not (d) NAbs are significantly increased in patients who survived (n=12) when compared with individuals who died (n=4) from the severe influenza disease, as detected by IFN-γ ICS following 18-h stimulations with A/H7N9 virus. The comparison of the highest numbers of CD8+, CD4+, NK and NAbs during the disease course of each patient between survival and fatal groups was performed using Mann–Whitney test.
Figure 2
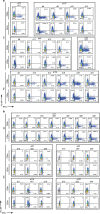
Figure 2. Kinetics of CD8+ and CD4+ T-cell responses in H7N9-infected patients.
The frequency of H7N9-specific CD8+ (the upper row of each group) and CD4+ (the lower row of each group) T cells was determined by intracellular IFN-γ staining after stimulation of PBMCs with the A/Shanghai/H7N9/1 virus at MOI=4, at various time points after the onset of clinical symptoms. The patients were divided into three recovery groups, R1 (recovered d14–d18), R2 (recovered d21–d27), R3 (recovered d31–d35) and RD (the fatal outcome group), based on illness duration, hospital stay and disease outcome. H7N9 infection of CD8+ T cells was detected by the intracellular staining with the nucleoprotein-fluorescein isothiocyanate antibody to IAV-nucleoprotein.
Figure 3
Figure 3. Multiparameter analysis of CD8+ T cells, CD4+ T cells, NK responses, antibody levels and the infection of cellular subsets in H7N9 patients.
Kinetics of H7N9-specific CD8+, CD4+, NK and NAb responses are shown for (ad) patient groups and (ei) individual patients. Kinetics of IFN-γ-producing CD8+, CD4+ and NK responses are shown as (ac) absolute numbers or (eg) as frequencies, % IFN-γ-producing (e) CD8+ T cells of total CD8+ T cells, (f) CD4+ T cells of total CD4+ T cells and (g) NK cells of total NK cells. (h) Individual kinetics of NAbs during the disease course. (ik) Infection level of CD8+, CD4+ and NK cells during the disease course detected by in vitro culture with H7N9 is shown. (l) Kinetics of plasma IL-8 during the disease course in individual patients, and the comparison of (m) viral load and (n) total serum cytokine with a disease outcome.
Figure 4
Figure 4. Phenotype of A*0201-M158+-specific CD8+ T cells.
PBMCs obtained from two HLA-A*0201+ patients (a) a10 (R1) and (b,c) a79 (R3) were stained with tetrameric complexes specific for the HLA-A*0201-M158 epitope and a panel of mAbs against CD45RA, CD27, CD3, CD4 and CD8. (a,b) Comparable frequencies of influenza-specific CD8+ T-cell responses are shown by the H7N9-specific IFN-γ-based assay and the A*0201-M158 tetramer staining. (c) The phenotype A*02:01-M158+CD8+ T cells has been assessed on the basis of the expression of CD45RA and CD27. The absolute numbers of A*02:01-M158+ CD8+ T cells are indicated in brackets (in per million PBMC). Cells were gated on dead cell markerCD3+CD4CD8+.
Figure 5
Figure 5. Proposed model of sequential recruitment of immune effectors during severe H7N9 disease.
The absolute numbers of H7N9-specific IFN-γ-producing CD8+ T cells (red symbols), CD4+ T cells (blue symbols), NAbs (grey symbols) and NK cells (green symbols) are shown across different patient recovery (R1–R3) and fatality (RD) groups. (a) Least square polynomial regression was used to calculate and model the absolute numbers for H7N9-specific IFN-γ-producing CD8+ T cells, CD4+ T cells, antibodies NAbs and NK cells. The mean data are shown for each group and ‘No virus control’ values were subtracted. For NK cells in R3, three data points fall outside the scale (d26: value of 9,044; d29: value of 5,375; d30: value of 8,161). (b) Schematic representation of the immune cell sets important for the recovery from H7N9 across patient groups is shown.
Figure 6
Figure 6. Transcriptomic analysis confirms increased cellular activation in the patient recovery group.
(a) Principal components analysis shows clear global transcriptional differences between the recovery (blue) and fatal (red) patient groups along PC1. (b) A volcano plot showing substantial differential gene probe set expression between recovery and fatal patient groups with similar numbers of probes up- or downregulated. (c) A heatmap showing the diversity of expression patterns for hierarchically clustered gene probes (rows; BH-adjusted P value<0.05 and log fold change>2.0) versus patients (columns) from the fatal and recovery groups. (d) Significantly enriched KEGG pathways among the differentially expressed probes, together with their corresponding gene annotations. (e) A schematic of the most significantly enriched KEGG pathway for TCR signalling, with genes harbouring at least one differentially expressed probe marked with red.

References

    1. Gao R. et al.. Human infection with a novel avian-origin influenza A (H7N9) virus. N. Engl. J. Med. 368, 1888–1897 (2013). - PubMed
    1. Yu H. et al.. Human infection with avian influenza A H7N9 virus: an assessment of clinical severity. Lancet 382, 138–145 (2013). - PMC - PubMed
    1. Chen Y. et al.. Human infections with the emerging avian influenza A H7N9 virus from wet market poultry: clinical analysis and characterisation of viral genome. Lancet 381, 1916–1925 (2013). - PMC - PubMed
    1. Wang Z. et al.. Early hypercytokinemia is associated with interferon-induced transmembrane protein-3 dysfunction and predictive of fatal H7N9 infection. Proc. Natl Acad. Sci. USA 111, 769–774 (2014). - PMC - PubMed
    1. Chen Y. et al.. Dynamic behavior of lymphocyte subgroups correlates with clinical outcomes in human H7N9 infection. J. Infect. 69, 358–365 (2014). - PubMed

Publication types

MeSH terms