. 2015 May 13:6:7095.
doi: 10.1038/ncomms8095.

Reinforcement of STAT3 activity reprogrammes human embryonic stem cells to naive-like pluripotency

Affiliations

Reinforcement of STAT3 activity reprogrammes human embryonic stem cells to naive-like pluripotency

Hongwei Chen et al. Nat Commun. .

Abstract

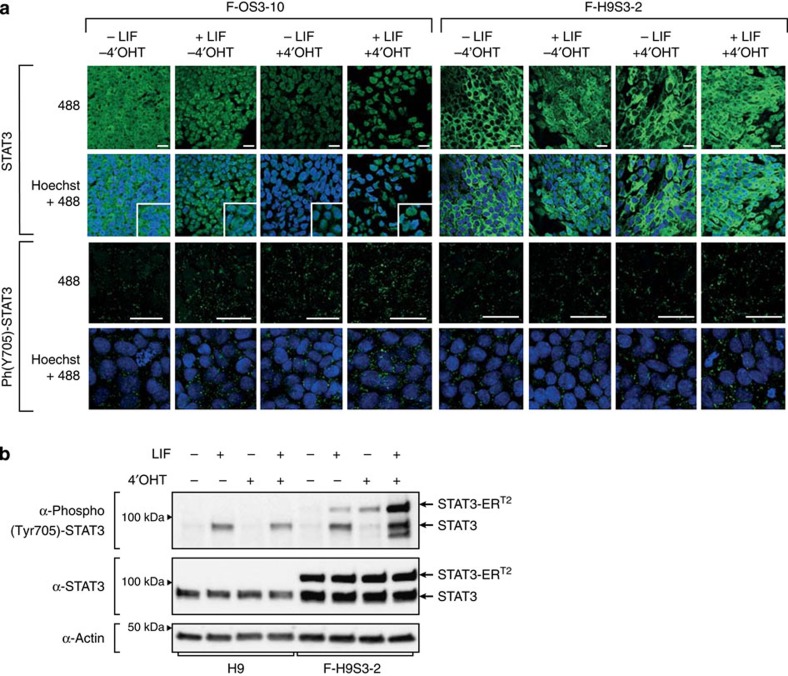
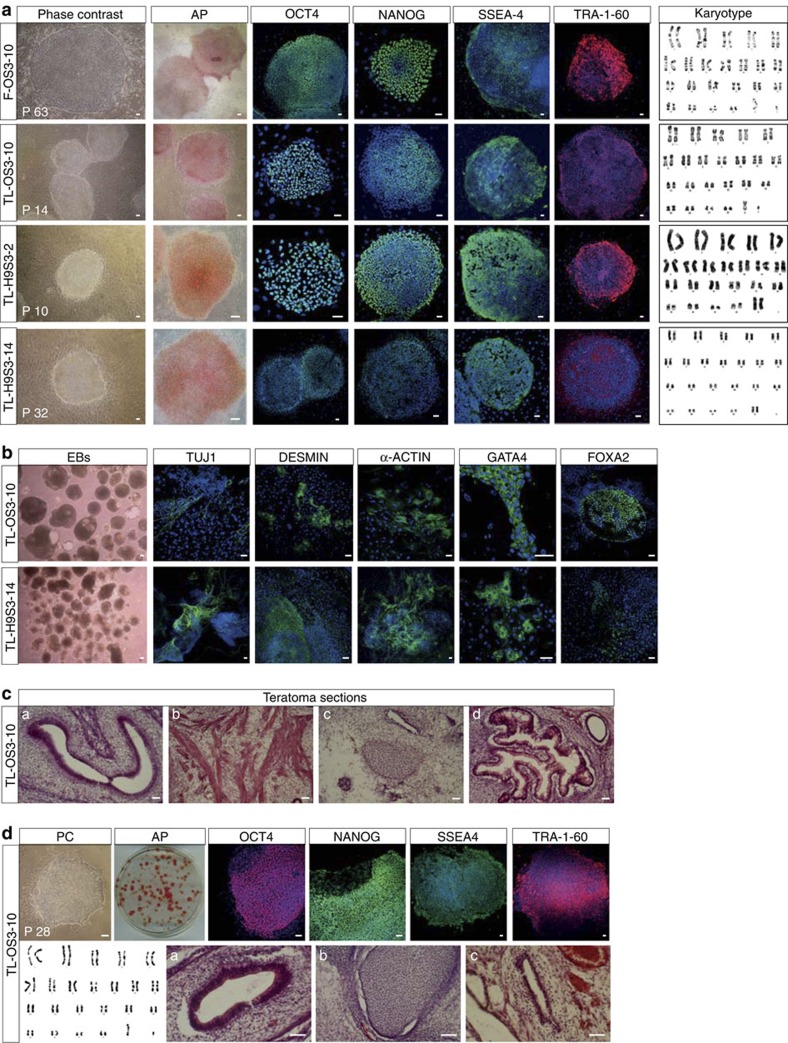
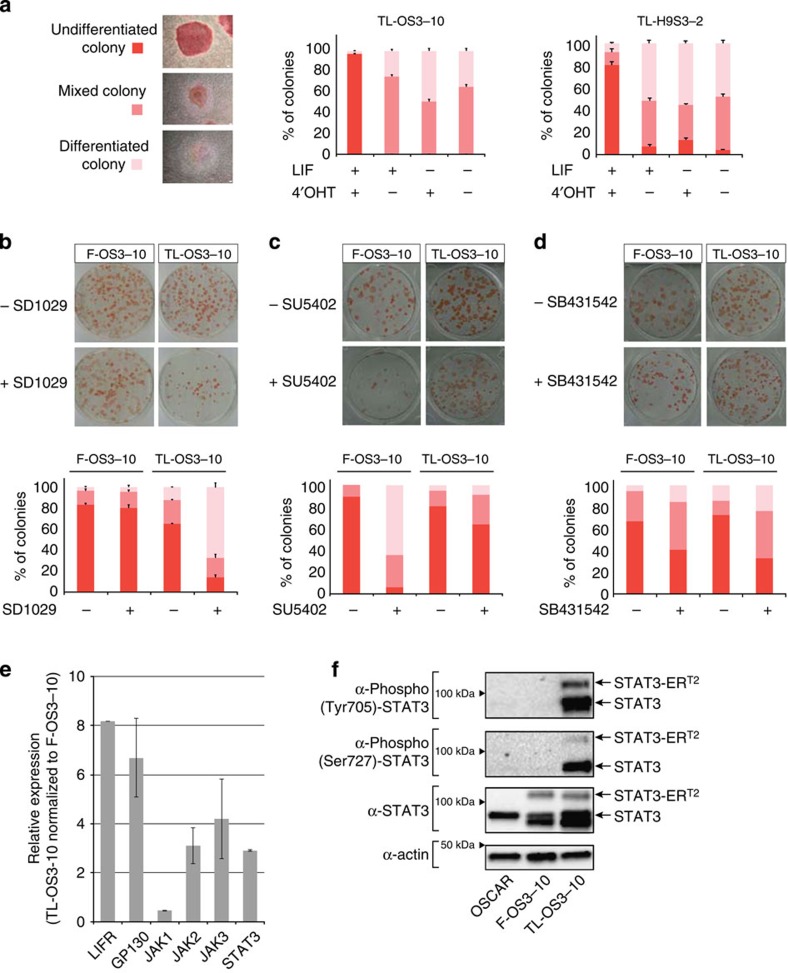
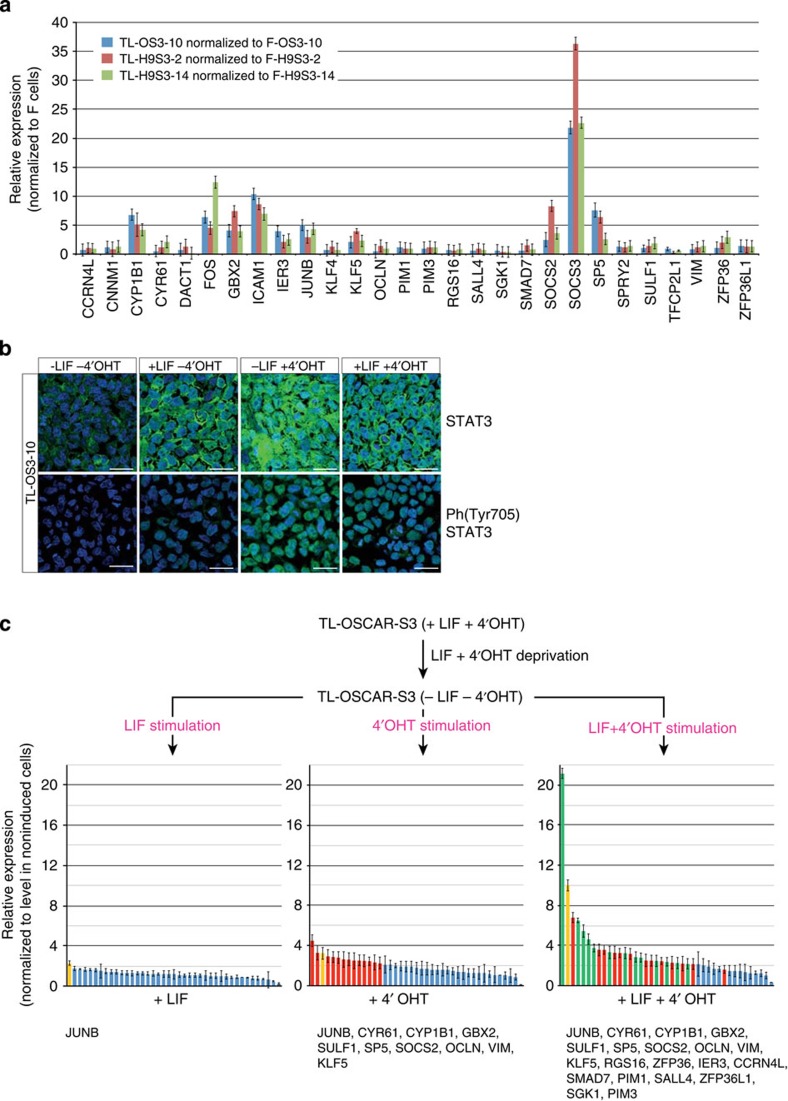
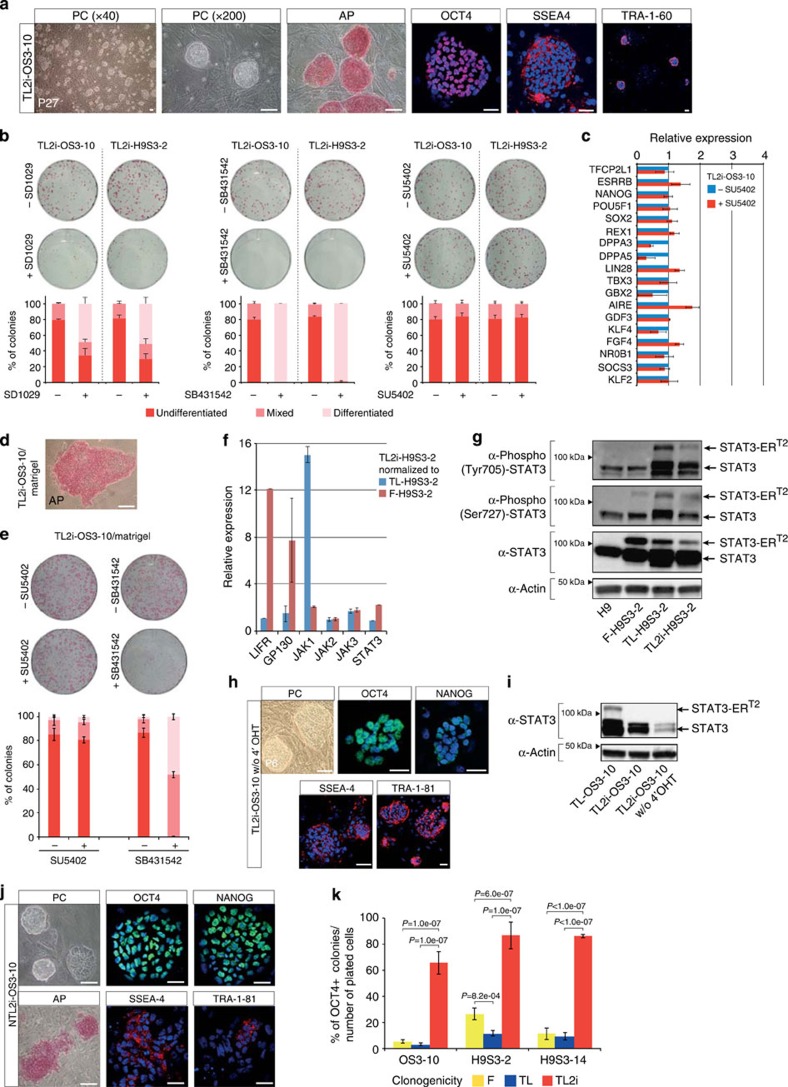
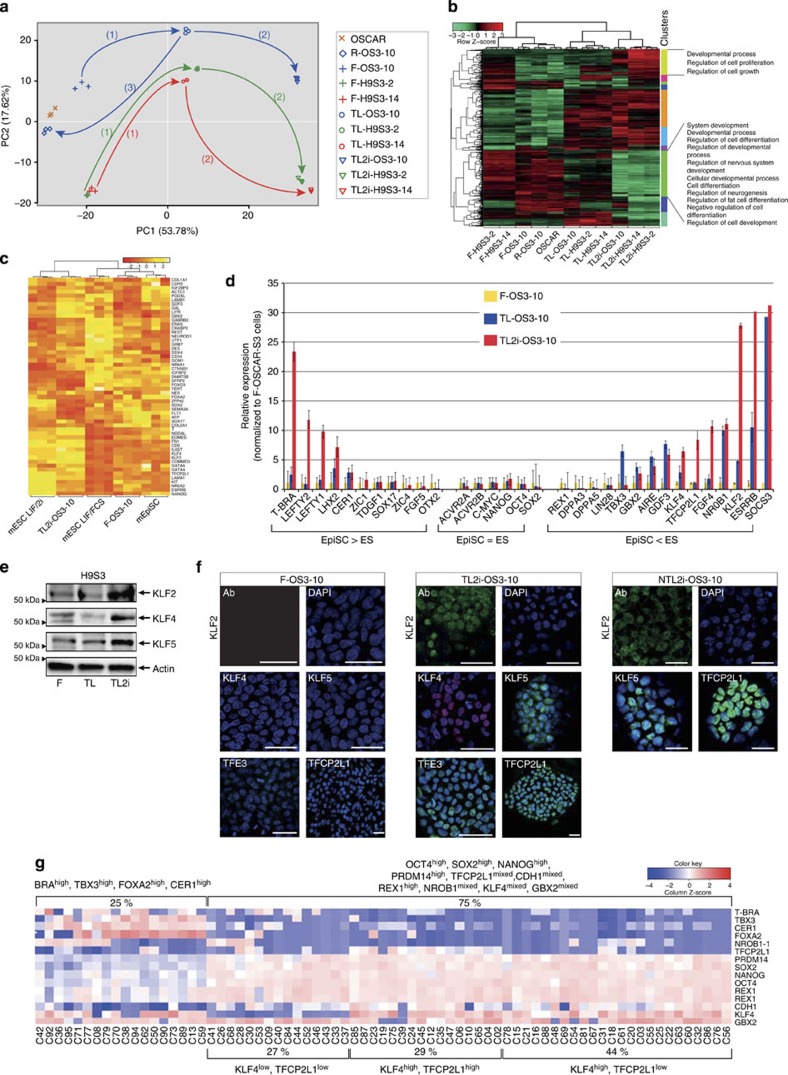
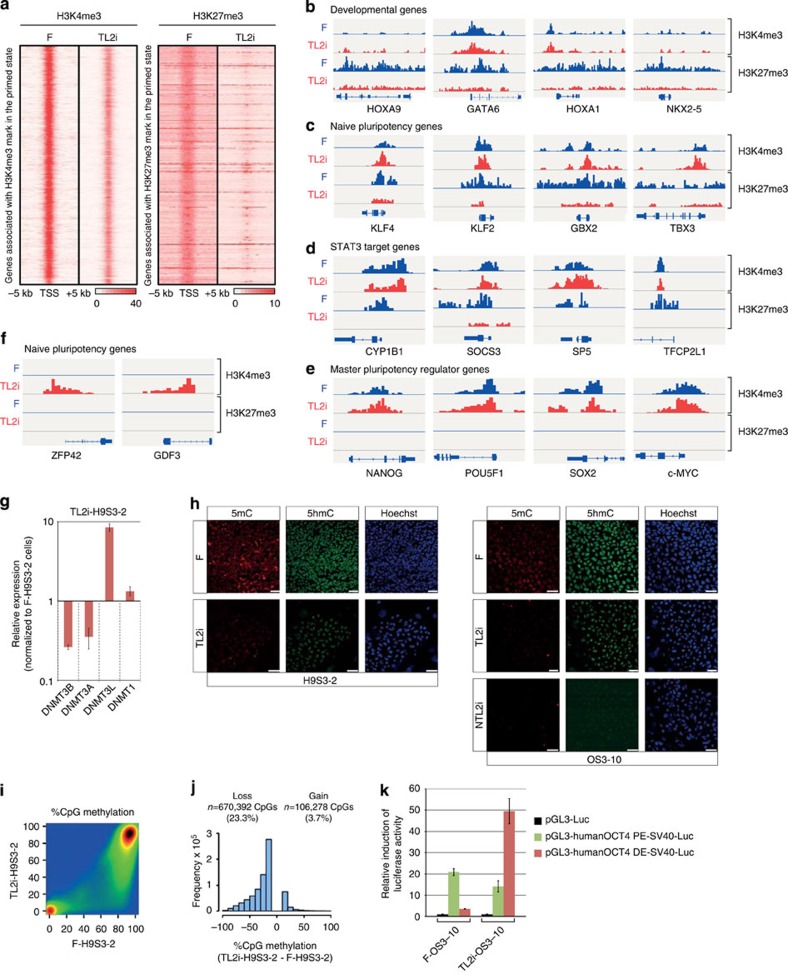
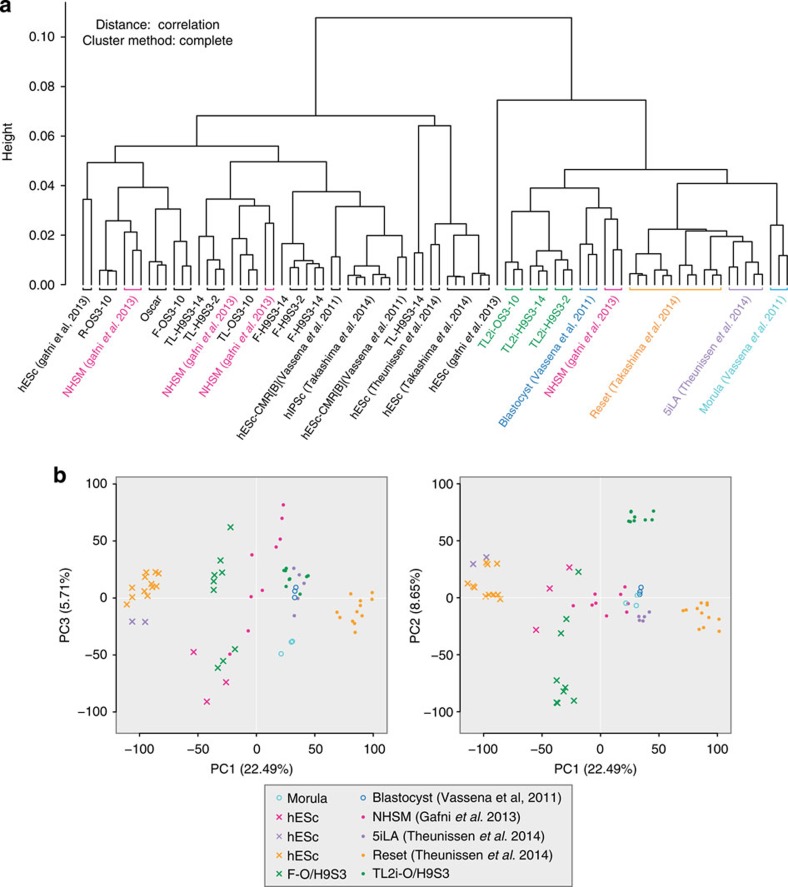
Leukemia inhibitory factor (LIF)/STAT3 signalling is a hallmark of naive pluripotency in rodent pluripotent stem cells (PSCs), whereas fibroblast growth factor (FGF)-2 and activin/nodal signalling is required to sustain self-renewal of human PSCs in a condition referred to as the primed state. It is unknown why LIF/STAT3 signalling alone fails to sustain pluripotency in human PSCs. Here we show that the forced expression of the hormone-dependent STAT3-ER (ER, ligand-binding domain of the human oestrogen receptor) in combination with 2i/LIF and tamoxifen allows human PSCs to escape from the primed state and enter a state characterized by the activation of STAT3 target genes and long-term self-renewal in FGF2- and feeder-free conditions. These cells acquire growth properties, a gene expression profile and an epigenetic landscape closer to those described in mouse naive PSCs. Together, these results show that temporarily increasing STAT3 activity is sufficient to reprogramme human PSCs to naive-like pluripotent cells.


Figures

Figure 1
Figure 1. Reinforcement of STAT3 activity in F-OS3 and F-H9S3 cells.
(a) Immunofluorescence labelling of F-OS3–10 and F-H9S3-2 cells with antibodies to STAT3 and phospho-STAT3 (Tyr705), without stimulation of LIF and 4′-OHT (−LIF −4′-OHT), after stimulation with LIF (+LIF −4′-OHT), with 4′-OHT (−LIF +4′-OHT) and with both (+LIF+4′-OHT). Scale bar, 30 μm. One representative experiment of two repeats is shown. (b) Western blot analysis of STAT3, phospho-(Tyr705)-STAT3 expression in H9 and F-H9S3-2 cells after stimulation with 10,000 U ml−1 LIF, 250 nM 4′-OHT, or both for 1 h. One representative experiment of three repeats is shown.
Figure 2
Figure 2. LIF and hormone-dependent STAT3 sustain self-renewal and maintain pluripotency of TL-OS3 and TL-H9S3 cells.
(a) Characterization of F-OS3–10, TL-OS3–10, TL-H9S3-2 and TL-H9S3–14 cell lines by phase-contrast microphotography, AP staining, G-band karyotyping and immunofluorescence labelling with antibodies to OCT4, NANOG, TRA-1–60 and SSEA4. G-band karyotyping was performed on P39 (F-OS3–10), P12 (TL-OS3–10) and P5 (TL-H9S3-2 and TL-H9S3–14). (b) Immunofluorescence labelling of TL-OS3–10 and TL-H9S3–14 cells with antibodies to TUJ1 (neurons), DESMIN (muscle), α-ACTIN (heart), FOXA2 and GATA4 (endoderm) after differentiation as induced by the formation of EBs. (c) Teratoma formation with the TL-OS3–10 cells. Haematoxylin and eosin (H&E) staining showing neurectodermal (a), cartilage (b), muscle (c) and gut-like structures (d) (n=6 testes). (d) Characteristics of TL-OS3–10 cells after propagation on gelatin without MEF; PC, phase-contrast microphotograph of an undifferentiated colony; AP, alkaline phosphatase activity; immunofluorescence labelling with antibodies to OCT4, NANOG, SSEA4 and TRA-1–60; karyotype at P41; teratoma sections showing neuroepithelium (a), cartilage (b) and gland structure (c). Scale bar, 50 μm (n=4 testes).
Figure 3
Figure 3. Signalling pathways in TL cells.
(a) A colony-forming assay with TL-OS3–10 and TL-H9S3-2 cells. Cell clumps were plated in a medium supplemented with LIF, 4′-OHT, or both, and cultivated for 5 days. After staining to reveal AP activity, the colonies were scored and the percentage of undifferentiated, mixed and differentiated colonies was calculated. n=3; error bars indicate the mean ±s.d. (bd) The colony-forming assay with F-OS3–10 and TL-OS3–10 cells (representative experiment). Cell clumps were plated in a medium supplemented with pharmacological inhibitors of JAK2 (SD1029 at 10 μM), FGFR (SU5402 at 25 μM) and SMADs (SB431542 at 10 μM), and cultivated for 5 days with FGF2 (F-OS3–10) and 3 days with LIF+4′-OHT (TL-OS3–10). Upper panels: staining to reveal AP activity; Bottom panels: histograms showing the percentage of undifferentiated, mixed and differentiated colonies (n=3; error bars indicate the mean±s.e.m.). (e) Reverse transcriptase–qPCR analysis of LIFR, GP130, JAK and STAT3 expression in TL-OS3–10 versus F-OS3–10 cells. (f) Western blot analysis of STAT3 and STAT3-ERT2 expression in OSCAR, F-OS3–10 and TL-OS3–10 cells, analysed with antibodies to total STAT3, phospho-(Tyr705)-STAT3 and phospho-(Ser727)-STAT3. One representative experiment of three repeats is shown.
Figure 4
Figure 4. Activation of STAT3 target genes in TL cells.
(a) Histogram representation of the messenger RNA level (ΔCt) of STAT3 target genes in F-OS3–10, F-H9S3-2, F-H9S3–14, TL-OS3–10, TL-H9S3-2 and TL-H9S3–14 after normalization to β-actin (ΔCt=1; n=3, mean±s.d.). (b) Immunofluorescence labelling of TL-OS3–10 cells with antibodies to STAT3 and phospho-(Y705)-STAT3, after LIF and 4′-OHT starvation (−LIF −4′-OHT) and after stimulation with LIF (+LIF −4′-OHT), with 4′-OHT (−LIF +4′-OHT) and with both (+LIF +4′-OHT). Scale bar, 30 μm. One representative experiment of two repeats is shown. (c) Histogram representation of the mRNA level (ΔCt) of STAT3 target genes in TL-OS3–10 cells after LIF+4′-OHT starvation for 24 h and re-stimulation with 10,000 U ml−1 LIF, 250 nM 4′-OHT, or both for 2 h. One gene, shown in yellow, is activated by LIF stimulation (>2-fold). Following stimulation with 4′-OHT, 13 additional genes (shown in red) are activated (>2-fold). Following stimulation with both LIF and 4′-OHT, 13 additional genes (shown in green) are activated (>2-fold). All ΔCt were normalized to GAPDH (ΔCt=1; n=3, mean±s.d.).
Figure 5
Figure 5. Signalling pathways in TL2i cells.
(a) Phase-contrast microphotographs, AP activity and immunofluorescence labelling of OCT4, SSEA4 and TRA-1–60 in TL2i cells. (b) A colony-forming assay with TL2i-OS3–10 and TL2i-H9S3-2 cells (representative experiment). Cell clumps were plated in TL2i medium supplemented with pharmacological inhibitors of JAK2 (SD1029 at 10 μM), FGFR (SU5402 at 10 μM) and SMADs (SB431542 at 10 μM), and cultivated for 5 days. Upper panels: staining to reveal AP activity; bottom panels: histograms showing the percentage of undifferentiated, mixed and differentiated colonies. (n=3; error bars indicates the mean±s.e.m.). (c) Histogram representation of the mRNA level (ΔCt) of pluripotency genes in TL2i-OS3–10 cells before and treatment with FGFR inhibitor SU5402 for 5 days after normalization to GAPDH (ΔCt=1). (n=3, mean±s.d.). (d) Characteristics of TL2i-OS3–10 cells after propagation on Matrigel without MEF; AP, alkaline phosphatase activity. (e) Histograms showing the percentage of undifferentiated, mixed and differentiated colonies (n=3; error bars indicate the mean±s.e.m.) in a colony-forming assay with TL2i-OS3–10 cells (representative experiment). Cell clumps were plated in a medium supplemented with pharmacological inhibitors of FGFR (SU5402 at 10 μM) and SMADs (SB431542 at 10 μM), and cultivated for 5 days with LIF+4′-OHT. (f) Histogram representation of the mRNA level (ΔCt) of LIFR, GP130, JAK and STAT3 genes in TL2i-H9S3-2 cells, after normalization to GAPDH (ΔCt=1), then to TL-H9S3-2 (blue bars) and F-H9S3-2 cells (red bars). (n=3, mean±s. d.). (g) Western blot analysis of STAT3 and STAT3-ERT2 expression in OSCAR, F-H9S3-2, TL-H9S3-2 and TL2i-H9S3-2 cells, analysed with antibodies to total STAT3, phospho-(Tyr705)-STAT3 and phospho-(Ser720)-STAT3. One representative experiment of three repeats is shown. (h) Phase-contrast microphotographs (PC) and immunofluorescence labelling of OCT4, NANOG, SSEA4 and TRA-1–81 in TL2i-OS3–10 cells after culturing in 2i/LIF medium without 4′-OHT for 30 passages. (i) Western blot analysis of STAT3 and STAT3-ERT2 expression in TL-OS3–10 cells and TL2i-OS3–10 cells (+/−4′-OHT), analysed with antibodies to total STAT3. One representative experiment of two repeats is shown. (j) Phase-contrast microphotographs (PC), AP detection and immunofluorescence labelling of OCT4, NANOG, TRA-1–81 and SSEA4 in TL2i-OS3–10 cells after culturing in N2B27+2i/LIF basal medium for eight passages. (k) Histogram representation of the cloning efficiency of F, TL and TL2i cells (OS3–10, H9S3–2 and H9S3–14 lines) after single-cell dissociation with 0.05% trypsin-EDTA and re-plating on feeders in the presence of 10 μM ROCK inhibitor Y-27632 for 24 h post dissociation. Tukey's test; n=3; error bars indicate the mean±s. e. Scale bar, 50 μm (a,d,h,i).
Figure 6
Figure 6. Transcriptome reconfiguration towards naive pluripotency.
(a) Graphical representation of the first principal component of PCA for OSCAR, F-OS3–10, F-H9S3-2, F-H9S3–14, TL-OS3–10, TL-H9S3-2, TL-H9S3–14, TL2i-OS3–10, TL2i-H9S3-2, and TL2i-H9S3–14 populations based on the transcriptome data; (1) conversion from F to TL state; (2) conversion from TL to TL2i state; (3) conversion from TL to R state. (b) Hierarchical clustering and heatmap of transcriptome data (mean values/cell category most differentially expressed 1,000 probe sets) using Pearson correlation coefficient as a measure of distance between rows and Spearman correlation coefficient as a measure of distance between columns. (c) Non-supervised cross-species comparison of the transcriptome of mESCs cultivated in conventional medium (FCS+LIF) and 2i/LIF medium, mouse EpiSCs, F-OS3–10 and TL2i-OS3–10 cells. (d) Histogram representation of the mRNA level (ΔCt) of pluripotency and lineage marker genes in F-OS3–10, TL-OS3–10 and TL2i-OS3–10 after normalization to GAPDH (ΔCt=1). EpiSC>ES indicates genes that are overexpressed in mouse epiblast stem cells (mEpiSCs) compared with mESCs; EpiSC=ES indicates genes that are equally expressed in mEpiSCs and mESCs; EpiSC<ES indicates genes that are overexpressed in mESCs compared with mEpiSCs. (n=3, mean±s.d.). (e) Western blot analysis of KLF2, KLF4 and KLF5 expression in TL2i-H9S3-2 cells. One representative experiment of two repeats is shown. (f) Immunofluorescence labelling of F-OS3–10 and TL2i-OS3–10 cells with antibodies to KLF2, KLF4, KLF5, TFE3 and TFCP2L1, and NTL2i-OS3–10 cells with antibodies to KLF2, KLF5 and TFCP2L1. (g) Representative heatmap of normalized Fluidigm data for TL2i-OS3–10 cells. Each column corresponds to a single cell, whereas rows correspond to genes. Blue and red gradations highlight downregulated and upregulated genes, respectively, in relation to a random pool of TL2i-OS3–10 cells.
Figure 7
Figure 7. Epigenetic reorganization.
(a) Density maps of H3K4me3 (left) and H3K27me3 (right) at loci identified as bivalent in primed hESCs (F-H9S3) and TL2i-H9S3 hESCs. (bf) Chromatin landscape of (b) bivalent developmental genes HOXA9, GATA6, HOXA1 and NKX2-5. (c) Naive pluripotency genes KLF4, KLF2, GBX2 and TBX3. (d) STAT3 target genes CYP1B1, SOCS3, SP5 and TFCP2L1. (e) Core pluripotency factors NANOG, POU5F1, SOX2 and MYC that harbour a decrease in H3K27me3 repressive marks in TL2i-H9S3 versus F-H9S3 cells. (f) Naive pluripotency genes REX1 (ZFP42) and GDF3 that harbour an increase of H3K4me3 mark in TL2i-H9S3 versus F-H9S3 cells. (g) Histogram representation of the mRNA level (ΔCt) of DNA methyltransferases DNMT3A, DNMT3B, DNMT3L and DNMT1 in TL2i-H9S3 versus F-H9S3 after normalization to GAPDH (ΔCt=1). (n=3, mean±s.d.). (h) Immunofluorescence labelling of F-H9S3, TL-H9S3, TL2i-H9S3, F-OS3, TL-OS3, TL2i-OS3 and TL2i-OS3 cells after propagation in N2B27 medium supplemented with 2i/LIF and 4′-OHT, with antibodies to 5mC and 5hmC. (i) Comparison of CpG methylation measured by RRBS in TL2i-H9S3-2 versus F-H9S3-2 cells. The graph shows a pairwise comparison of CpG methylation calculated in 400 bp tiles containing at least three CpGs with more than 8 × sequencing depth in both samples. The density of points increases from blue to dark red. (j) Density histogram showing the number of CpGs that lose or gain >10% methylation in TL2i-H9S3-2 compared with F-H9S3-2 cells. The figures above the graph indicate the number of CpGs and percentages compared with the total number of sampled CpGs (n=2,879,485). Sampled CpGs (23.3%) lose >10% methylation in TL2i-H9S3-2 versus F-H9S3-2 cells, whereas only 3.7% gain methylation. (k) Activity of the distal and proximal enhancer elements of the OCT4 promoter in TL2i-OS3–10 versus F-OS3–10 cells measured in a transient expression assay with the pGL3-humanOCT4 DE-SV40-Luc and pGL3-human OCT4 PE-SV40-Luc reporter plasmids. The histogram represents luciferase activity measured in the indicated cell types after normalization to Renilla luciferase activity and to firefly luciferase activity measured with the pGL3 empty plasmid (control). (n=3, mean±s.d.).
Figure 8
Figure 8. Transcriptome reconfiguration towards human embryo.
(a) Correlation clustering of transcriptome data for OSCAR, F-OS3–10, F-H9S3-2, F-H9S3–14, TL-OS3–10, TL-H9S3-2, TL-H9S3–14, TL2i-OS3–10, TL2i-H9S3–2, TL2i-H9S3–14, NHSM hESCs and hiPSCs, 5i/L/A hESCs, Reset hESCs, hESc-CMR[B], human morula and blastocyst. (b) Graphical representation of PCA calculated from the aforementioned compendium. Left panel: axis 1 and 3; right panel axis 1 and 2.

References

    1. Evans M. J. & Kaufman M. H. Establishment in culture of pluripotential cells from mouse embryos. Nature 292, 154–156 (1981). - PubMed
    1. Smith A. G. et al. Inhibition of pluripotential embryonic stem cell differentiation by purified polypeptides. Nature 336, 688–690 (1988). - PubMed
    1. Tesar P. J. et al. New cell lines from mouse epiblast share defining features with human embryonic stem cells. Nature 448, 196–199 (2007). - PubMed
    1. Brons I. G. et al. Derivation of pluripotent epiblast stem cells from mammalian embryos. Nature 448, 191–195 (2007). - PubMed
    1. Ying Q. L. et al. The ground state of embryonic stem cell self-renewal. Nature 453, 519–523 (2008). - PMC - PubMed

Publication types

MeSH terms