

Published Erratum
doi: 10.1186/s13059-015-0649-6.
Erratum to: DNA methylation age of human tissues and cell types
Affiliations
- PMID: 25968125
- PMCID: PMC4427927
- DOI: 10.1186/s13059-015-0649-6
Item in Clipboard
Published Erratum
Erratum to: DNA methylation age of human tissues and cell types
Genome Biol.
.
No abstract available
Figures
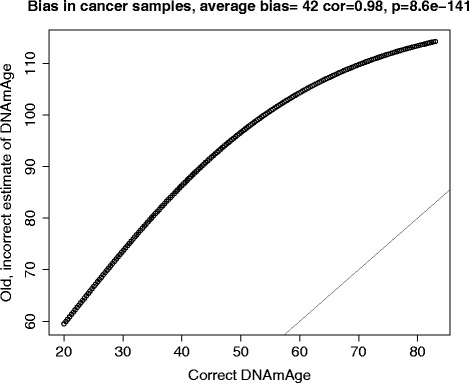
Evaluating the effect of the error on the DNAm age estimate in the cancer samples. The old, incorrect estimate of DNAm age (y-axis) versus the correct estimate (x-axis). Note that the two estimates are highly correlated (r = 0.98), which explains why most results are unaffected, but the old estimate is poorly calibrated, which leads to an average bias of 42 years. After using the correct estimate, I can no longer observe a positive age acceleration effect in cancer.
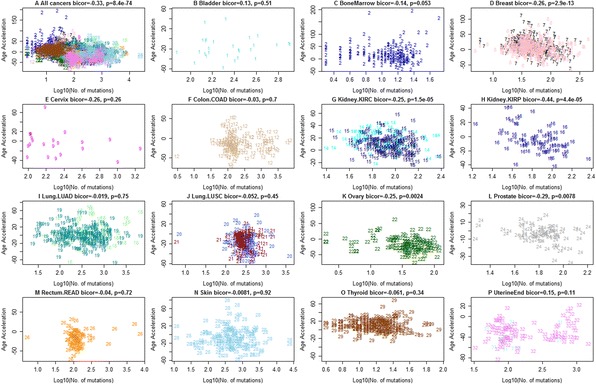
Age acceleration versus number of somatic mutations in the TCGA data. Mutation data from TCGA were used to count the number of mutations per cancer sample. A) Age acceleration versus (log transformed) mutation count per sample across all cancers. Note that this analysis is confounded by cancer/tissue type. B-P) A significant negative relationship between age acceleration and number of somatic mutations can be observed in the following seven affected tissues/cancers: C) bone marrow (AML), D) breast carcinoma (BRCA), G) kidney (KIRC), H) kidney (KIRP), K) ovarian cancer (OVAR), L) prostate (PRAD), and O) thyroid (THCA). No significant relationship could be found in the following six cancer types: F) colon carcinoma (COAD), I) lung adenocarcinoma (LUAD), J) lung squamous cell carcinoma (LUSC), P) uterine endometrioid, M) rectal cancer (READ), N) skin. Due to the low sample size, the results are inconclusive for B) bladder cancer and E) cervical cancer. Each point corresponds to a DNA methylation sample (cancer sample from a human subject) analogous to Additional file 1. The x-axis reports the log transformed (base 10) number of mutations observed per sample. The figure titles report the biweight midcorrelation, which is a robust measure of correlation.
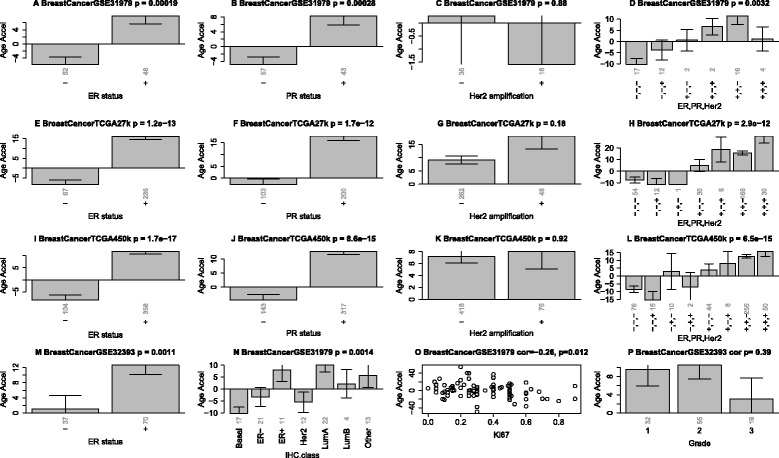
Age acceleration in breast cancer. Panels in the first column (A,E,I,M) show that estrogen receptor positive breast cancer samples have increased age acceleration in four independent data sets. Panels in the second column (B,F,J) show the same result for progesterone receptor positive cancers. Panels in the third columns (C,G,K) show that HER2/neu amplification is not associated with age acceleration. Panels in the fourth column (D,H,L) show how combinations of these genomic aberrations affect age acceleration. N) Age acceleration across the following breast cancer types: Basal-like, HER2-type, luminal A, luminal B, and healthy (normal) breast tissue. O) Ki-67 expression versus age acceleration. P) Tumor grade is not significantly related to age accelerations reflecting results from Additional file 3. Vertical grey numbers on the x-axis report sample sizes. The figure titles report the data source (GSE identifier from GEO or TCGA), and the Kruskal Wallis test p-value (except for panels O and P which report correlation test p-values).
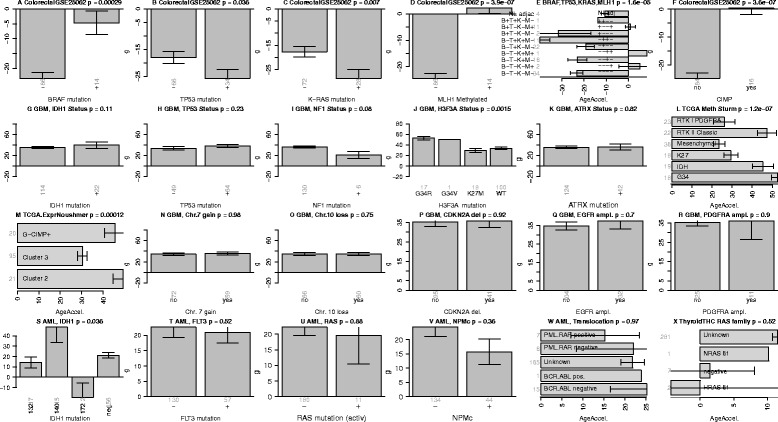
Age acceleration in colorectal cancer, GBM and AML. A-F) report results for colorectal cancer. Mean age acceleration (y-axis) in colorectal cancer versus mutation status (denoted by +) in A) BRAF, B) TP53, C) K-RAS. D) Promoter hyper methylation of the mismatch repair gene MLH1 (denoted +) is significantly associated with age acceleration. E) Mean age acceleration across different patient groups defined by combinations of BRAF, TP53, K-RAS, MLH1 status. The first bar reports the age acceleration in normal adjacent colorectal tissue from cancer patients but the sample size of 4 is rather low. F) CpG island methylator phenotype is associated with age acceleration. G-R) present results for various genomic abnormalities in glioblastoma multiforme. J) H3F3A mutations versus age acceleration. Samples with a G34R mutation have the highest age acceleration. Panels S-W (last row) show results for various genomic aberrations in acute myeloid leukemia. X) Thyroid cancer age acceleration versus RAS family mutation status is inconclusive since mutation status was largely unknown.
Erratum for
-
DNA methylation age of human tissues and cell types.Genome Biol. 2013;14(10):R115. doi: 10.1186/gb-2013-14-10-r115. Genome Biol. 2013. PMID: 24138928 Free PMC article.
References
Publication types
LinkOut - more resources
Full Text Sources
Other Literature Sources
